
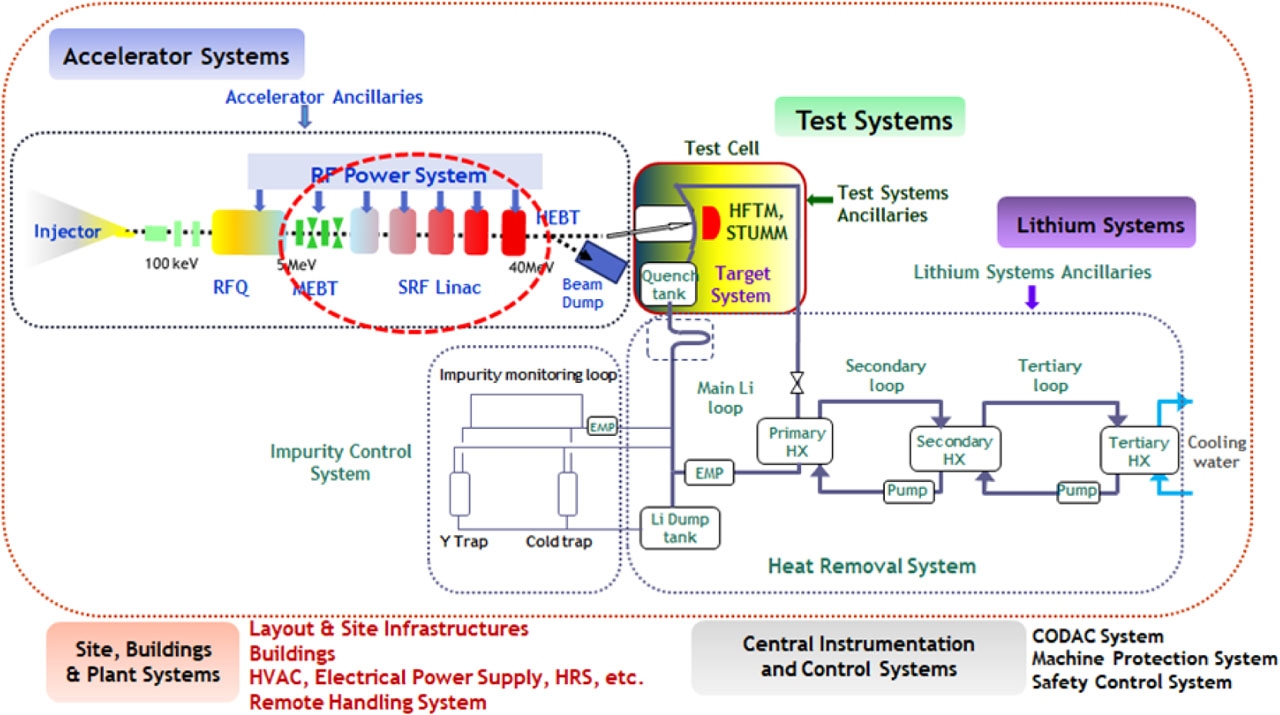
Fig. 1.
Scheme of DEMO oriented neutron source. The section of interest to us is within the red elliptical dashes. Courtesy of Dr. W. Królas.
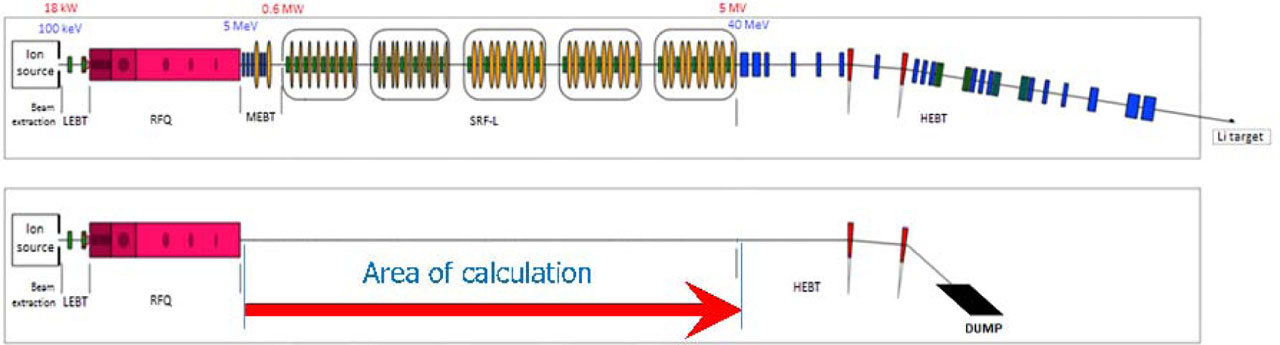
Fig. 2.
Layout of the DONES accelerator systems [4] (top) and the commissioning line of DONES accelerator systems (bottom).
Table 1.
Calculated beams
| Number | Particles | Beam energy (MeV) | Beam current (mA) |
|---|---|---|---|
| 1 | Protons | 2.5 | 10 |
| 2 | Deuterons | 5 | 15 |
| 3 | Deuterons | 5 | 125 |
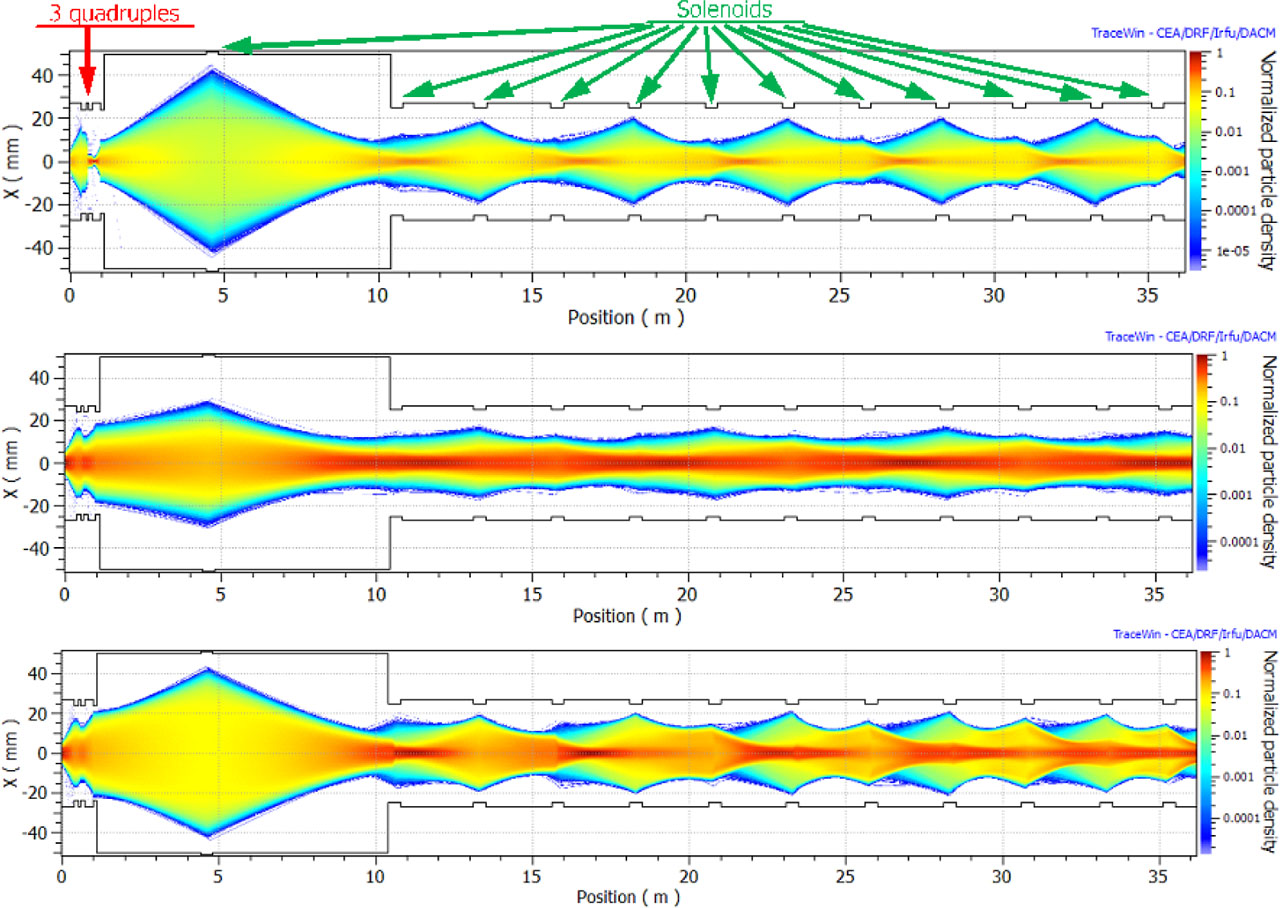
Fig. 3.
The “more realistic” beams, vertical cross-section along the calculations. Top: 2.5 MeV, 10 mA proton beam; middle: 5 MeV, 15 mA deuteron beam; bottom: 5 MeV, 125 mA deuteron beam.

Fig. 4.
Calculated losses. Top: 2.5 MeV, 10 mA “more realistic” proton beam; middle: 5 MeV, 15 mA “more realistic” deuteron beam; bottom: 5 MeV, 125 mA “more realistic” deuteron beam.
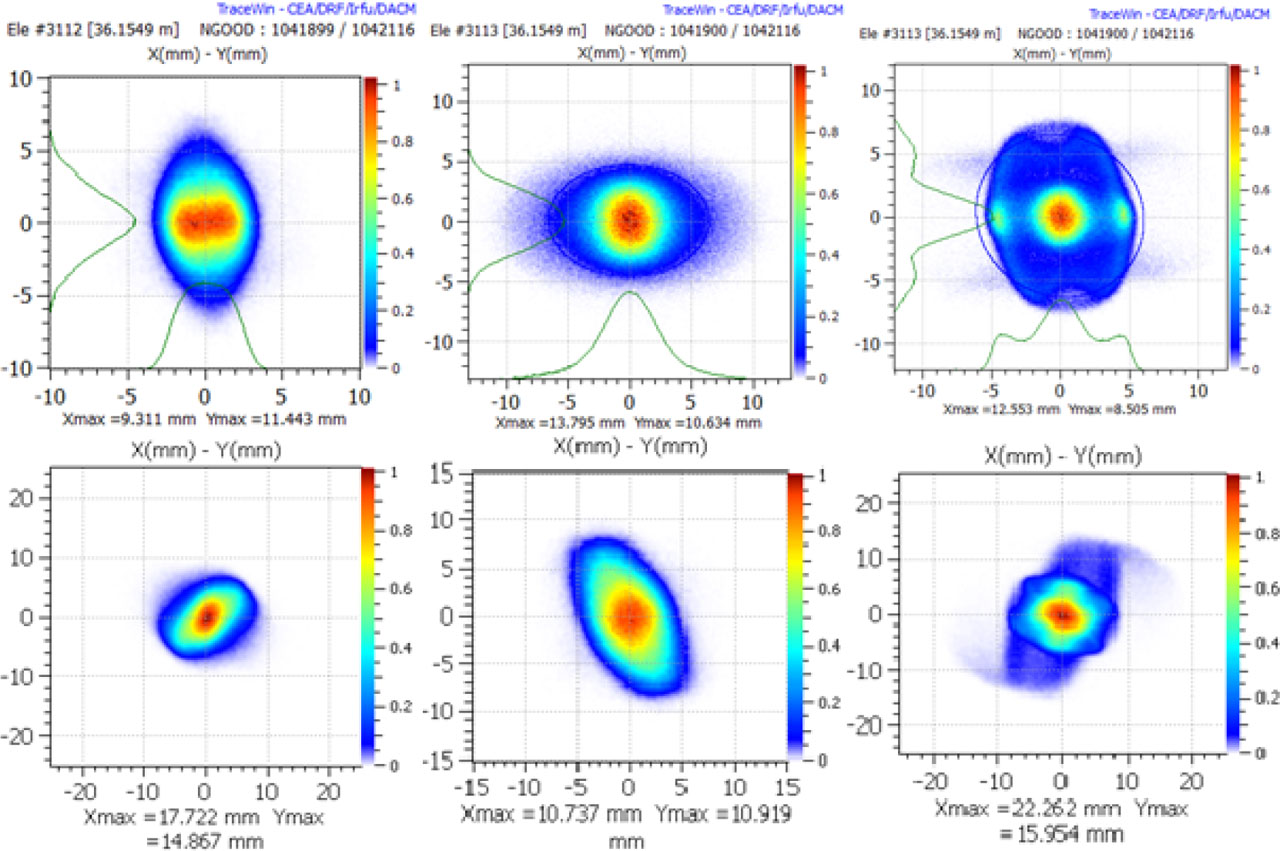
Fig. 5.
The geometrical particle distribution for “more realistic” beams in the exit of the calculation. Top row: beams leaded by solenoids; bottom row: beams leaded by quadruples. Left column: 2.5 MeV, 10 mA proton beam; middle column: 5 MeV, 15 mA deuteron beam; right column: 5 MeV, 125 mA deuteron beam.