EUROfusion is a consortium of thermonuclear fusion institutes from 28 European countries that began in 2014, as a successor to European Fusion Development Agreement (EFDA). Its aim is to build a functional prototype fusion reactor by the year 2050. Early Neutron Source (ENS) is a EUROfusion program responsible for the development of DONES – Demo Oriented Neutron Source. DONES will succeed the Linear IFMIF Prototype Accelerator (LIPAC) and represents a simplification of International Fusion Material Irradiation Facility Engineering Validation and Engineering Design Activities (IFMIF/EVEDA) [1].
DONES will be a neutron source with sufficiently high intensity and a spectral range of neutrons generated in D-T reactions to enable the generation of structural defects in materials at the level of 20 dpa – properties that currently existing devices do not possess. DONES will produce a 125 mA deuteron beam that can be accelerated to 40 MeV energy and will impact a liquid lithium curtain leading to intensive neutron production. Those neutrons will act with testing probes of materials for a future fusion reactor placed in a test cell of the DONES system [2].
DONES (see Fig. 1) has three main components: (1) accelerator systems, (2) test systems, and (3) lithium systems. The accelerator systems (see Fig. 2) contain: a deuteron injector, 100 keV low energy beam transport section (LEBT), radio frequency quadruple accelerator (RFQ), medium energy beam transport section (MEBT), superconducting radio frequency linear accelerator (SRF-L) and high energy beam transport section (HEBT) [3].
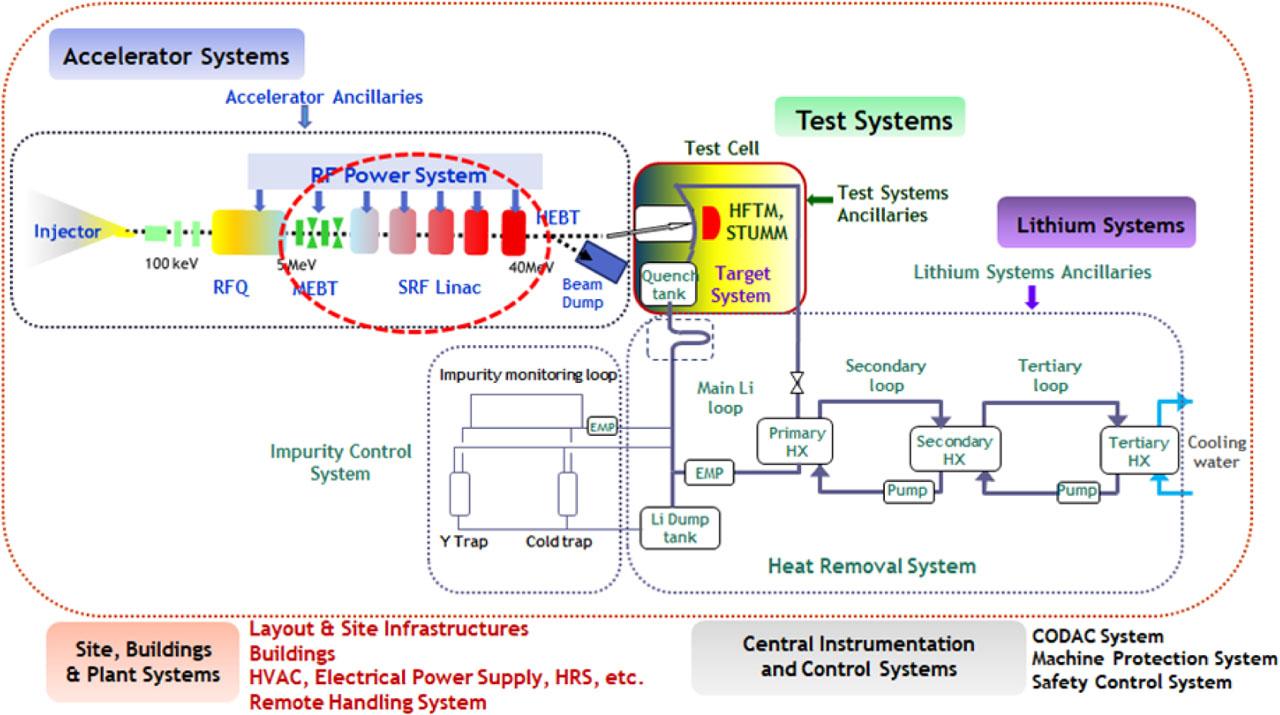
Scheme of DEMO oriented neutron source. The section of interest to us is within the red elliptical dashes. Courtesy of Dr. W. Królas.
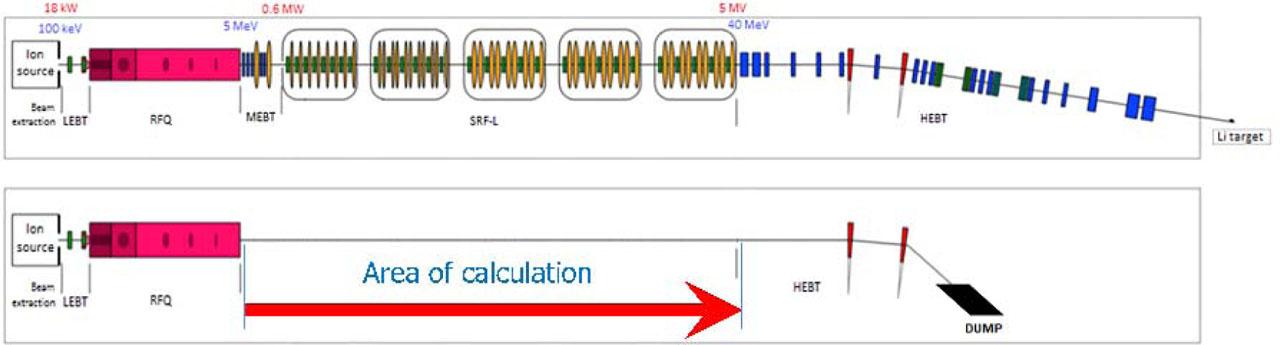
Layout of the DONES accelerator systems [4] (top) and the commissioning line of DONES accelerator systems (bottom).
The objective of this work was to calculate a commissioning line for the DONES accelerator systems. During the commissioning of a RFQ accelerator, proton and deuteron test beams are delivered to a beam dump using the same commissioning line. Our task was to optimize delivery of the proton and deuteron beams from the end of the RFQ to the entrance of HEBT, as shown in Fig. 2. Results of this work will serve as an input for colleagues who will calculate beam delivery from entrance of HEBT to the beam dump.
We calculated delivery of the beam for two commissioning line options: solenoids and quadruples magnets. An additional design requirement was the insertion a diagnostic plate (DP) as close as possible to the exit of the RFQ. The DP is a series of diagnostic elements, 3.0–3.5 m in length, with an inner diameter of 100 mm. The DP could not be sub-divided, so no leading element could be placed inside it.
Using beam dynamics calculations, we delivered each beam from the RFQ section to the entrance of HEBT section, with the goal of minimizing any possible beam losses. We based every commissioning line design we propose on TraceWin calculations and optimizations, as opposed to using any other externally available code. We did this because CEA Saclay, which developed TraceWin code initially for linear and non-linear, 2D or 3D, charged particle beam dynamics calculations and optimization of beam parameters, specified its use for this work. The beam is modeled both by its second order momentum (in linearized force) or/and by a macro-particle distribution (in non-linear forces). Their simultaneous use allows easy study of the impact of non-linear effects. The different elements of a linac can be modeled using analytic expression or field maps. The code can run automatic procedures of accelerator and beam tuning, including statistics errors on elements and the diagnostics [5].
All calculations were based on technical data provided by CEA Saclay and supplemented by [6] Bead Pull Measurements performed in 2018 by Italian National Institute for Nuclear Physics (INFN), National Laboratories of Legnaro at the Japanese Rokkasho Institute for Fusion Energy. We used the particle distribution files provided by CEA as beam input.
Calculations were performed for three different beams, as shown in Table 1.
Calculated beams
| Number | Particles | Beam energy (MeV) | Beam current (mA) |
|---|---|---|---|
| 1 | Protons | 2.5 | 10 |
| 2 | Deuterons | 5 | 15 |
| 3 | Deuterons | 5 | 125 |
Each beam was calculated for two different entrance beam distributions, which we referred to as the “ideal” and “more realistic” beam options. The “ideal” beam was calculated as an optimal deuteron beam (I = 125 mA, E = 5 MeV) at the exit of RFQ. The “more realistic” beam, which we designed for “real world” application was calculated based on simulations performed with the model of RFQ measured at Rokkasho. The “more realistic” beam had a “tail” of low energy (<1 MeV) particles [7].
In the first set of calculations, solenoids were the leading elements; in the second one, quadruples were the leading element [8]. In each set we initially calculated three types of “ideal” beam (proton and two variants of deuteron beam). These calculations gave us entry parameters that were necessary for the subsequent calculation of the “more realistic” beams, especially in respect to size of drift area, number of solenoids or quadruples and size of gaps between them.
Design for a beam led by solenoids contained three quadruples (as a “matching section”), a 3.3 m diagnostic plate, a solenoid, a 5.6 m drift area, and eleven subsequent solenoids. Scheme of the design is shown in Fig. 3 (top plot).
- –
The 2.5 MeV, 10 mA proton beam. There were no energy losses in calculation for “ideal” beam. The “more realistic” beam is shown in upper plot of Fig. 3, and placement of energy losses for the “more realistic” beam is shown in Fig. 4 (upper plot). Total losses are 0.202 W and they occurred mainly in “matching section”. Particle energy in the exit of our calculation is 2.5000 ± 0.0005 MeV and maximal energy deviation is 0.045 MeV. The particle distribution in the exit of the calculation (36.154908 m) is shown in Fig. 5 (upper left plot). The maximum distance from beam centre is 9.3 mm in X-direction and 11.4 mm in Y-direction. Our calculations show that the beam is slightly defocusing, and the maximal angle deviation of protons propagation is 17.5 mrad.
- –
The 5 MeV, 15 mA deuteron beam. The “ideal” beam showed no losses. Figure 3 (middle plot) and Fig. 4 (middle plot) show the “more realistic” beam and placement of its energy losses. Total energy losses are 0.592 W and they are located mainly in “matching section”. Energy of particles at the exit of calculation is 5.0489 ± 0.0011 MeV and maximal energy deviation is 0.07 MeV. Figure 5 (top middle plot) shows final particle distribution. The maximal (particle) distance from the beam centre is 13.8 mm in X-direction and 10.6 mm in Y-direction. The beam is focussing and maximal angle deviation of deuterons propagation is 7.6 mrad.
- –
The 5 MeV, 125 mA “ideal” deuteron beam. The “ideal” beam showed no losses. The total energy losses of “more realistic” beam shown in Fig. 3 (lower plot) are significantly higher, 4.939 W. Placement of the losses is shown in lower plot of Fig. 4, the losses are mainly located in “matching section”. Particles energy in the exit of calculation is 5.0489 ± 0.0016 keV, and maximal energy deviation is 0.16 MeV. The final particle distribution is shown in Fig. 5 (upper right plot). The maximal distance from centre of the beam is 12.6 mm in X-direction and 8.5 mm in Y-direction. The beam is mainly well focussed, but two additional foci were observed, one on either side of the primary focus. The main part of the beam is still focussing, but additional parts starts to slightly defocussing. Maximal angles deviation of particles is 16.5 mrad.
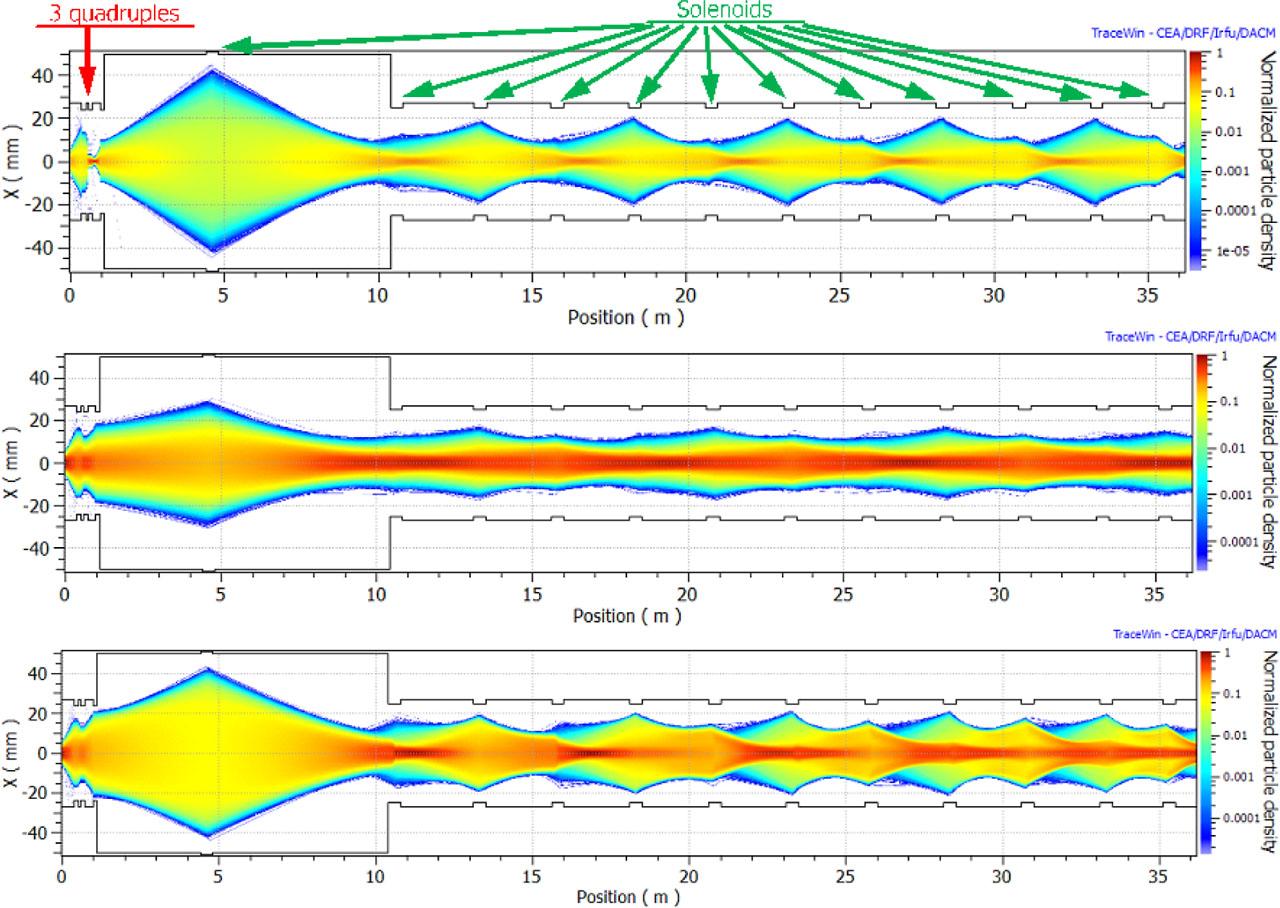
The “more realistic” beams, vertical cross-section along the calculations. Top: 2.5 MeV, 10 mA proton beam; middle: 5 MeV, 15 mA deuteron beam; bottom: 5 MeV, 125 mA deuteron beam.
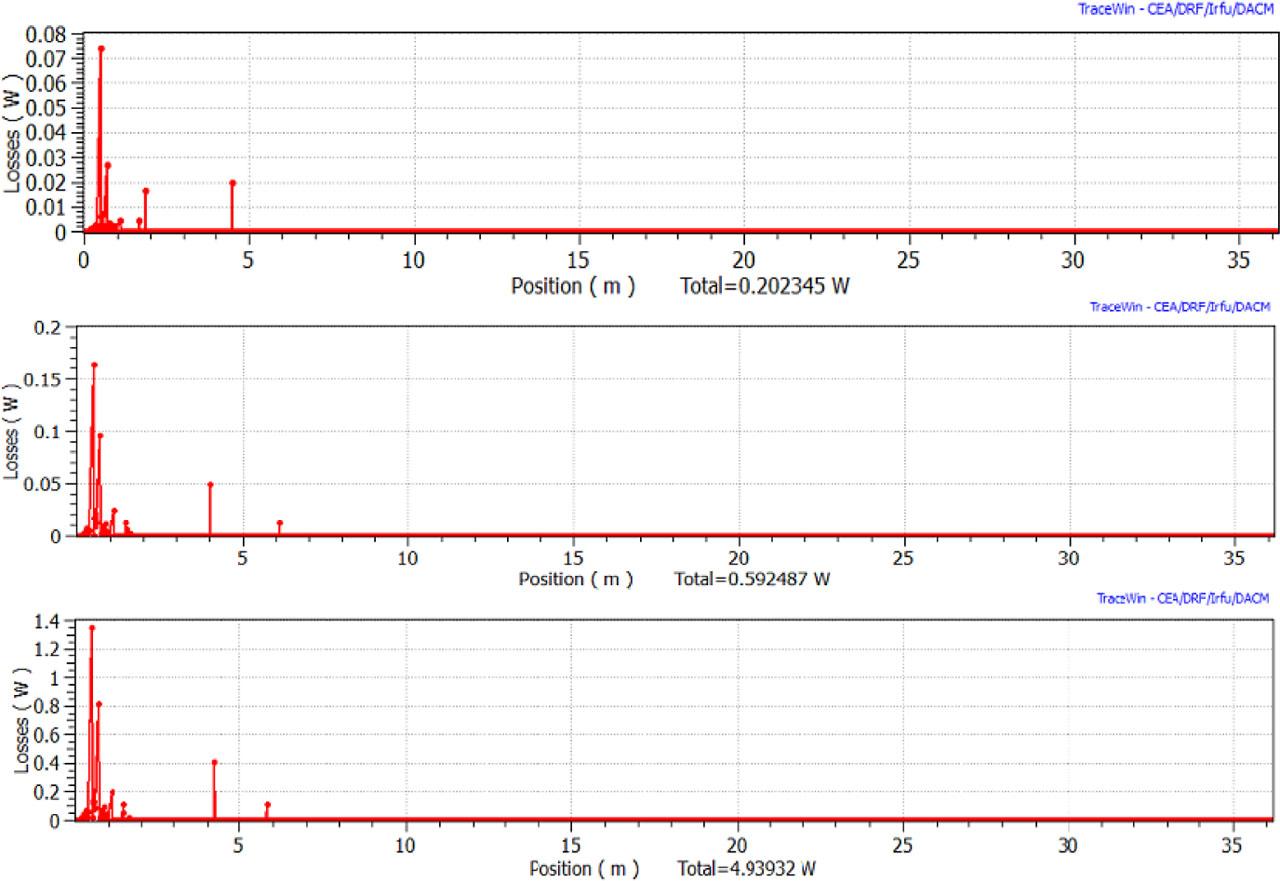
Calculated losses. Top: 2.5 MeV, 10 mA “more realistic” proton beam; middle: 5 MeV, 15 mA “more realistic” deuteron beam; bottom: 5 MeV, 125 mA “more realistic” deuteron beam.
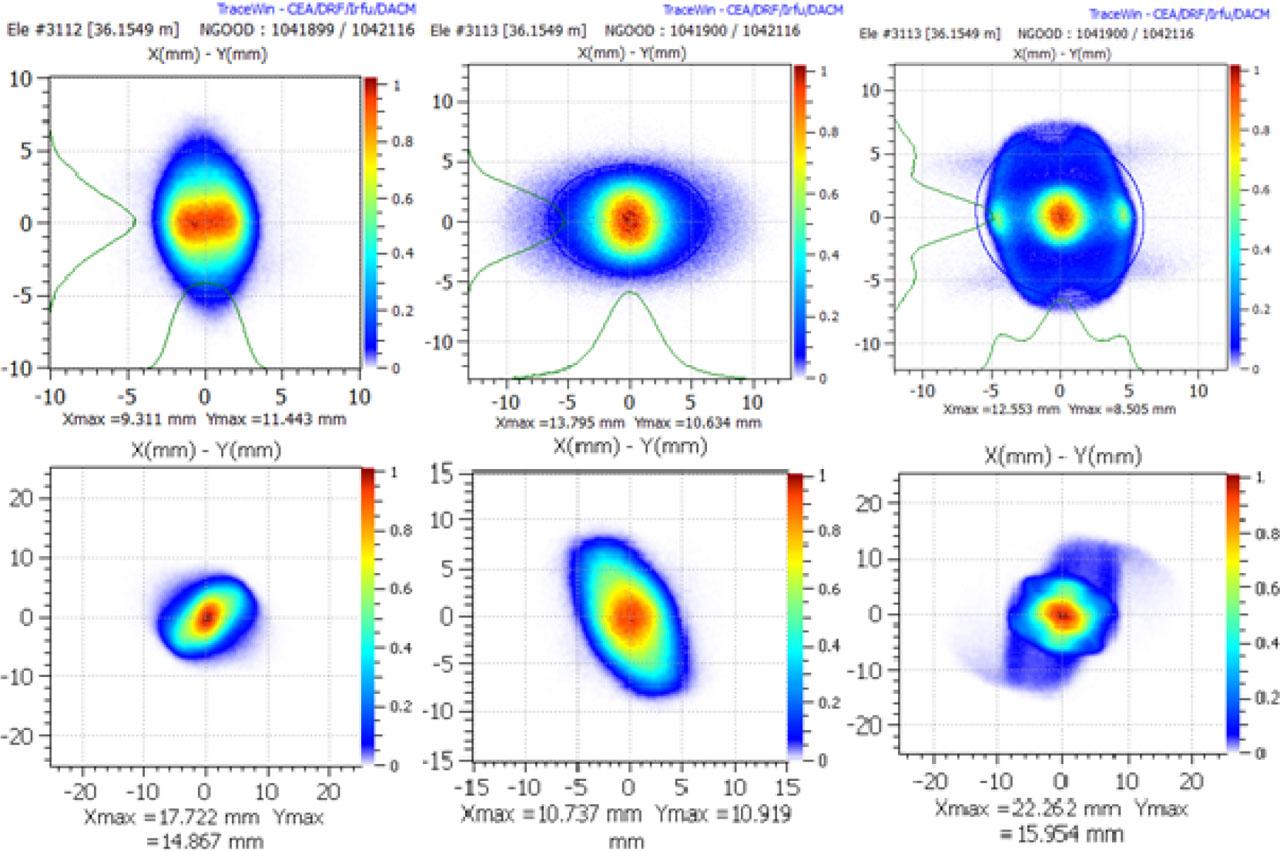
The geometrical particle distribution for “more realistic” beams in the exit of the calculation. Top row: beams leaded by solenoids; bottom row: beams leaded by quadruples. Left column: 2.5 MeV, 10 mA proton beam; middle column: 5 MeV, 15 mA deuteron beam; right column: 5 MeV, 125 mA deuteron beam.
The beam led by quadruples contained three “matching quadruples”, a 3.3 m diagnostic plate, a solenoid, a 3.3 m drift area, five “matching quadruples” and 25 subsequent quadruples. The first 8.3 meters of the design is identical as case with beams led by solenoids, changes start with shortened drift area (compare Fig. 3, top plot). Area after “matching quadruples” with last 25 quadruples is extended in radius, 38 mm instead of 25 mm.
- –
The 2.5 MeV, 10 mA proton beam. The “ideal” beam showed no losses. The total energy losses of “more realistic” beam are 0.263 W, placed mainly at the entry “matching section” with secondary losses located between the first and third quadruple beyond the drift area. Particle energies at the end of calculation was 2.5000 ± 0.0005 MeV, and maximal energy deviation was 0.04 MeV. The final geometrical distribution of particles is shown in Fig. 5 (lower left plot). The maximal distance from the beam centre is 17.7 mm in X-direction and 14.9 mm in Y-direction. The beam is strongly defocussing in X-direction and steady focussing in Y-direction. Maximal angle deviation of particle motion is 24.3 mrad horizontally (X-direction) and 8.0 mrad vertically (Y-direction).
- –
The 5 MeV, 15 mA deuteron beam. The “ideal” beam showed no losses, but total energy losses for “more realistic” beam are 0.592 W, placed mainly in the entry “matching section”. Particle energies at the exit of calculation is 5.0489 ± 0.0011 MeV, and maximal energy deviation is 0.08 MeV. The geometrical particles distribution in the exit of calculation is shown in Fig. 5 (lower middle plot). The maximal distance from the beam centre is 10.7 mm in X-direction and 10.9 mm in Y-direction. The beam is defocussing in X-direction and focussing in Y-direction. Maximal angle deviation of particle motion is 13.4 mrad in X-direction and 9.7 mrad in Y-direction.
- –
The 5 MeV, 125 mA deuteron beam. The “ideal” beam showed no losses. Total energy losses for “more realistic” beam are 5.43 W, located mainly in the entry “matching section”. Particle energies at the end of the calculations were 5.0489 ± 0.0016 MeV, and maximal energy deviation of particles is 0.16 MeV. The geometrical particles distribution in the exit of calculation is shown in Fig. 5 (bottom right plot). The maximal distance from the beam centre is 22.3 mm in X-direction and 16.0 mm in Y-direction. The beam is defocussing in X-direction and generally focusing in Y-direction, however particles with extreme geometrical positions are slightly defocusing. Maximal angle deviation of particles motion is 18.0 mrad in X-direction and 11.4 mrad in Y-direction.
Calculations for “ideal” beams, with either solenoids or quadruples as the leading elements, indicated no beam losses. Calculations for the “more realistic” beams indicated some losses, however. Total beam losses for both the 10 mA proton beam and 15 mA deuteron beam ranged from 0.2–0.6 W. For the 125 mA deuteron beam, beam losses were 4.94 W for the solenoid variant, and 5.43 W for the quadruple variant.
Almost all beam losses for beams led by solenoids were concentrated in the first meter of the calculations, with an additional small loss located near the first solenoid, just after the DP section. The majority of losses when the beams were led by quadruples occurred in the same sections, but we observed some further losses after the drift section (8–9 m for proton beam and 12–13 m for full energy deuteron beam). To avoid more beam losses in the quadruples-led elements, we extended by 20 mm the diameter of all elements after the initial five “matching quadruples”.
All beam losses were caused by low-energy protons or deuterons at the “tail” of the “more realistic” beam distribution.
Based on the performed calculations and optimizations we conclude that either variant of the commission line, with solenoids and with quadruples as leading elements, could be implemented. However, the obtained results suggest that a beam led by solenoids could be better than the one led by quadruples. The number of devices required in first variant is significantly lower and it was not necessary to increase the diameter of any elements. Observed beam losses were slightly lower and the quality of particle distribution at the exit of the calculation is observably better.
We recommended implementing the commissioning line with solenoids as leading elements.