
Fig. 1.
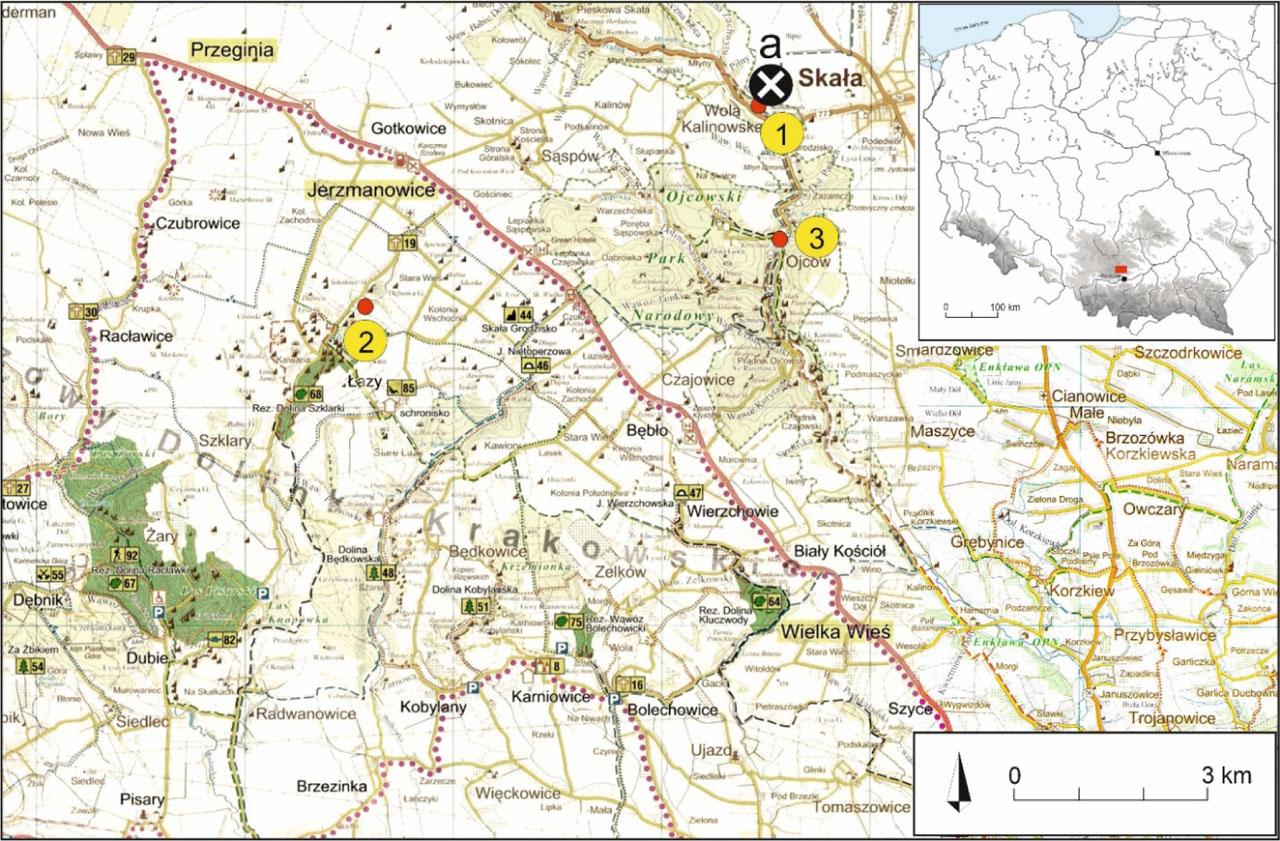
Fig. 2.
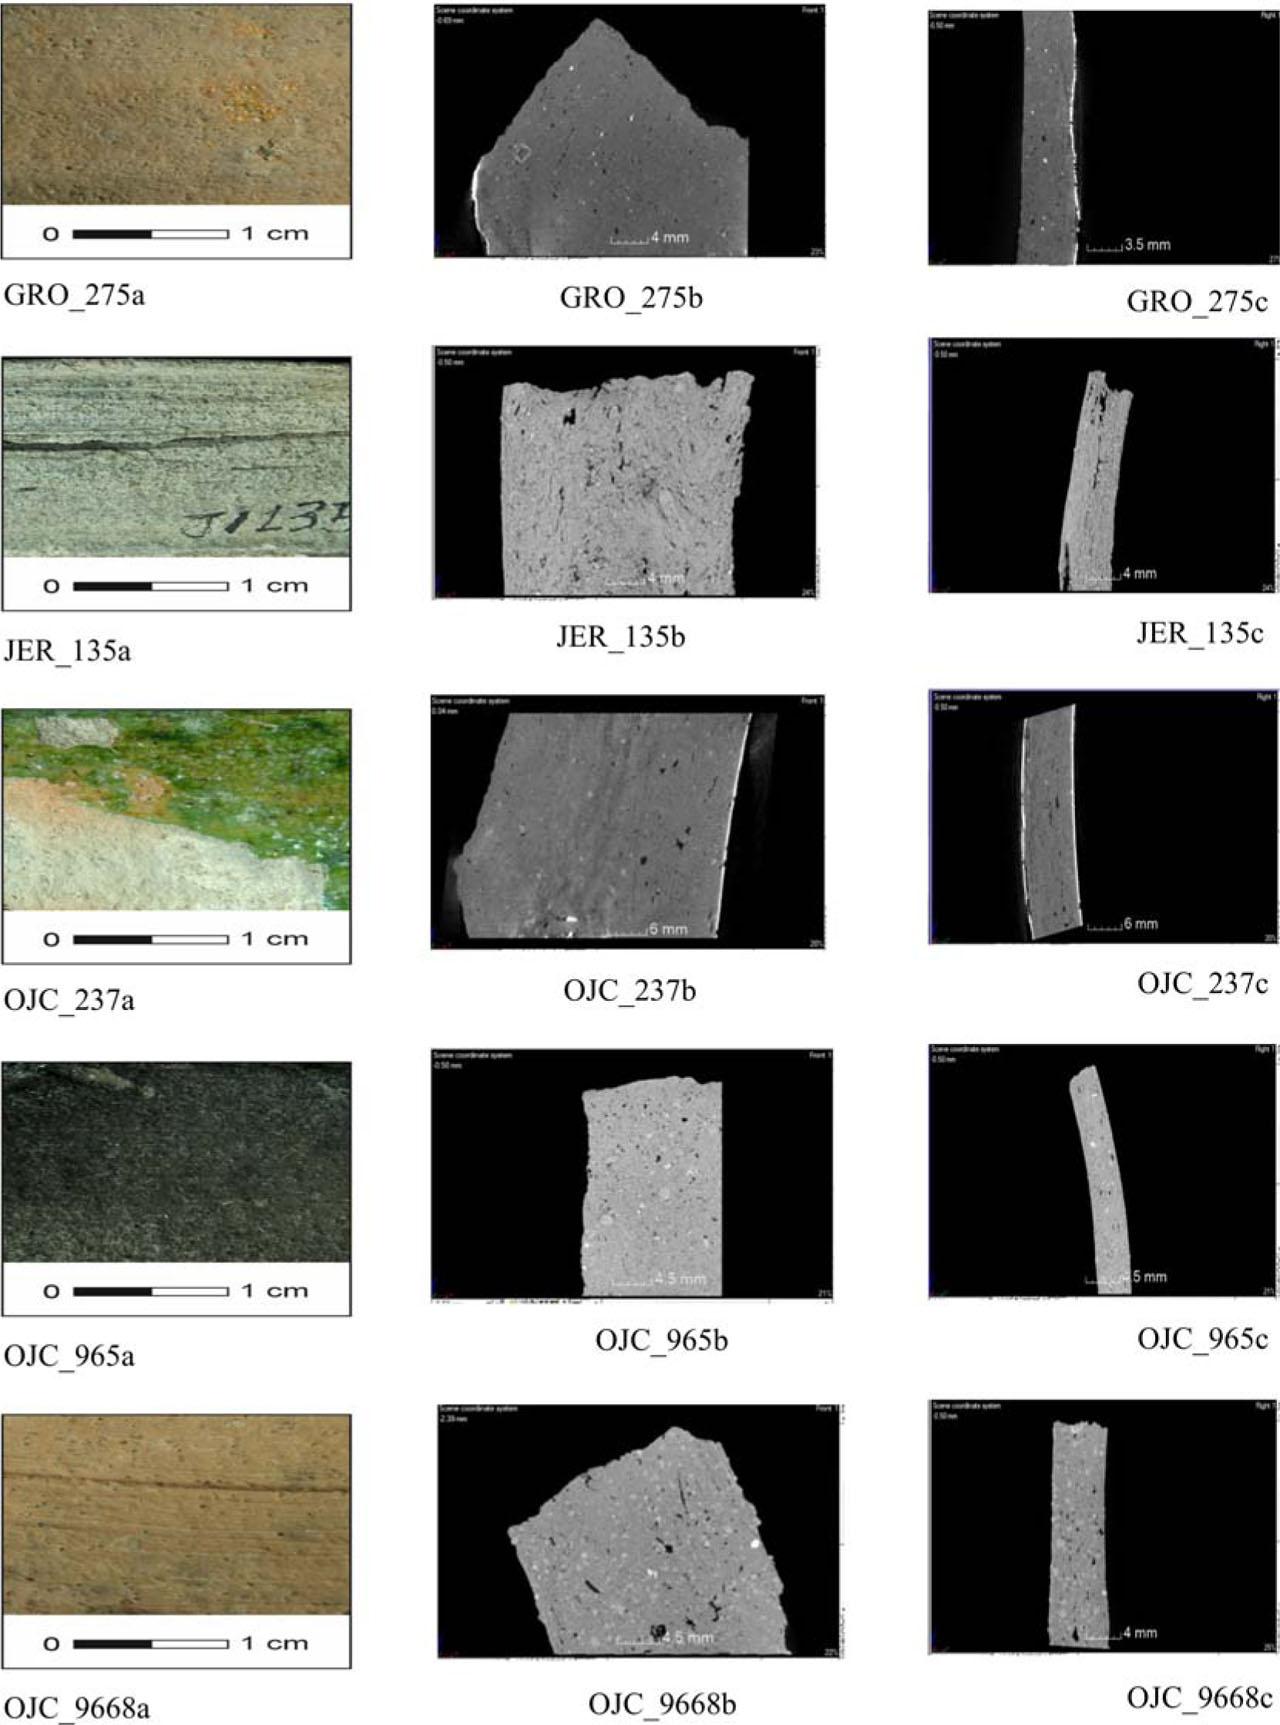
Fig. 3.
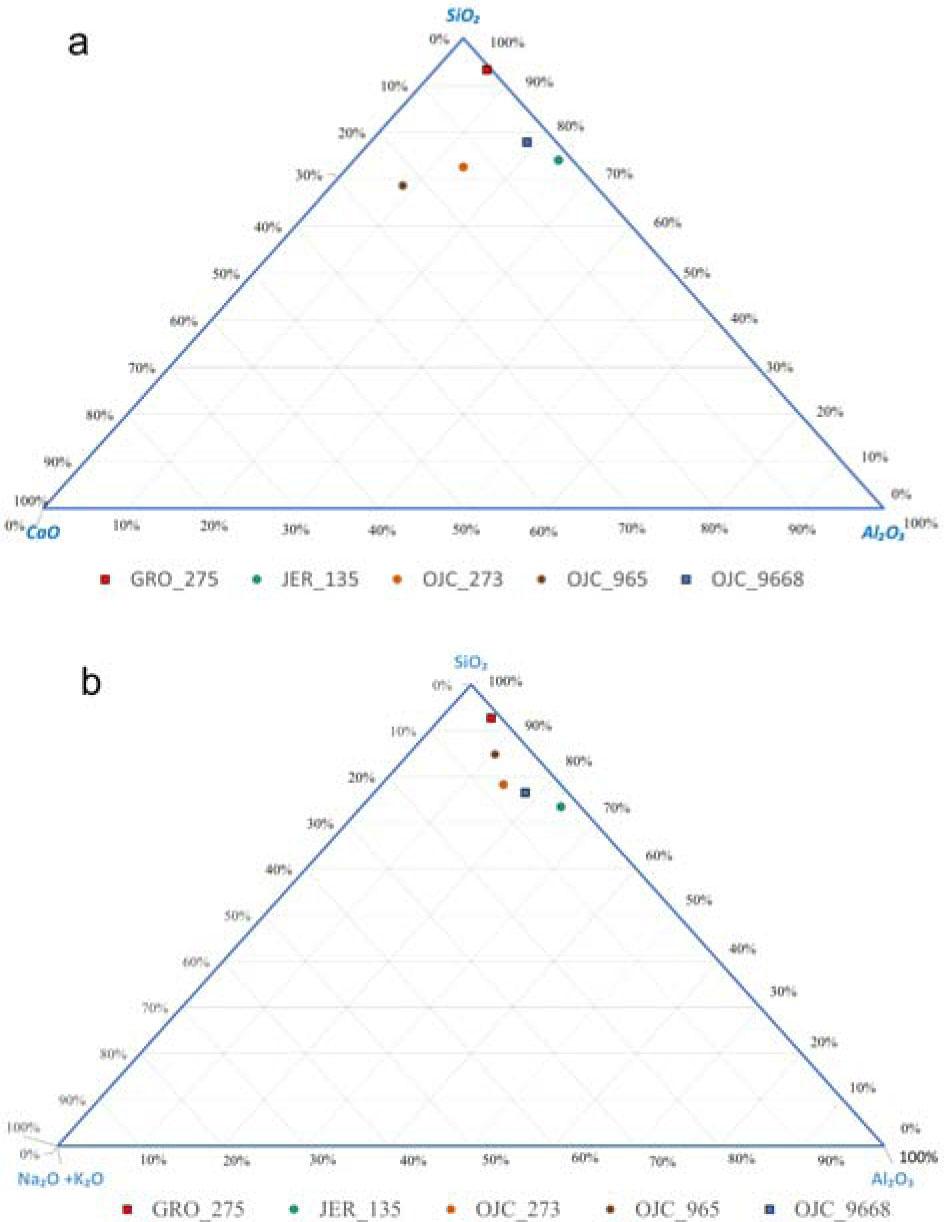
Fig. 4.
Fig. 5.
Fig. 6.
Fig. 7.
Fig. 8.
Fig. 9.
Fig. 10.
Fig. 11.
Fig. 12.
Elemental composition of the matrix of the ceramic body of the analyzed pottery samples and clay deposits in the Kraków Upland (in wt%, μg/g, and standard deviation) determined by XRF technique
| Elements | Clay deposits | GRO_275 | JER_135 | OJC_273 | OJC_965 | OJC_9668 |
|---|---|---|---|---|---|---|
| Determined concentration ± St.Dev. (%) | ||||||
| Na | 0.055 ± 0.0079 | <LOD | 0.15 ± 0.21 | 1.19 ± 0.91 | 0.198 ± 0.073 | 0.36 ± 0.13 |
| Mg | 0.320 ± 0.072 | 0.17 ± 0.21 | 0.76 ± 0.074 | 0.59 ± 0.25 | 1.08 ± 0.38 | 0.84 ± 0.19 |
| Al | 3.9 ± 2.0 | 3.0 ± 2.2 | 11.6 ± 3.3 | 6.1 ± 2.6 | 3.9 ± 3.7 | 8.50 ± 0.98 |
| Si | 11.8 ± 5.2 | 42.3 ± 3.2 | 31.2 ± 1.9 | 28.7 ± 2.9 | 28 ± 18 | 31.2 ± 2.2 |
| P | 0.039 ± 0.024 | 0.106 ± 0.012 | 0.091 ± 0.099 | 0.25 ± 0.19 | 2.8 ± 2.7 | 0.18 ± 0.035 |
| S | 0.016 ± 0.0079 | 0.030 ± 0.012 | 0.097 ± 0.034 | 0.56 ± 0.18 | 0.12 ± 0.072 | 0.063 ± 0.015 |
| K | 1.03 ± 0.25 | 0.88 ± 0.62 | 1.93 ± 0.48 | 3.2 ± 0.17 | 2.3 ± 2.2 | 3.3 ± 1.5 |
| Ca | 1.42 ± 0.32 | 0.35 ± 0.31 | 1.04 ± 0.35 | 8 ± 8 | 14 ± 6 | 1.78 ± 0.32 |
| Ti | 0.180 ± 0.087 | 0.087 ± 0.085 | 0.69 ± 0.32 | 0.57 ± 0.12 | 0.25 ± 0.23 | 0.78 ± 0.59 |
| Fe | 2.23 ± 0.39 | 0.94 ± 0.78 | 3.05 ± 0.91 | 4.6 ± 1.4 | 2.5 ± 2.1 | 4.64 ± 0.59 |
| Determined concentration ± St.Dev. (μg/g) | ||||||
| V | 39 ± 12 | 210 ± 150 | 236 ± 46 | 140 ± 130 | 35 ± 31 | 121 ± 67 |
| Cr | 48 ± 11 | 94 ± 110 | 148 ± 18 | 100 ± 26 | 62 ± 17 | 180 ± 94 |
| Mn | 180 ± 19 | 560 ± 150 | 360 ± 300 | 1600 ± 380 | 1610 ± 700 | 820 ± 150 |
| Ni | 23 ± 6 | 208 ± 54 | 33 ± 13 | 51 ± 35 | 65 ± 56 | 68 ± 5 |
| Cu | 15 ± 4 | 22 ± 9 | 55 ± 19 | 369 ± 18 | 58 ± 15 | 47 ± 34 |
| Zn | 82 ± 64 | <LOD | 318 ± 60 | 229 ± 34 | 330 ± 24 030 | 256 ± 22 |
| Ga | 12 ± 4 | <LOD | 33 ± 16 | 147 ± 67 | 39 ± 29 | 34 ± 8 |
| As | 17 ± 5 | 120 ± 110 | <LOD | <LOD | 115 ± 19 | 35 ± 13 |
| Rb | 64 ± 10 | 73 ± 32 | 126 ± 40 | 184 ± 58 | 143 ± 18 | 165 ± 15 |
| Sr | 42 ± 8 | 90 ± 20 | 87 ± 49 | 160 ± 21 | 390 ± 120 | 143 ± 15 |
| Y | 34 ± 7 | 34 ± 44 | 16 ± 7 | 167 ± 71 | 11 ± 6 | 34 ± 10 |
| Zr | 84 ± 45 | 270 ± 120 | 235 ± 79 | 269 ± 68 | 104 ± 12 | 411 ± 340 |
| Nb | 22 ± 5 | 39 ± 5 | 63 ± 7 | 45 ± 15 | 42 ± 16 | 94 ± 40 |
| Ba | 187 ± 32 | <LOD | 650 ± 480 | 840 ± 350 | 1580 ± 200 | 1130 ± 530 |
The comparison of determined and known (reference) concentrations of chemical compounds in reference samples
| Compound | Reference A | Reference C | ||
|---|---|---|---|---|
| Concentration (wt%) | Concentration (wt%) | |||
| Reference | Determined ± St.Dev. | Reference | Determined ± St.Dev. | |
| Na2O | 1.62 | 1.740 ± 0.013 | 1.88 | 2.440 ± 0.080 |
| MgO | 0.27 | 0.150 ± 0.040 | 0.3 | 0.337 ± 0.040 |
| Al2O3 | 34.16 | 35.43 ± 0.32 | 24.8 | 27.47 ± 0.27 |
| SiO2 | 59.97 | 55.20 ± 0.33 | 69.57 | 63.66 ± 0.38 |
| K2O | 3.33 | 4.41 ± 0.13 | 2.93 | 4.119 ± 0.055 |
| CaO | 0.53 | 0.52 ± 0.11 | 0.52 | 0.535 ± 0.012 |
| Fe2O3 | nd | 1.35 ± 0.41 | 0.3 | 0.3800 ± 0.0023 |
| BaO | 0.12 | 0.130 ± 0.021 | nd | 0.157 ± 0.012 |
The correlation data of the ceramic sample according to the data from XRF analysis
| Na2O | MgO | Al2O3 | SiO2 | P2O5 | SO3 | K2O | CaO | TiO2 | Fe2O3 | V | Cr2O3 | MnO | NiO | Cu | ZnO | Ga | As | Rb | SrO | Y2O3 | Zr | Nb | BaO | Pb | |
|---|---|---|---|---|---|---|---|---|---|---|---|---|---|---|---|---|---|---|---|---|---|---|---|---|---|
| Na2O | 1 | ||||||||||||||||||||||||
| MgO | −0.03 | 1 | |||||||||||||||||||||||
| Al2O3 | 0 | 0.32 | 1 | ||||||||||||||||||||||
| SiO2 | −0.45 | −0.87 | −0.38 | 1 | |||||||||||||||||||||
| P2O5 | −0.2 | 0.67 | −0.45 | −0.45 | 1 | ||||||||||||||||||||
| SO3 | 0.97 | −0.04 | −0.04 | −0.46 | −0.12 | 1 | |||||||||||||||||||
| K2O | 0.67 | 0.56 | 0.36 | −0.77 | 0.01 | 0.54 | 1 | ||||||||||||||||||
| CaO | 0.26 | 0.63 | −0.43 | −0.65 | 0.9 | 0.35 | 0.28 | 1 | |||||||||||||||||
| TiO2 | 0.33 | 0.41 | 0.88 | −0.56 | −0.42 | 0.22 | 0.75 | −0.28 | 1 | ||||||||||||||||
| Fe2O3 | 0.69 | 0.44 | 0.53 | −0.71 | −0.22 | 0.56 | 0.97 | 0.08 | 0.87 | 1 | |||||||||||||||
| V | 0.18 | −0.72 | 0.36 | 0.44 | −0.84 | 0.24 | −0.31 | −0.71 | 0.15 | −0.08 | 1 | ||||||||||||||
| Cr2O3 | −0.06 | 0.06 | 0.79 | −0.03 | −0.66 | −0.23 | 0.4 | −0.7 | 0.83 | 0.55 | 0.27 | 1 | |||||||||||||
| MnO | 0.62 | 0.43 | −0.48 | −0.62 | 0.63 | 0.65 | 0.51 | 0.9 | −0.16 | 0.33 | −0.57 | −0.59 | 1 | ||||||||||||
| NiO | −0.39 | −0.78 | −0.68 | 0.94 | −0.18 | −0.39 | −0.73 | −0.35 | −0.76 | −0.75 | 0.17 | −0.3 | −0.31 | 1 | |||||||||||
| Cu | 0.98 | −0.08 | −0.04 | −0.43 | −0.16 | 1 | 0.55 | 0.31 | 0.23 | 0.57 | 0.26 | −0.2 | 0.63 | −0.37 | 1 | ||||||||||
| ZnO | 0.12 | 0.94 | 0.57 | −0.93 | 0.45 | 0.15 | 0.6 | 0.5 | 0.6 | 0.56 | −0.42 | 0.17 | 0.33 | −0.95 | 0.11 | 1 | |||||||||
| Ga | 0.98 | 0.11 | 0.06 | −0.59 | −0.07 | 0.99 | 0.66 | 0.39 | 0.34 | 0.68 | 0.14 | −0.15 | 0.68 | −0.52 | 0.99 | 0.29 | 1 | ||||||||
| As | −0.58 | −0.15 | −0.82 | 0.49 | 0.56 | −0.54 | −0.61 | 0.28 | −0.88 | −0.79 | −0.49 | −0.61 | 0.1 | 0.72 | −0.55 | −0.45 | −0.6 | 1 | |||||||
| Rb | 0.75 | 0.59 | 0.32 | −0.87 | 0.11 | 0.67 | 0.98 | 0.43 | 0.68 | 0.94 | −0.29 | 0.23 | 0.63 | −0.8 | 0.67 | 0.67 | 0.79 | −0.63 | 1 | ||||||
| SrO | −0.03 | 0.71 | −0.44 | −0.56 | 0.98 | 0.04 | 0.2 | 0.95 | −0.32 | −0.04 | −0.88 | −0.62 | 0.76 | −0.26 | −0.01 | 0.49 | 0.1 | 0.46 | 0.29 | 1 | |||||
| Y2O3 | 0.98 | −0.21 | −0.07 | −0.3 | −0.29 | 0.97 | 0.54 | 0.17 | 0.23 | 0.58 | 0.31 | −0.11 | 0.55 | −0.25 | 0.99 | −0.04 | 0.95 | −0.53 | 0.62 | −0.13 | 1 | ||||
| Zr | 0.18 | −0.32 | 0.36 | 0.25 | −0.78 | −0.04 | 0.38 | −0.72 | 0.56 | 0.49 | 0.3 | 0.83 | −0.42 | 0.09 | 0.03 | −0.28 | 0.01 | −0.42 | 0.19 | −0.68 | 0.19 | 1 | |||
| Nb | −0.21 | 0.66 | 0.52 | −0.44 | 0.08 | −0.38 | 0.59 | −0.06 | 0.67 | 0.55 | −0.51 | 0.69 | −0.12 | −0.48 | −0.37 | 0.57 | −0.22 | −0.23 | 0.43 | 0.14 | −0.36 | 0.44 | 1 | ||
| BaO | 0.14 | 0.96 | 0.09 | −0.87 | 0.73 | 0.11 | 0.65 | 0.76 | 0.3 | 0.49 | −0.83 | −0.08 | 0.65 | −0.69 | 0.09 | 0.83 | 0.25 | −0.05 | 0.69 | 0.82 | −0.03 | −0.3 | 0.6 | 1 | |
| Pb | −0.29 | 0.12 | 0.8 | −0.11 | −0.28 | −0.2 | −0.22 | −0.38 | 0.42 | −0.03 | 0.52 | 0.37 | −0.6 | −0.42 | −0.22 | 0.39 | −0.18 | −0.51 | −0.17 | −0.4 | −0.3 | −0.12 | 0.06 | −0.18 | 1 |