Pottery is important for archaeologists, as analyses based on typology, technology, and provenance facilitate an improved understanding of the relationship between specific past technological approaches to its production and contemporaneous social and economic trends. These datasets then help to expand a more general view of how traditions developed, either independently and/or through external influence, and can be linked with specific communities from certain, well-defined chronological and spatial frameworks [1]. Pottery, nevertheless, has many important secrets that archaeometry can uncover, even if its manufacture is based on a long-standing tradition. To find some obvious traits for every operational sequence (harvesting raw materials, paste preparations, main and secondary forming techniques), the complicated operational chain involved in pottery manufacturing must be systematically investigated internally and externally of the sherds. Furthermore, the pottery undergoes many physical and chemical changes during the firing process [2], becoming a hard, durable material enriched with various mineral structures, voids, tempers, etc. Numerous analytical methods have been employed over the last century to investigate pottery. However, when managing cultural legacy items, the destructive nature of many of these available techniques presents an important concern. Fortunately, research technologies have become increasingly sophisticated and accurate, and nowadays, they perform non-destructive investigations and guarantee the preservation of the investigated materials. Related recent works use the combination of several complementary analytical methods for the characterization of pottery [3, 4]. Most recently, Chubarov et al. [5] describe the characteristics of XRF applied in the study of ceramics, concluding that the efficiency depends on the features of the analysis, and the studies reviewed complement the results with other methods. Ownby et al. [6] present results from neutron activation analysis and petrographic data for the study of ceramics. Among these innovative methods, X-ray computed tomography (XCT hereafter) produces good quality 3-D images that can offer an overview of the internal structure of the measured samples, therefore showing various aspects that would otherwise be unidentifiable. Based on the concept of interactions between X-rays and the investigated material, combined with an algorithm to reconstruct the recorded data [7,8,9,10], this method has been successfully applied in pottery research. Although the earliest investigations of this type of application were carried out back in the early 1930s [11], the full potential of this technique was recognized much later when it was applied to the identification and analysis of clay inclusions, voids, cracks, and surfaces [12,13,14,15,16,17,18]. These results proved that non-destructive internal structural analysis of ceramics might yield reliable data sets. Conventional XCT, while offering numerous benefits, is limited by imaging artifacts that can affect the accuracy of the results. These include partial volume effects, where a single voxel contains signals from multiple materials leading to blurred boundaries; ring artifacts, which appear as circular distortions caused by detector imperfections; and beam hardening, where lower-energy X-rays are absorbed more easily than higher-energy ones, resulting in streaks or shading that distort the true density of the material. Many scientific publications have a thorough explanation of these phenomena [19, 20]. A significant limitation of XCT is its difficulty in distinguishing between mineral phases with different elemental composition when using a single X-ray energy. This happens because minerals with similar attenuation coefficients (a measure of how much X-rays are absorbed or scattered) produce nearly identical signals, making it hard to differentiate them in the scan. Although various methods exist to address this issue, they are primarily designed for geological samples, which often have highly complex mineral compositions. These methods focus on improving the contrast between different phases but may not be universally applicable. An alternative approach involves combining data from mineralogical and chemical analyses, such as elemental mapping (a technique that shows the distribution of elements in a sample), with geometrical descriptors of particles (quantitative measures of particle shape, size, and structure). Integrating these information types makes it easier to accurately identify and characterize different mineral phases, even when their attenuation coefficients are similar [21]. Another limitation is directly related to the size of the reconstructed voxel. Pottery is a complex material with particles of various sizes and shapes. When a particle's size is similar to the voxel size, the imaging system's resolution and artifacts make it difficult to determine the particle's dimensions accurately. To ensure accurate results, specific procedures must be applied to obtain the best results.
The aim of this paper is to demonstrate how advanced, non-destructive analytical techniques – XRF and XCT – can characterize historical pottery sources unearthed in a small microregion and similar in terms of chronology, and how the results obtained match those of the XRF analysis of source clay deposits in the same microregion. The territorial range of the paper is limited to Kraków Upland, a karstic region in southeastern Poland (Fig. 1). The chronological framework spans from the mid-13th to the 16th century. The study seeks to analyze the material composition, structural properties, and manufacturing techniques of these ceramics. By integrating chemical and structural data, the research provides insights into past technological practices, resource utilization, and pottery production methods while ensuring the preservation of cultural heritage materials.
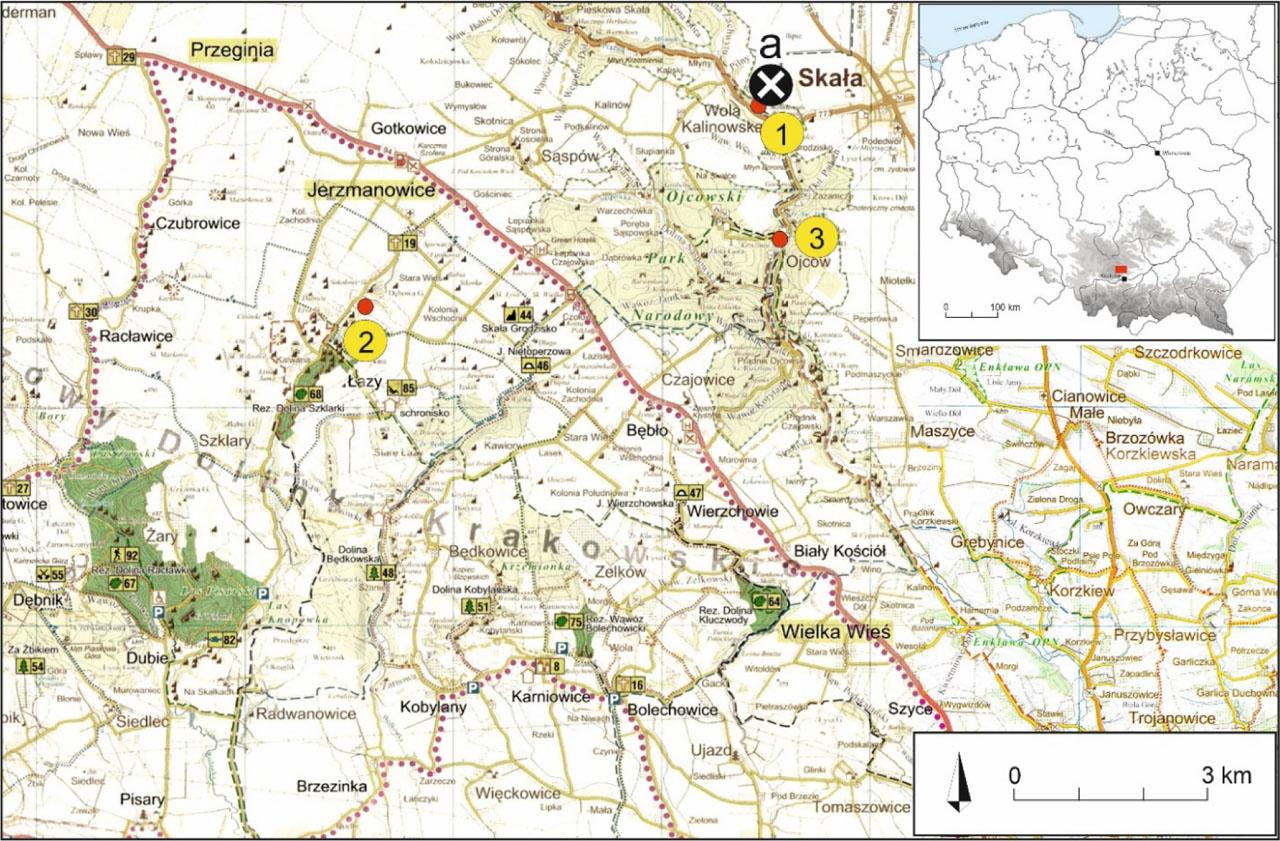
Location of sampling sites. 1 – Grodzisko near Skała, 2 – Jerzmanowice, 3 – Ojców, a – source clay deposits.
For the purposes of this study, five samples from three different archaeological sites from the area in question were selected (Fig. 1). The sampled material comes from fortified sites in Grodzisko near Skała (inv. no. GRO_275), Jerzmanowice (inv. no. JER_135), and Ojców (inv. nos. OJC_273, OJC_965, OJC_9668), all located in the Kraków Upland. Two samples – from the fortified Poor Clares monastery in Grodzisko near Skała and the stronghold in Jerzmanowice – share the same chronology, spanning from the mid-13th to the early 14th century [22, 23]. The remaining three samples, from the castle in Ojców, are dated to the 14th–15th century (2 pcs – OJC_965, OJC_9668) and to the 16th century (1 pc – OJC_273) [24]. The source clay deposits – a reference benchmark for this study – were sampled from below the cultural layers of the Poor Clares Monastery in Grodzisko near Skała, in archaeological trench VIIA, where they were deposited directly over the bedrock.
The sampled ceramic artefacts were subjected to a standard procedure of macroscopic analysis, using a questionnaire of technological and formal traits drawn up on the basis of observations formulated in the literature [25, 26]. The procedure included categorizing vessel fragments by form and size. Subsequently, clay body recipes (using a magnifying glass), manufacturing techniques, and firing regimes were determined. In the identification of clay body recipes, the primary guiding factor was the type and grain size of the temper. The firing regime was assessed based on the color of the vessel walls and breaks.
The ceramic samples from the study were investigated using the advanced XRF technique at the Faculty of Physics and Applied Computer Science of the AGH University of Krakow. The analysis was conducted using a BRUKER M4 Tornado Plus spectrometer, enabling non-invasive and non-destructive sample examinations. The X-ray fluorescence method does not require preliminary sample preparation, the amounts of energy deposited in the analyzed material are minor and do not cause any changes or damage, which is very important in the case of studies on historic samples. This method allows for qualitative analysis (identification of the elements in the sample) and quantitative analysis (determination of the content of elements). Knowledge of the elemental composition is helpful in determining the origin of raw materials, technological processes related to the place of production, or the chronology of the creation of the artifacts being studied. Due to the requirement to conduct measurements in a completely non-destructive manner and the highly varied and heterogeneous topology of the samples (absence of flat surface areas), the measurements were performed using the points on the surface of the samples, and the obtained results were averaged. The measurements were carried out in a vacuum chamber with air pressure reduced to 2 mbar. A X-ray tube with a rhodium anode operating at an accelerating voltage of 50 kV and a maximum current of 600 μA was used to excite the characteristic radiation of the elements. The samples were illuminated directly without preliminary filtration by the primary beam of X-ray radiation focused using a polycapillary lens to a diameter of about 20 μm. Point measurements were made by illuminating with a radiation beam. The characteristic radiation excited in the sample was registered by two silicon drift detectors (SDDs) with an energy resolution capability (full width at half maximum) FWHM = 150 eV for 5.9 keV, a thickness of 0.45 mm, equipped with ultrathin windows with an area of 60 mm2. Spectra of the characteristic radiation of five ceramic samples: GRO_275, JER_135, OJC_273, OJC_965, OJC_9668, clay deposits, along with four control samples, which were reference ceramics with a known chemical composition. The content of the elements (the mass ratio of a given element in the sample to the mass of the sample) was calculated using the fundamental parameter method [27], assuming that the elements in the analyzed samples are present in the form of stable oxides and that the total content of the oxides equals 100%.
In each ceramic sample, three different points on the surface were selected and measured in point-like mode, with each measurement lasting 15 minutes. Clay deposits pellets were measured in point-like mode (3 pellets measured on one side and the other side; total 6 measurements of clay deposits). Reference samples were measured at 2 points each, with each measurement lasting 15 minutes. This procedure was applied to assess the homogeneity and reproducibility of the elemental concentration.
Before the measurements of art ceramic samples, reference ceramic samples were measured. The determined concentrations of elements were compared to the reference ones. Table 1 analyses the elements and chemical compound concentrations in ceramic reference samples (ceramics for which we know elemental concentrations).
The comparison of determined and known (reference) concentrations of chemical compounds in reference samples
| Compound | Reference A | Reference C | ||
|---|---|---|---|---|
| Concentration (wt%) | Concentration (wt%) | |||
| Reference | Determined ± St.Dev. | Reference | Determined ± St.Dev. | |
| Na2O | 1.62 | 1.740 ± 0.013 | 1.88 | 2.440 ± 0.080 |
| MgO | 0.27 | 0.150 ± 0.040 | 0.3 | 0.337 ± 0.040 |
| Al2O3 | 34.16 | 35.43 ± 0.32 | 24.8 | 27.47 ± 0.27 |
| SiO2 | 59.97 | 55.20 ± 0.33 | 69.57 | 63.66 ± 0.38 |
| K2O | 3.33 | 4.41 ± 0.13 | 2.93 | 4.119 ± 0.055 |
| CaO | 0.53 | 0.52 ± 0.11 | 0.52 | 0.535 ± 0.012 |
| Fe2O3 | nd | 1.35 ± 0.41 | 0.3 | 0.3800 ± 0.0023 |
| BaO | 0.12 | 0.130 ± 0.021 | nd | 0.157 ± 0.012 |
| Compound | Reference D | Reference G | ||
|---|---|---|---|---|
| Concentration (wt%) | Concentration (wt%) | |||
| Reference | Determined ± St.Dev. | Reference | Determined ± St.Dev. | |
| Na2O | 1.9 | 1.77 ± 0.28 | 0.31 | 0.85 ± 0.43 |
| MgO | 0.15 | 0.013 ± 0.003 | 0.43 | 0.20 ± 0.14 |
| Al2O3 | 22.01 | 29 ± 3 | 40.93 | 51 ± 14 |
| SiO2 | 73.23 | 63 ± 3 | 53.33 | 44 ± 13 |
| K2O | nd | 3.23 ± 0.28 | 1.10 | 2.23 ± 0.43 |
| CaO | nd | 0.210 ± 0.062 | 0.73 | 0.268 ± 0.021 |
| TiO2 | 0.44 | 0.78 ± 0.52 | 1.09 | 0.55 ± 0.11 |
| Fe2O3 | 0.77 | 1.02 ± 0.16 | 2.08 | 0.931 ± 0.085 |
nd – no data; St.Dev. – standard deviation.
All XCT scans of pottery sherds were performed at the Faculty of Physics and Applied Computer Science of the AGH University of Krakow using a “nano tom 180N” device produced by GE Sensing & Inspection Technologies Phoenix X-ray Gmbh [28]. The device features a nanofocus X-ray tube with a maximum voltage of 180 kV. The tomograms were registered on the Hamamatsu C7942SK-25 detector (grey scale resolution: 12-bit, 2300 × 2300 pixels, pixel size: 50 μm). All examined samples were scanned at 60 kV of source voltage and 230 μA, with a rotation of the specimen of 360 degrees in 1400 steps. A 0.3 mm copper filter was placed between the source and the sample to reduce beam hardening artifacts. The exposure time was 500 ms, and four frames were used for averaging to minimize detector noise. The total measurement time for each sample was approximately 60 minutes. The reconstruction of measured objects was done using proprietary GE software datosX ver. 2.1.0 with the use of the Feldkamp algorithm for cone beam X-ray CT [29]. The post-reconstruction data treatment was performed using VGStudio Max 2.1 [30] d free Fiji software (Anon). Figure 2 presents images of the examined samples and visualizations of their internal structure through two perpendicular cross-sections. Bright areas represent elements with strong X-ray absorption.
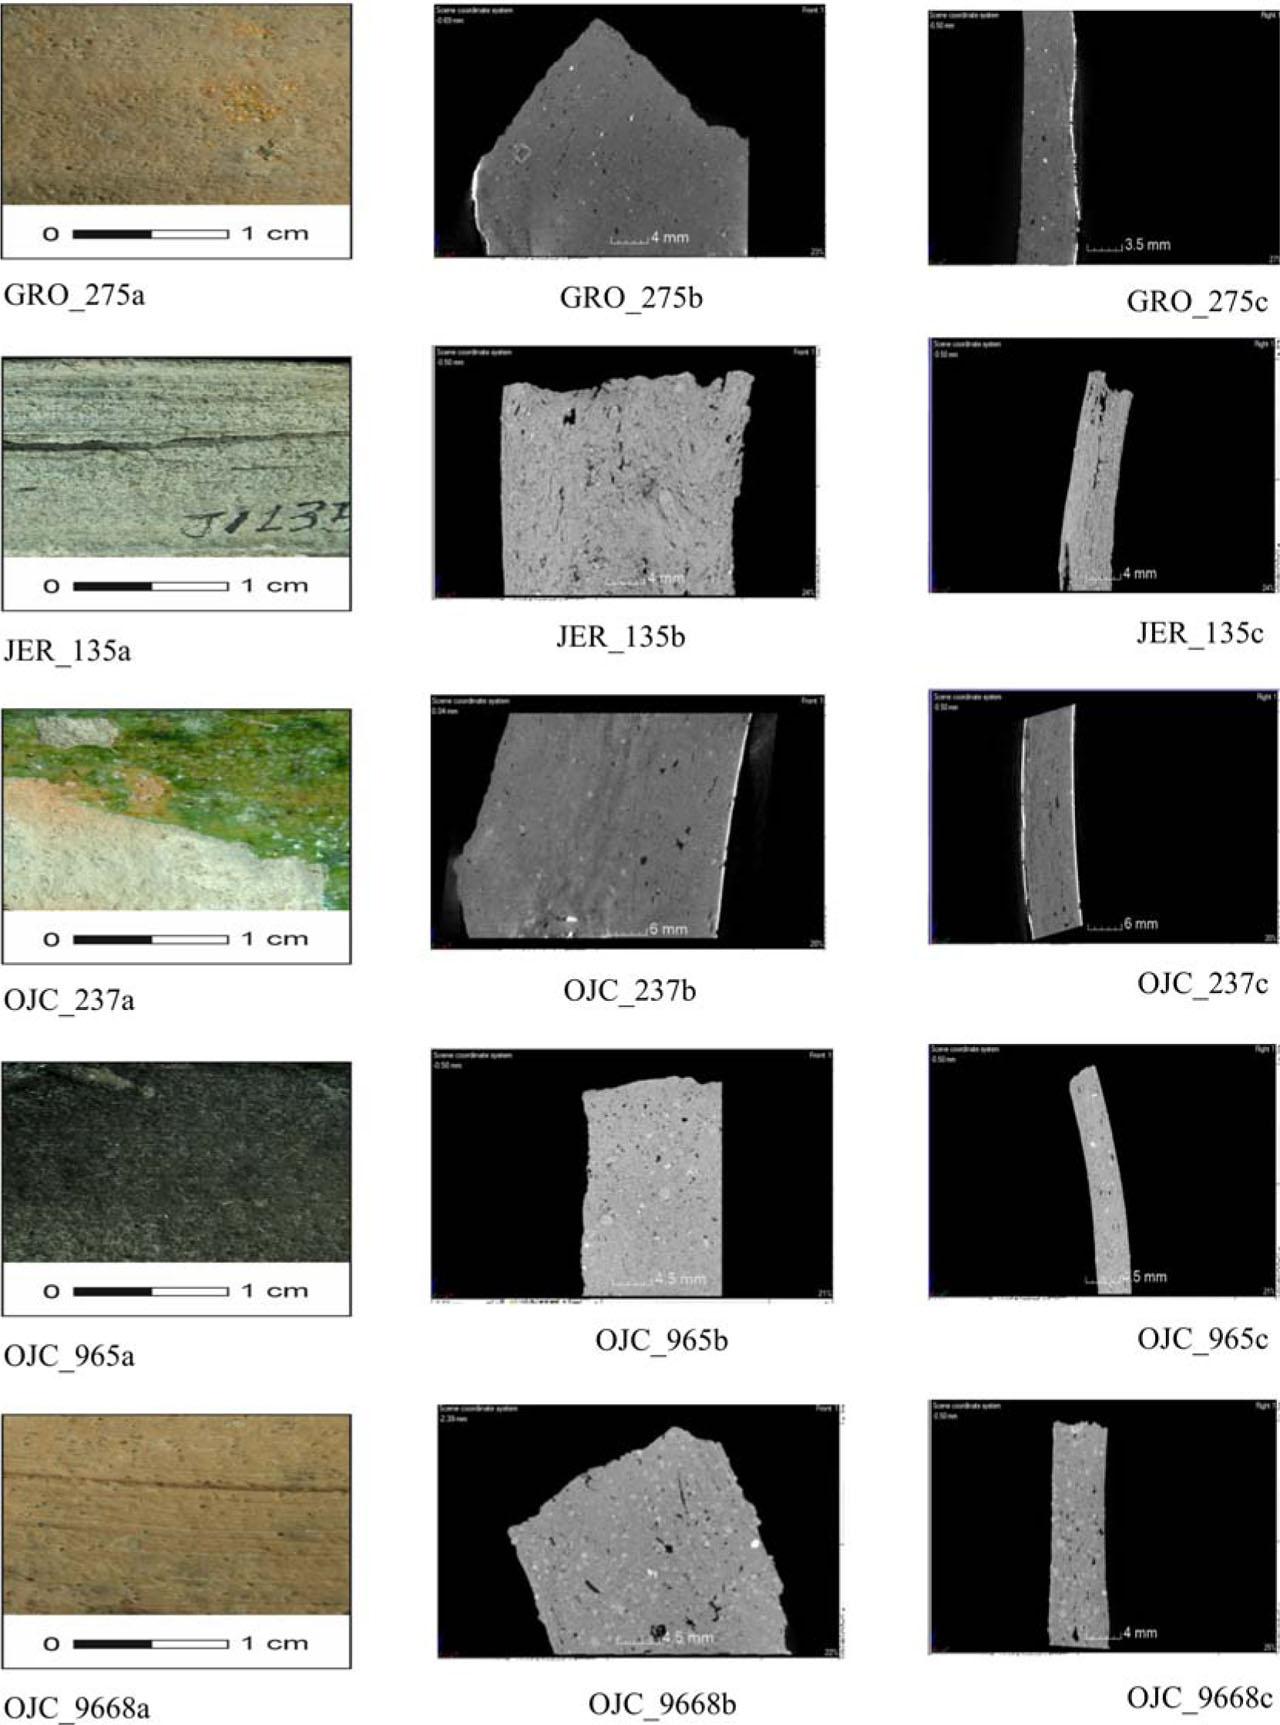
The analyzed pottery fragments. (a) Photographic image of the fragment; refer to GRO_275, refer to JER_135, refer to OJC_273, refer to OJC_965, refer to OJC_9668. (b) Frontal cross-section of the tomographic reconstruction of the sample. (c) Longitudinal cross-section of the tomographic reconstruction of the sample.
To create a 3D visualization of the pores and particles within the examined samples, tomographic data were binarized using a local thresholding method. The threshold value was determined based on the analysis of histograms from all samples. The binarization was performed using the Fiji software [31]. The binarized files were cleaned by removing objects with sizes equal to the measurement resolution. These objects generally originated from sample regions that exhibited significant noise due to the X-ray beam hardening effect. The cleaned data were utilized for morphological analyses of the pore and particle structure. The BoneJ plugin [32] was employed for further analysis. This plugin is specifically designed for the analysis of biological materials, such as bone. The plugin offers a set of tools specifically designed for the analysis of trabeculae, which form the structural foundation of trabecular bone. Additionally, it can be applied to other research subjects. The thickness function allows for calculating the diameter of the analyzed structure, including trabecular thickness (Tb.Th) and its surrounding environment, represented by trabecular spacing (Tb.Sp), along with the standard deviation. Its action involves drawing a point in a determined space and then matching circles of increasing diameter until they reach the edge of the tested area.
Based on macroscopic analysis, it can be stated that all pottery fragments sampled for this study share similar technological features – they were made from iron-rich clay tempered with finely levigated sand in moderate amounts (grain size approx. 0.1–0.5 mm). It is highly likely that all the sherds originated from the same type of vessel – a pot. In three cases (samples GRO_275, OJC_9668, and OJC_273), oxidizing firing was identified, while in the two remaining cases (OJC_965 and JER_135), reducing firing was observed.
The ceramic body of the samples and clay deposits were analyzed using the advanced XRF technique, which provided a detailed elemental composition, as shown in Table 2. The analysis was performed for the ceramic archaeological samples – GRO_275, JER_135, OJC_237, OJC_965, and OJC_9668. The silicon (Si) concentrations were the highest in sample GRO_275 (42 ± 7)%, and for the remaining samples, the concentrations were relatively consistent, ranging between 28% and 31%. The aluminum (Al) concentrations were the highest in sample JER_135 (11.6 ± 3.3)%, then sample OJC_9668 (8.5 ± 0.98)%, sample OJC_237 (6.1±2.6)%, sample OJC_965 (3.9±3.7)% and finally sample GRO_275 (3.0±2.2)%. Phosphorus (P) had the highest concentrations in sample OJC_965 and the lowest in sample JER_135. Sodium (Na) levels were highest in sample OJC_273 (1.19 ± 0.91)% and lowest in sample GRO_275 for other samples, they were as follows; sample JER_135 (0.15 ± 0.21)%, and sample OJC_965 (0.188 ± 0.073)%. Magnesium (Mg) concentrations were the highest in sample OJC_965, equal to (1.08 ± 0.38)% and the lowest in sample GRO_275 (0.17 ± 0.21)%. Potassium (K) was similar in all samples. Calcium (Ca) concentrations showed significant variation, peaking in sample OJC_965 (14 ± 19)% and being the lowest in sample GRO_275 (0.35 ± 0.31)%. Titanium (Ti) was the lowest in GRO_275 (0.087 ± 0.085)% and higher in the other samples. Iron (Fe) levels were the lowest in sample GRO_275 (0.94 ± 0.78)%, and higher in the other samples. For trace elements, manganese (Mn) was the lowest in samples GRO_275 and JER_135. Vanadium (V) concentrations were highest in sample JER_135 (236 ± 46) μg/g and the lowest in sample OJC_965 (36 ± 31) μg/g. Chromium (Cr) was most elevated in sample OJC_9668 (180 ± 94) μg/g and lowest in sample OJC_965 (63 ± 46) μg/g. Nickel (Ni) levels were the highest in sample GRO_275 (210 ± 280) μg/g and the lower in the other.
Elemental composition of the matrix of the ceramic body of the analyzed pottery samples and clay deposits in the Kraków Upland (in wt%, μg/g, and standard deviation) determined by XRF technique
| Elements | Clay deposits | GRO_275 | JER_135 | OJC_273 | OJC_965 | OJC_9668 |
|---|---|---|---|---|---|---|
| Determined concentration ± St.Dev. (%) | ||||||
| Na | 0.055 ± 0.0079 | <LOD | 0.15 ± 0.21 | 1.19 ± 0.91 | 0.198 ± 0.073 | 0.36 ± 0.13 |
| Mg | 0.320 ± 0.072 | 0.17 ± 0.21 | 0.76 ± 0.074 | 0.59 ± 0.25 | 1.08 ± 0.38 | 0.84 ± 0.19 |
| Al | 3.9 ± 2.0 | 3.0 ± 2.2 | 11.6 ± 3.3 | 6.1 ± 2.6 | 3.9 ± 3.7 | 8.50 ± 0.98 |
| Si | 11.8 ± 5.2 | 42.3 ± 3.2 | 31.2 ± 1.9 | 28.7 ± 2.9 | 28 ± 18 | 31.2 ± 2.2 |
| P | 0.039 ± 0.024 | 0.106 ± 0.012 | 0.091 ± 0.099 | 0.25 ± 0.19 | 2.8 ± 2.7 | 0.18 ± 0.035 |
| S | 0.016 ± 0.0079 | 0.030 ± 0.012 | 0.097 ± 0.034 | 0.56 ± 0.18 | 0.12 ± 0.072 | 0.063 ± 0.015 |
| K | 1.03 ± 0.25 | 0.88 ± 0.62 | 1.93 ± 0.48 | 3.2 ± 0.17 | 2.3 ± 2.2 | 3.3 ± 1.5 |
| Ca | 1.42 ± 0.32 | 0.35 ± 0.31 | 1.04 ± 0.35 | 8 ± 8 | 14 ± 6 | 1.78 ± 0.32 |
| Ti | 0.180 ± 0.087 | 0.087 ± 0.085 | 0.69 ± 0.32 | 0.57 ± 0.12 | 0.25 ± 0.23 | 0.78 ± 0.59 |
| Fe | 2.23 ± 0.39 | 0.94 ± 0.78 | 3.05 ± 0.91 | 4.6 ± 1.4 | 2.5 ± 2.1 | 4.64 ± 0.59 |
| Determined concentration ± St.Dev. (μg/g) | ||||||
| V | 39 ± 12 | 210 ± 150 | 236 ± 46 | 140 ± 130 | 35 ± 31 | 121 ± 67 |
| Cr | 48 ± 11 | 94 ± 110 | 148 ± 18 | 100 ± 26 | 62 ± 17 | 180 ± 94 |
| Mn | 180 ± 19 | 560 ± 150 | 360 ± 300 | 1600 ± 380 | 1610 ± 700 | 820 ± 150 |
| Ni | 23 ± 6 | 208 ± 54 | 33 ± 13 | 51 ± 35 | 65 ± 56 | 68 ± 5 |
| Cu | 15 ± 4 | 22 ± 9 | 55 ± 19 | 369 ± 18 | 58 ± 15 | 47 ± 34 |
| Zn | 82 ± 64 | <LOD | 318 ± 60 | 229 ± 34 | 330 ± 24 030 | 256 ± 22 |
| Ga | 12 ± 4 | <LOD | 33 ± 16 | 147 ± 67 | 39 ± 29 | 34 ± 8 |
| As | 17 ± 5 | 120 ± 110 | <LOD | <LOD | 115 ± 19 | 35 ± 13 |
| Rb | 64 ± 10 | 73 ± 32 | 126 ± 40 | 184 ± 58 | 143 ± 18 | 165 ± 15 |
| Sr | 42 ± 8 | 90 ± 20 | 87 ± 49 | 160 ± 21 | 390 ± 120 | 143 ± 15 |
| Y | 34 ± 7 | 34 ± 44 | 16 ± 7 | 167 ± 71 | 11 ± 6 | 34 ± 10 |
| Zr | 84 ± 45 | 270 ± 120 | 235 ± 79 | 269 ± 68 | 104 ± 12 | 411 ± 340 |
| Nb | 22 ± 5 | 39 ± 5 | 63 ± 7 | 45 ± 15 | 42 ± 16 | 94 ± 40 |
| Ba | 187 ± 32 | <LOD | 650 ± 480 | 840 ± 350 | 1580 ± 200 | 1130 ± 530 |
St.D. – standard deviation
The XRF analysis of the pottery samples (GRO_275, JER_135, OJC_273, OJC_965, and OJC_9668) and the clay deposits provide insights into their compositional similarities or differences. A comparison of major elements, particularly silicon (Si) content, shows that in ceramic bodies 3–4 times higher concentrations of Si than in clay deposits were observed. This difference in silicon content can be attributed to the effects of pottery production. Clay deposits consist of a heterogeneous mixture of minerals, including aluminosilicates (e.g., kaolinite, illite, and smectite), feldspars, iron oxides, and carbonates, which dilute the overall silica concentration [33]. In contrast, pottery production involves purification processes that remove organic matter and non-silicate materials, leading to an increased proportion of silicon (Si), particularly through the addition of quartz-rich temper and high-temperature firing (800–1200°C). These processes enhance vitrification, stabilizing a silica-dominated ceramic matrix [34]. Aluminum (Al) concentrations in the analyzed potteries are similar to clay deposits (3.9 ± 2.0)%. Only in JER_135 sample the aluminum concentration is higher and equal to (11.6 ± 3.3)%.
Iron (Fe) concentrations in the potteries are similar as in clay deposits (2.23 ± 0.39)%. The distribution of trace elements in archaeological ceramics provides critical insights into raw material selection and high-temperature transformations during pottery production. There are comparable and higher concentrations of vanadium (V) and chromium (Cr) in the pottery than in clay deposits (210 ± 150 μg/g vs. 39 ± 12 μg/g for V, and 180 ± 94 μg/g vs. 48 ± 11 μg/g for Cr). However, strontium (Sr) exhibits an increase in the pottery (400 ± 360 μg/g) compared to the clay deposits (42 ± 8 μg/g). This may be due to its incorporation into feldspar-like structures or vitrified clay matrices during firing. In contrast, barium (Ba), which is abundant in clay deposits (187 ± 32 μg/g), falls below the detection limit in the pottery GRO_275. But in other potteries the higher concentrations of Ba than in clay deposits are observed. These elemental concentrations variations highlight the dual influence of natural geochemical composition and thermal alteration in shaping the final chemical profile of archaeological ceramics, reinforcing the importance of firing conditions in the preservation or depletion of specific trace elements.
Also, given the overall similarity in elemental composition in Table 2 and the geochemical characteristics of the clay deposit and ceramic samples, we predict that the pottery was likely produced using local raw materials sourced from the same geological environment as the analyzed clay deposits.
The correlation analysis reveals distinct relationships among various elements and compounds, as shown in Table 3. For instance, a robust positive correlation is observed between Na2O vs. SO3, Cu, Ga, and Y2O3, suggesting that as the concentration of one element increases, there is a corresponding increase in the others. This could indicate a shared source or similar geochemical behavior in the pottery samples. In contrast, a robust negative correlation exists between SiO2 and ZnO, Rb, and BaO, where an increase in SiO2 concentration is associated with a significant decrease in the concentrations of these elements. This negative correlation suggests that SiO2 behaves inversely to these oxides, potentially due to their differing retention or transformation during the pottery's firing process. Positive correlations were also observed among MgO, CaO, and Nb, indicating that these elements may co-occur in tempering materials or follow similar geochemical patterns during pottery production and firing. Moreover, a strong negative correlation between SiO2 and K2O, MnO, and CaO indicates that as the concentration of SiO2 increases, the concentrations of these elements decrease, potentially reflecting inverse processes during pottery production and post-firing transformations. These correlations provide valuable insights into the relationship between the elements present in the pottery samples. They highlight potential shared geochemical characteristics of the raw materials used, as well as the effects of firing conditions on the final composition of the ceramics. Figure 3a (SiO2, Al2O3, CaO) ternary plot indicates that sample GRO_275 is more silica-rich, while CaO concentrations are higher in samples OJC_965 and OJC_273. Al2O3 content is the highest in sample JER_135, followed by sample OJC_9668.
Figure 3b (SiO2, Al2O3, Na2O + K2O) presents a ternary plot illustrating the elemental composition of the samples. Sample GRO_275 has the highest SiO2 concentration among all samples, with lower Na2O + K2O than sample OJC_273 and sample OJC_9668 but higher than sample JER_135 and sample OJC_965, while its Al2O3 content is the lowest. Sample JER_135 contains the highest Al2O3 concentration, the lowest SiO2, and Na2O + K2O levels.
The correlation data of the ceramic sample according to the data from XRF analysis
| Na2O | MgO | Al2O3 | SiO2 | P2O5 | SO3 | K2O | CaO | TiO2 | Fe2O3 | V | Cr2O3 | MnO | NiO | Cu | ZnO | Ga | As | Rb | SrO | Y2O3 | Zr | Nb | BaO | Pb | |
|---|---|---|---|---|---|---|---|---|---|---|---|---|---|---|---|---|---|---|---|---|---|---|---|---|---|
| Na2O | 1 | ||||||||||||||||||||||||
| MgO | −0.03 | 1 | |||||||||||||||||||||||
| Al2O3 | 0 | 0.32 | 1 | ||||||||||||||||||||||
| SiO2 | −0.45 | −0.87 | −0.38 | 1 | |||||||||||||||||||||
| P2O5 | −0.2 | 0.67 | −0.45 | −0.45 | 1 | ||||||||||||||||||||
| SO3 | 0.97 | −0.04 | −0.04 | −0.46 | −0.12 | 1 | |||||||||||||||||||
| K2O | 0.67 | 0.56 | 0.36 | −0.77 | 0.01 | 0.54 | 1 | ||||||||||||||||||
| CaO | 0.26 | 0.63 | −0.43 | −0.65 | 0.9 | 0.35 | 0.28 | 1 | |||||||||||||||||
| TiO2 | 0.33 | 0.41 | 0.88 | −0.56 | −0.42 | 0.22 | 0.75 | −0.28 | 1 | ||||||||||||||||
| Fe2O3 | 0.69 | 0.44 | 0.53 | −0.71 | −0.22 | 0.56 | 0.97 | 0.08 | 0.87 | 1 | |||||||||||||||
| V | 0.18 | −0.72 | 0.36 | 0.44 | −0.84 | 0.24 | −0.31 | −0.71 | 0.15 | −0.08 | 1 | ||||||||||||||
| Cr2O3 | −0.06 | 0.06 | 0.79 | −0.03 | −0.66 | −0.23 | 0.4 | −0.7 | 0.83 | 0.55 | 0.27 | 1 | |||||||||||||
| MnO | 0.62 | 0.43 | −0.48 | −0.62 | 0.63 | 0.65 | 0.51 | 0.9 | −0.16 | 0.33 | −0.57 | −0.59 | 1 | ||||||||||||
| NiO | −0.39 | −0.78 | −0.68 | 0.94 | −0.18 | −0.39 | −0.73 | −0.35 | −0.76 | −0.75 | 0.17 | −0.3 | −0.31 | 1 | |||||||||||
| Cu | 0.98 | −0.08 | −0.04 | −0.43 | −0.16 | 1 | 0.55 | 0.31 | 0.23 | 0.57 | 0.26 | −0.2 | 0.63 | −0.37 | 1 | ||||||||||
| ZnO | 0.12 | 0.94 | 0.57 | −0.93 | 0.45 | 0.15 | 0.6 | 0.5 | 0.6 | 0.56 | −0.42 | 0.17 | 0.33 | −0.95 | 0.11 | 1 | |||||||||
| Ga | 0.98 | 0.11 | 0.06 | −0.59 | −0.07 | 0.99 | 0.66 | 0.39 | 0.34 | 0.68 | 0.14 | −0.15 | 0.68 | −0.52 | 0.99 | 0.29 | 1 | ||||||||
| As | −0.58 | −0.15 | −0.82 | 0.49 | 0.56 | −0.54 | −0.61 | 0.28 | −0.88 | −0.79 | −0.49 | −0.61 | 0.1 | 0.72 | −0.55 | −0.45 | −0.6 | 1 | |||||||
| Rb | 0.75 | 0.59 | 0.32 | −0.87 | 0.11 | 0.67 | 0.98 | 0.43 | 0.68 | 0.94 | −0.29 | 0.23 | 0.63 | −0.8 | 0.67 | 0.67 | 0.79 | −0.63 | 1 | ||||||
| SrO | −0.03 | 0.71 | −0.44 | −0.56 | 0.98 | 0.04 | 0.2 | 0.95 | −0.32 | −0.04 | −0.88 | −0.62 | 0.76 | −0.26 | −0.01 | 0.49 | 0.1 | 0.46 | 0.29 | 1 | |||||
| Y2O3 | 0.98 | −0.21 | −0.07 | −0.3 | −0.29 | 0.97 | 0.54 | 0.17 | 0.23 | 0.58 | 0.31 | −0.11 | 0.55 | −0.25 | 0.99 | −0.04 | 0.95 | −0.53 | 0.62 | −0.13 | 1 | ||||
| Zr | 0.18 | −0.32 | 0.36 | 0.25 | −0.78 | −0.04 | 0.38 | −0.72 | 0.56 | 0.49 | 0.3 | 0.83 | −0.42 | 0.09 | 0.03 | −0.28 | 0.01 | −0.42 | 0.19 | −0.68 | 0.19 | 1 | |||
| Nb | −0.21 | 0.66 | 0.52 | −0.44 | 0.08 | −0.38 | 0.59 | −0.06 | 0.67 | 0.55 | −0.51 | 0.69 | −0.12 | −0.48 | −0.37 | 0.57 | −0.22 | −0.23 | 0.43 | 0.14 | −0.36 | 0.44 | 1 | ||
| BaO | 0.14 | 0.96 | 0.09 | −0.87 | 0.73 | 0.11 | 0.65 | 0.76 | 0.3 | 0.49 | −0.83 | −0.08 | 0.65 | −0.69 | 0.09 | 0.83 | 0.25 | −0.05 | 0.69 | 0.82 | −0.03 | −0.3 | 0.6 | 1 | |
| Pb | −0.29 | 0.12 | 0.8 | −0.11 | −0.28 | −0.2 | −0.22 | −0.38 | 0.42 | −0.03 | 0.52 | 0.37 | −0.6 | −0.42 | −0.22 | 0.39 | −0.18 | −0.51 | −0.17 | −0.4 | −0.3 | −0.12 | 0.06 | −0.18 | 1 |
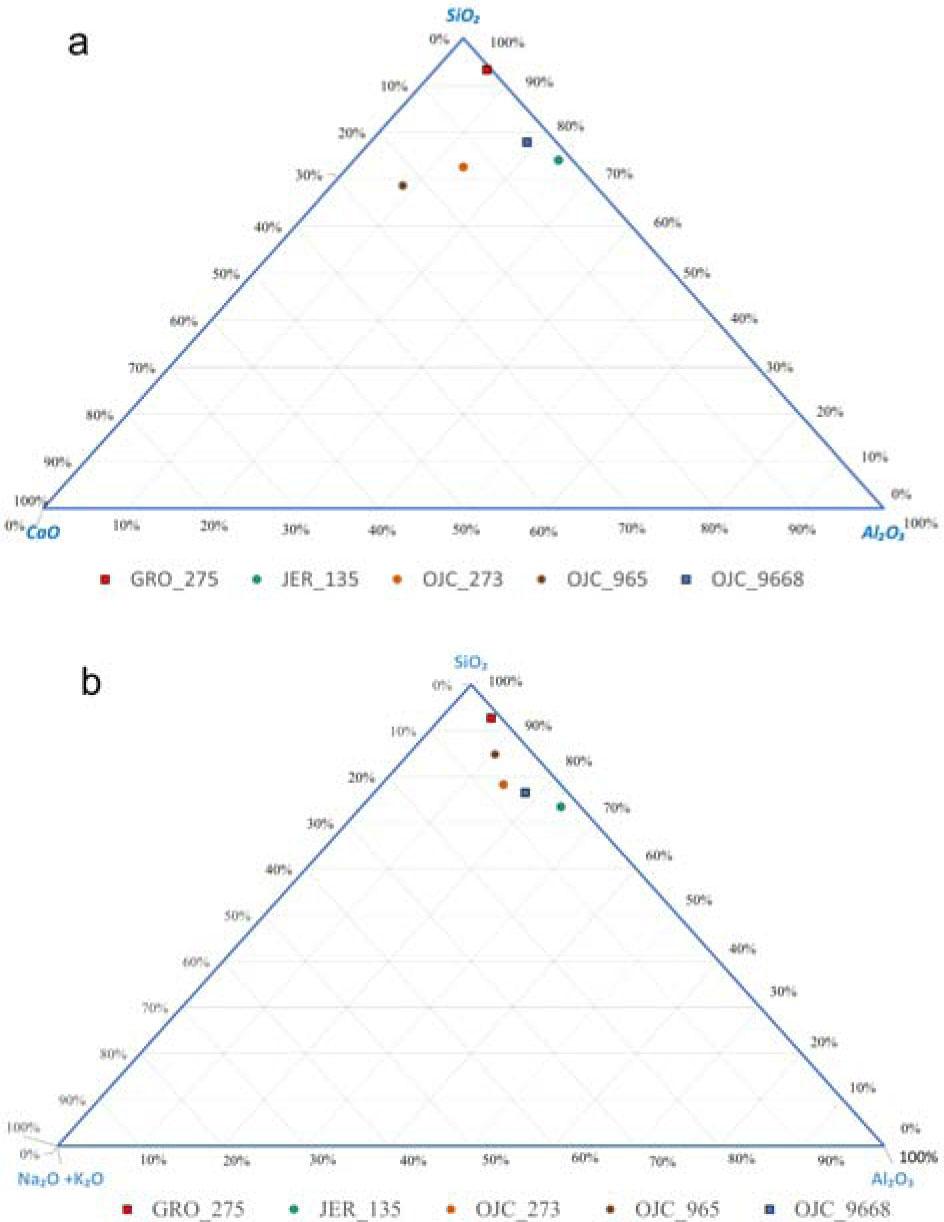
(a) SiO2-Al2O3-CaO and (b) SiO2-Al2O3-Na2O+K2O ternary plots showing the matrix composition of the ceramic body of the analyzed sample measured by XRF technique.
The XCT analysis of the ceramic samples reveals significant variability in the characteristics of inclusions, reflecting differences in tempering and preparation techniques. The GRO_275 sample (Fig. 4) reveals particles of varying sizes and densities embedded within the ceramic matrix. According to the grayscale of the image, the bright regions in the image correspond to high-density inclusions (e.g., mineral particles or grog temper), while darker areas indicate voids or – eventually – accidental, low-density organic remnants. The dispersion of particles in the fabric can indicate the type of clay used and the tempering materials. This pattern suggests moderately sorted clay with mixed particle types, consistent with handcrafted pottery techniques and consistent with tempering materials identified by Quinn [35] and Maniatis & Tite [36]. The variability in inclusion size suggests manual preparation with mixed material origins.
Segmented image emphasizing the inclusions of sample GRO_275 (in mm).
In the JER_135 sample (Fig. 5) particles appear smaller and more evenly distributed compared to the GRO_275 sample, suggesting a finer clay matrix. Bright spots represent denser inclusions such as quartz, commonly added to enhance thermal resistance, or feldspar, which influences firing properties. Darker regions indicate voids or less dense material, are more accurately attributed to inorganic tempers (such as quartz or iron-rich minerals) or firing-induced carbon retention rather than deliberate organic additives. This interpretation aligns with medieval ceramic technological priorities, which favored the use of mineral tempers and controlled firing conditions over organic tempering [37, 38]. The uniform distribution might reflect a well-refined clay source with minimal tempering materials, possibly sand to prevent cracking during drying and firing or carbonates to improve plasticity. Medium-sized particles (~0.15 mm) are predominant, aligning with materials such as mica, valued for its structural and reflective properties.
Segmented image emphasizing the inclusions of sample JER_135 (in mm).
In contrast, the OJC_965 (Fig. 6) sample exhibits slightly elongated or angular particles in this image, indicating the possible use of grog temper. The consistent mid-tone density could result from a combination of natural mineral inclusions and grog temper, aligning with characteristics of coarse-ware ceramics. These ceramics are often low-fired, durable, and made with large inclusions like sand, mica suitable for cooking, storage, or construction. The identification of minerals such as feldspar and quartz are based on their high-density particles, which match mineral inclusions observed in other studies given by Quinn [35] and Velde and Druc [39]. This wide size range refers to the variation in particle sizes within the ceramic material. Larger particles contribute to structural durability, while smaller particles optimize packing density, making the ceramic stronger and more resilient. This size variation reflects traditional pottery techniques, where different grain sizes were purposefully mixed to enhance the final product's performance.
Segmented image emphasizing the inclusions of sample OJC_965 (in mm).
The OJC_9668 (Fig. 7) image shows larger and denser particle clusters than the others, suggesting a poorly sorted clay source with larger and denser particle clusters indicating a poorly sorted clay source with significant tempering material. The prominent bright clusters represent high-density inclusions like quartz or feldspar, while the darker regions are voids left by inorganic tempering (such as quartz or iron-rich minerals). This pattern could reflect minimal processing of the raw clay, with natural inclusions and less homogenization during the preparation stage. These inclusions, as previously observed in ceramic analyses [40, 41], provide structural reinforcement, while the size variability suggests deliberate tempering to balance mechanical stability and clay workability. The OJC_237 sample exhibited a slightly different internal structure compared to the other materials analyzed. In some cross-sections, regions with a higher grayscale value than the surrounding clay were visible. However, the contrast between these two materials was insufficient for effective particle segmentation. Additionally, the sample featured a thick glaze layer on its surface, which introduced strong beam-hardening artifacts that further complicated the segmentation process. Due to these limitations, particle analysis for this sample could not be presented in the study [42, 43].
Segmented image emphasizing the inclusions of sample OJC_9668 (in mm).
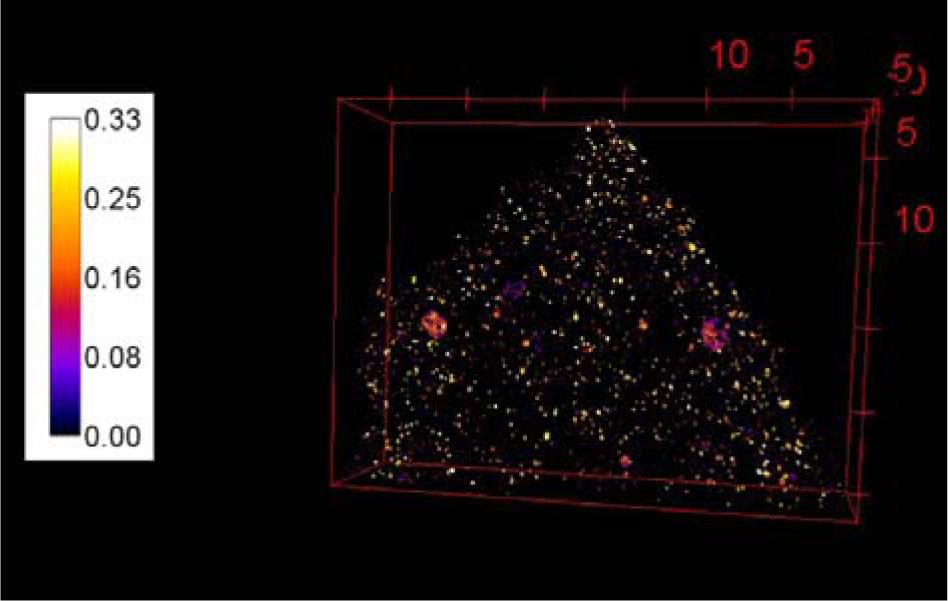
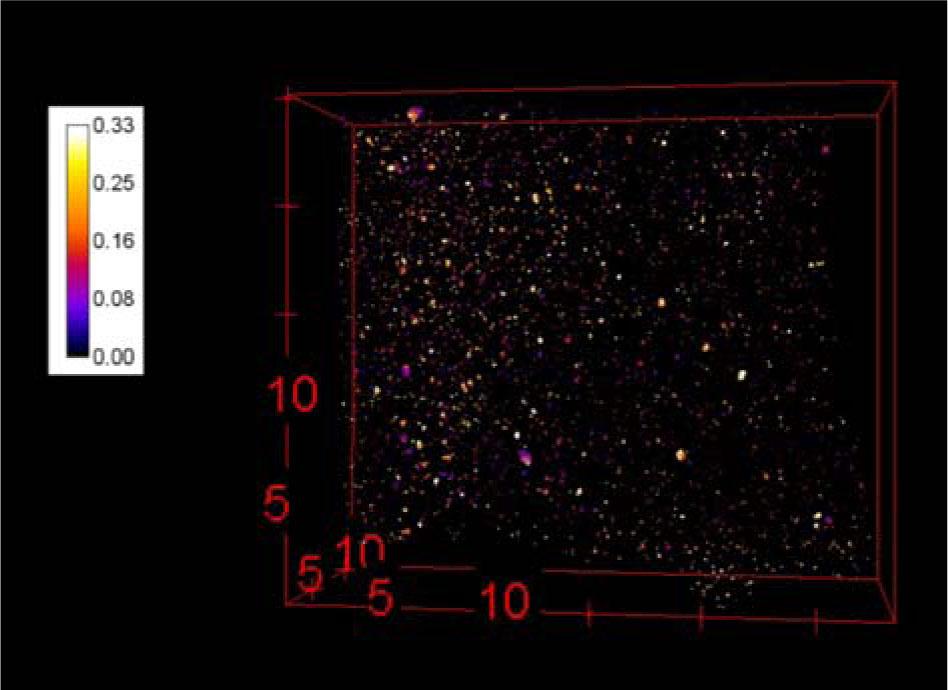
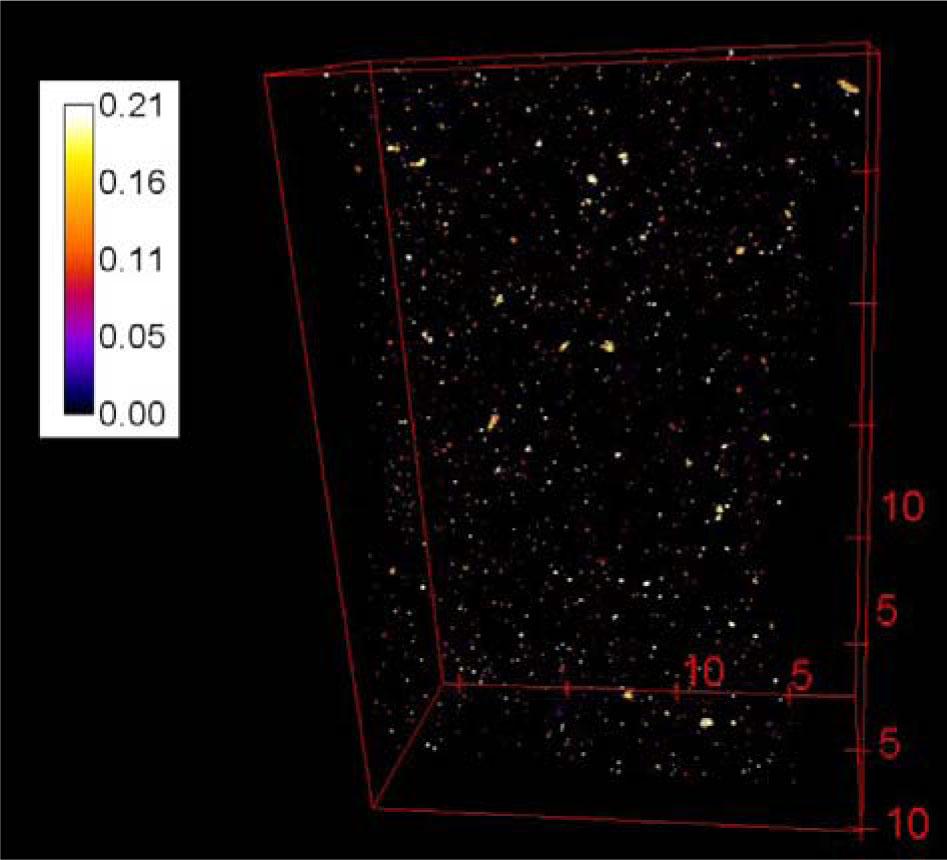
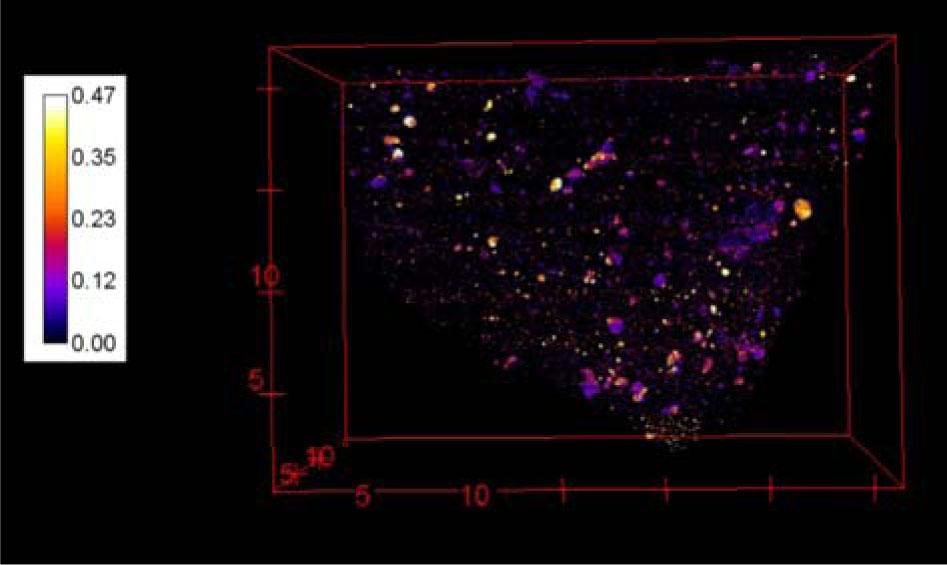
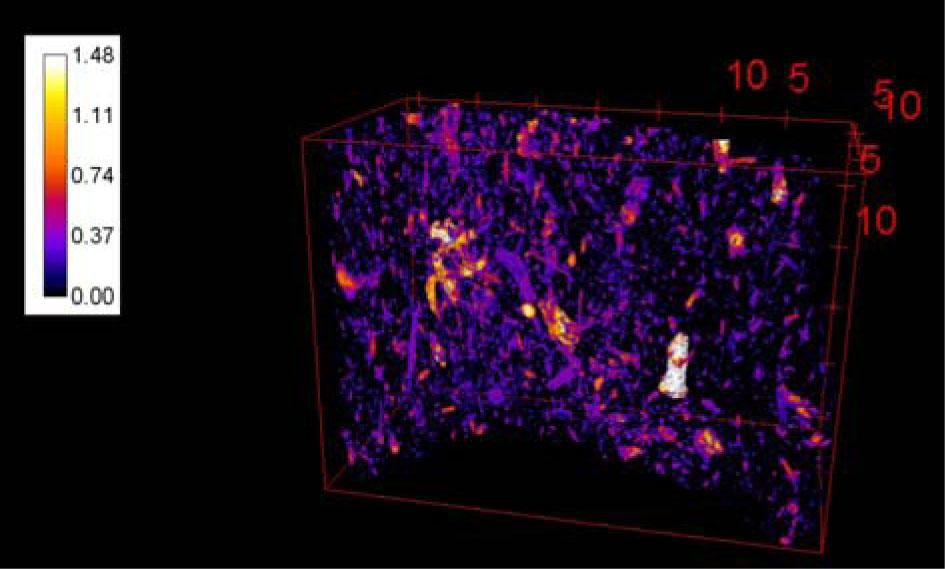
The XCT scan of the GRO_275 sample is presented in Fig. 8. The image reveals a high density of interconnected pores with varying sizes. The purple-to-bright yellow gradients indicate density variations, with darker purple areas representing voids and brighter regions indicating surrounding material. The porous distribution is irregular, suggesting poorly mixed clay or inorganic tempering remnants (such as quartz or iron-rich minerals). Larger voids are indicative of air entrapment, while smaller ones are likely due to material shrinkage, consistent with interpretations of porosity in functional ceramics [41]. It likely results from inorganic inclusions (e.g., chaff or plant fibers) that burned out during firing, leaving behind the observed void network. This indicates traditional tempering techniques were used. The JER_135 sample is presented in Fig. 9. The XCT scan shows that the pores in this sample appear smaller, more evenly distributed, and less interconnected than the GRO_275 sample. Bright yellow highlights around the pores suggest finer inclusions, indicating well-refined clay and minimal temper. A compact structure with fewer voids suggests meticulous manual clay processing, potentially leading to stronger ceramic materials, with smaller voids dominating the distribution. This pattern suggests manual shaping and moderate firing temperatures, aligning with the analyses of pore networks noted elsewhere [40, 44]. The porosity impacts liquid retention and breathability, which are consistent with functional considerations for pottery vessels [45]. The XCT scan of OJC_965 sample shows Fig. 10. Pores reveal larger and irregularly shaped pores dominate the structure. The uneven distribution of voids indicates minimal homogenization of the clay during preparation. The presence of bright particles near the pores suggests mineral temper was used to strengthen the matrix. A lower refinement level of clay is observed, consistent with early pottery practices where grog or coarse sand was used as a temper. These interpretations are supported by studies emphasizing the role of pore size in influencing permeability and thermal properties [46]. The variability in pore sizes reflects differences in material preparation and firing conditions, consistent with findings on ancient ceramic production techniques [45]. The OJC_9668 sample XCT scan shows Fig. 11. Pores XCT scan shows the most irregular voids and the highest concentration of large, interconnected pores. Bright regions near the voids suggest a mix of natural inclusions and temper, with less emphasis on refining the clay. The irregular pore structure may result from organic tempering or – more likely – from firing inconsistencies, indicative of medieval manufacturing techniques. The interconnected nature of some pores suggests moderate permeability, which aligns with the functional implications of porosity in ceramics [47]. This size distribution offers insights into manufacturing and firing processes, consistent with interpretations of ancient ceramic production techniques [48]. Finally, the OJC_237 (Fig. 12) pores XCT scan demonstrates that the voids appear elongated and aligned, suggesting specific manufacturing techniques such as coiling or slab construction. Bright inclusions interspersed with the voids indicate grog temper or high-density mineral inclusions in the clay matrix. The alignment of pores indicates a deliberate technique to shape the vessel walls, with firing conditions influencing the retention of void structures. Indicating a controlled manufacturing process. The dominance of smaller pores suggests minimal air entrapment and optimized compaction, as described in studies of sintering and compaction effects in pottery [45, 49]. The narrow size range is indicative of high-temperature firing, leading to partial sintering of the ceramic material.
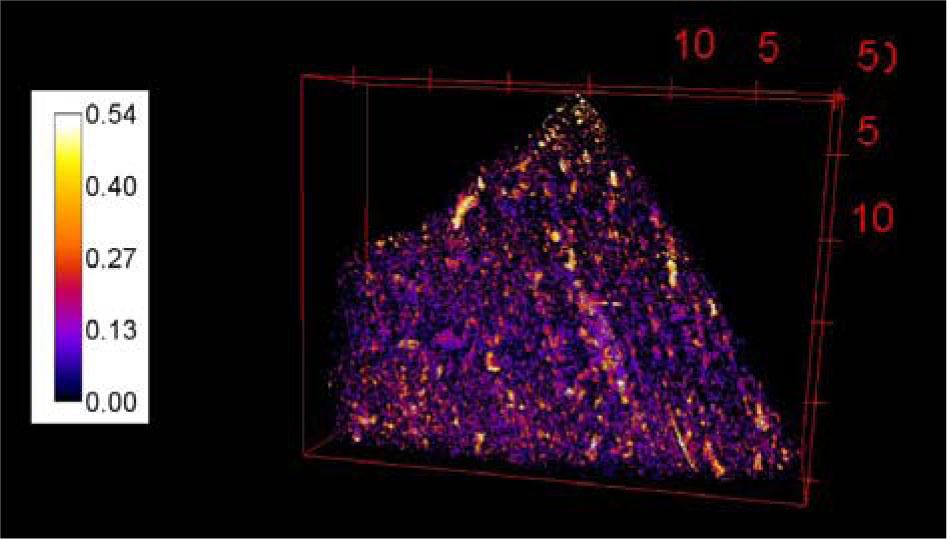
Segmented image emphasizing the voids of sample GRO_275 (in mm).
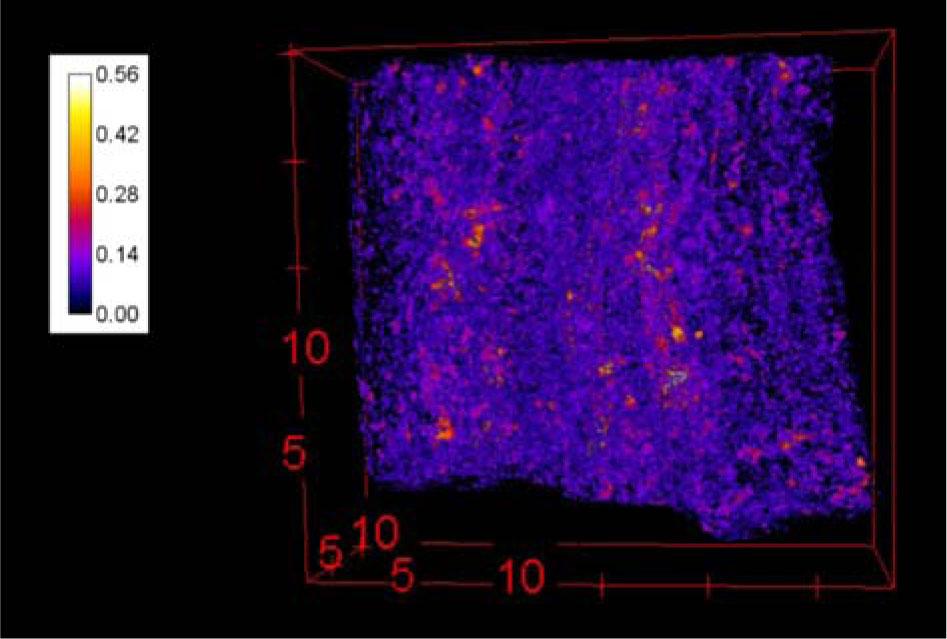
Segmented image emphasizing the voids of sample JER_135 (in mm).
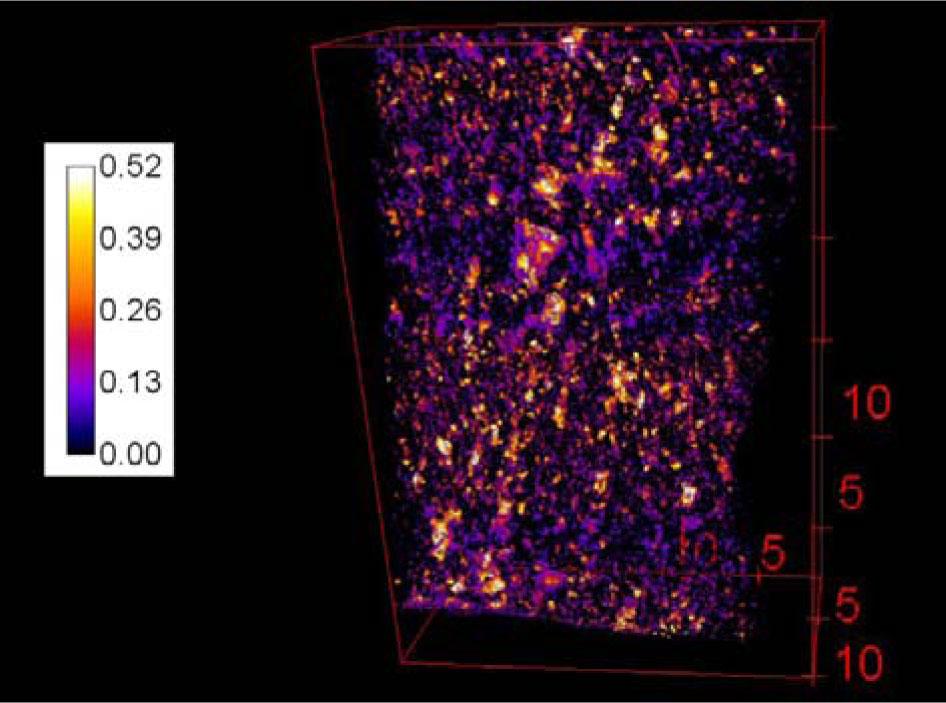
Segmented image emphasizing the voids of sample OJC_965 (in mm).
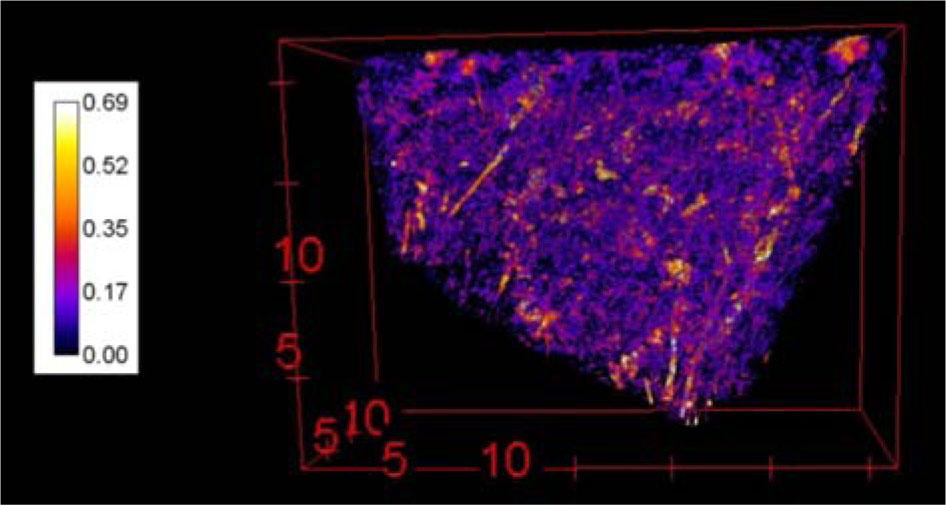
Segmented image emphasizing the voids of sample OJC_9668 (in mm).
Segmented image emphasizing the voids of sample OJC_273 (in mm).
The presented research provides a comprehensive investigation into the application of advanced non-destructive techniques, particularly XRF and XCT, for the characterization of archaeological pottery. By analyzing five pottery samples from medieval and early post-medieval periods, the study effectively demonstrates the potential of these techniques to uncover significant insights into the material composition, structural integrity, and manufacturing methods of historical ceramics. The results from the XRF analysis revealed the detailed elemental composition of the ceramic samples as well as clay deposits. This data underscores the importance of precise chemical characterization in understanding the technological choices and resource availability of past societies. XCT imaging further contributed by providing 3-D insights into the internal structures of the pottery samples, such as inclusions, voids, and particle distribution. The segmentation and void analysis confirmed that the manufacturing processes varied significantly among the samples, reflecting diverse techniques tailored to specific functional or cultural requirements. For instance, the presence of well-sorted clay in some samples indicates advanced preparation methods, while irregular inclusions and voids in others suggest rudimentary techniques. These observations align with historical accounts of pottery production practices during the studied periods [50]. The study highlights the limitations of each technique, such as the difficulty in distinguishing between minerals with similar attenuation coefficients in XCT scans and the size-related resolution constraints of reconstructed voxels. However, the integration of XRF and XCT data mitigates these challenges by providing complementary information, leading to a more holistic understanding of ceramic materials. The research underscores the critical role of non-destructive analytical methods in archaeological studies, offering valuable insights into the technological, cultural, and economic contexts of historical societies. The findings pave the way for future studies to refine these techniques further and expand their applications to broader archaeological and heritage conservation challenges.