
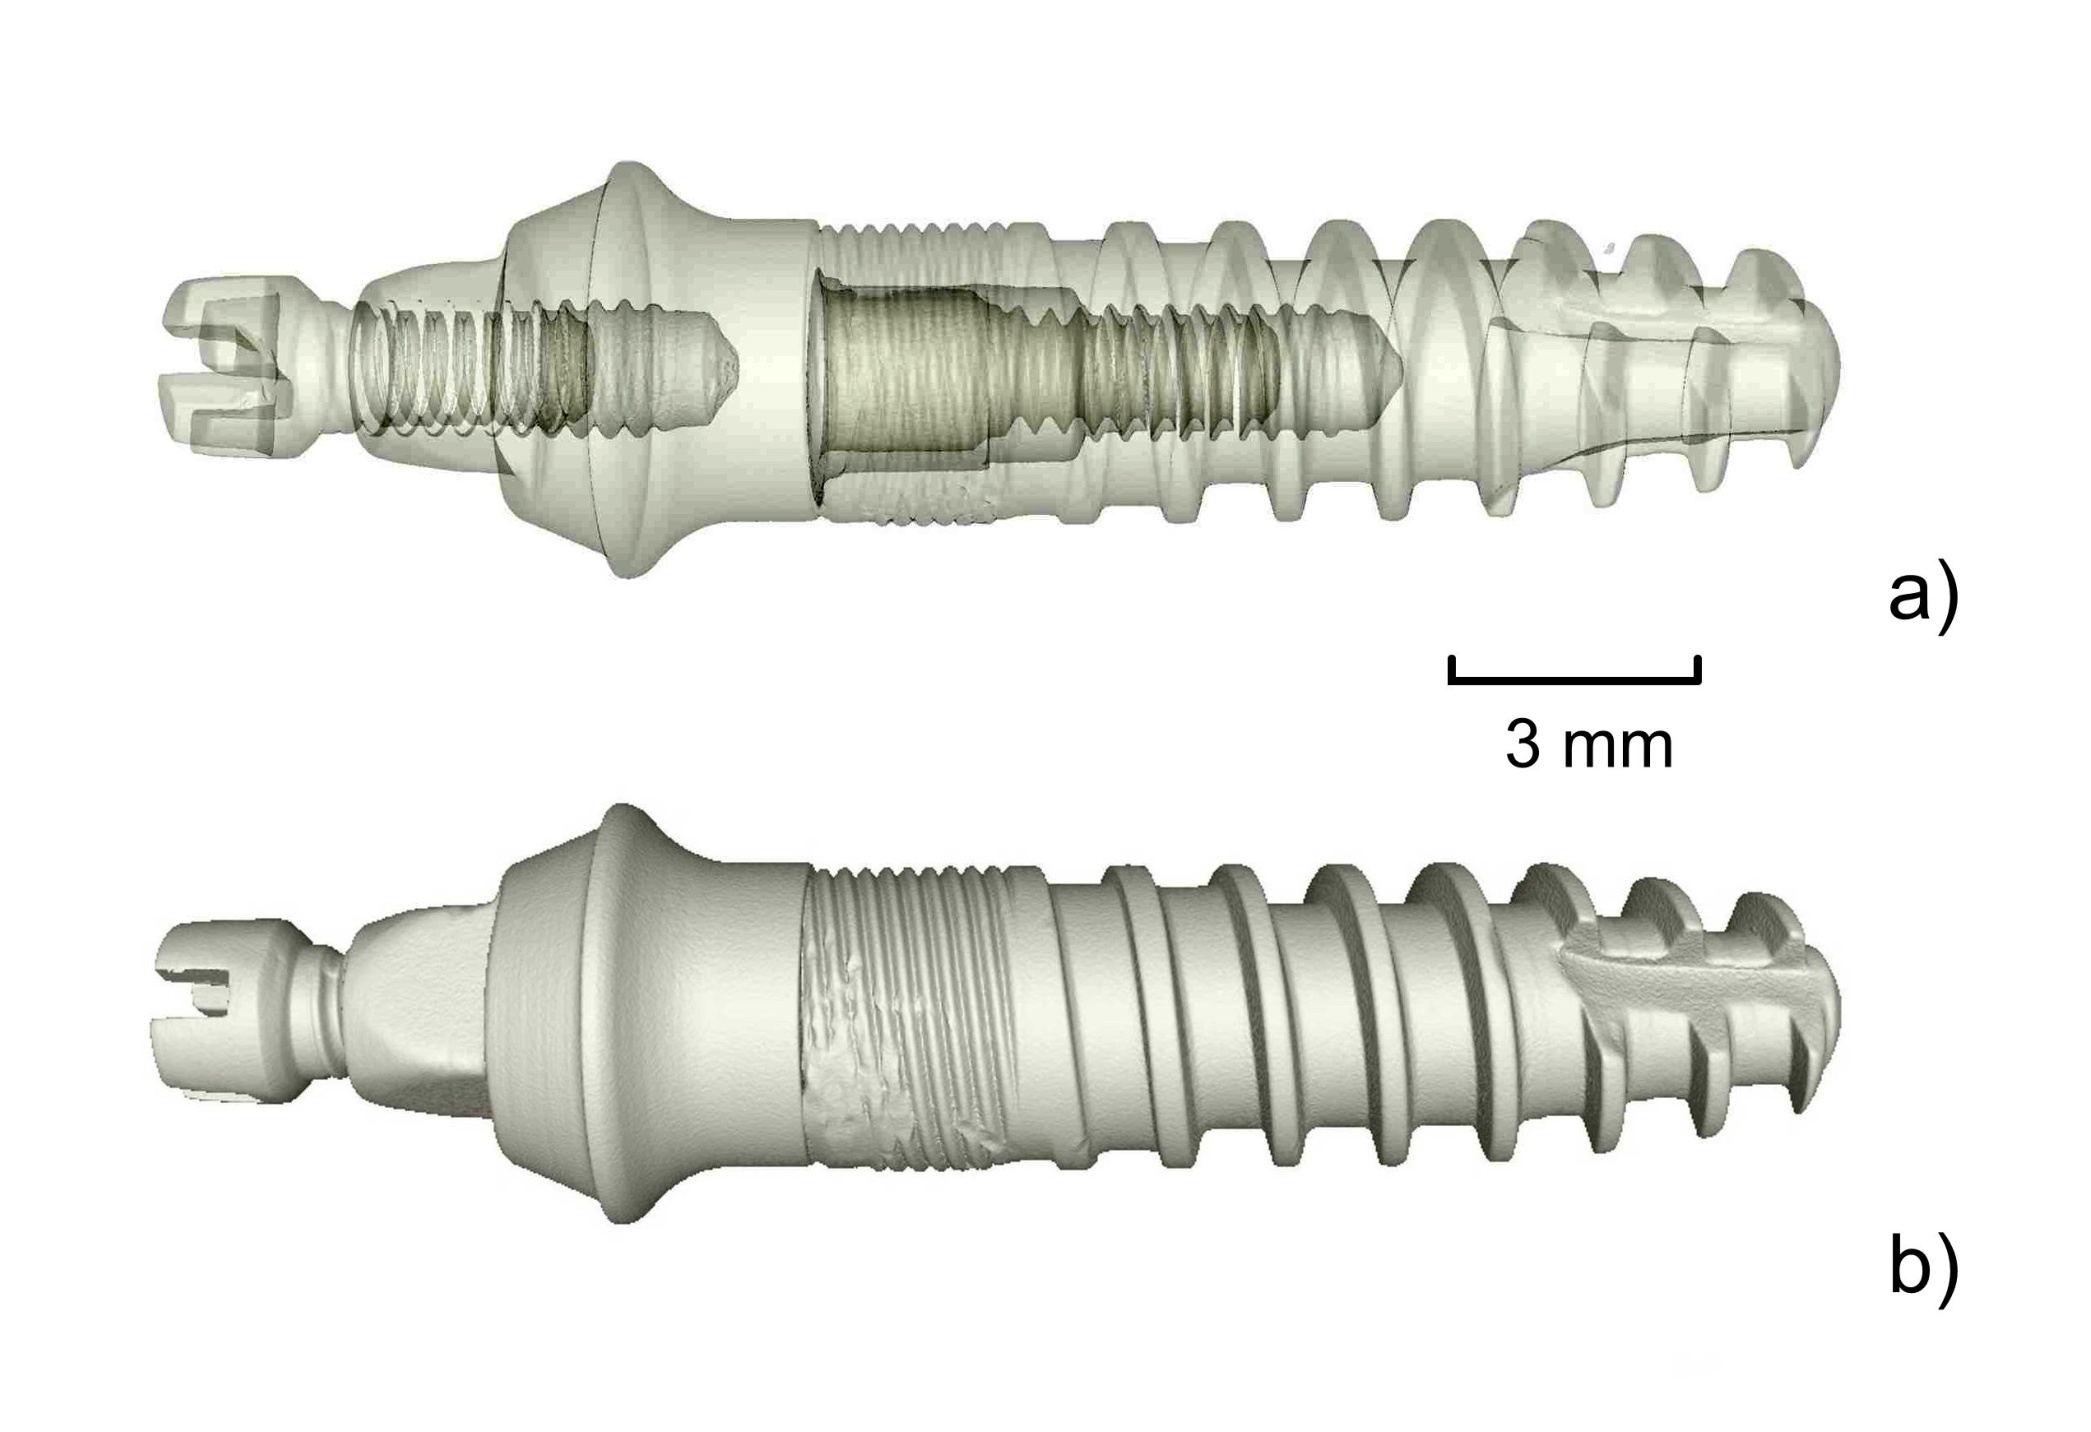
Fig. 1.
μCT-derived 3D model of the three-component titanium implant assembly: (a) semi-transparent rendering revealing the individual components; (b) opaque rendering. The scale bar indicates 3 mm.
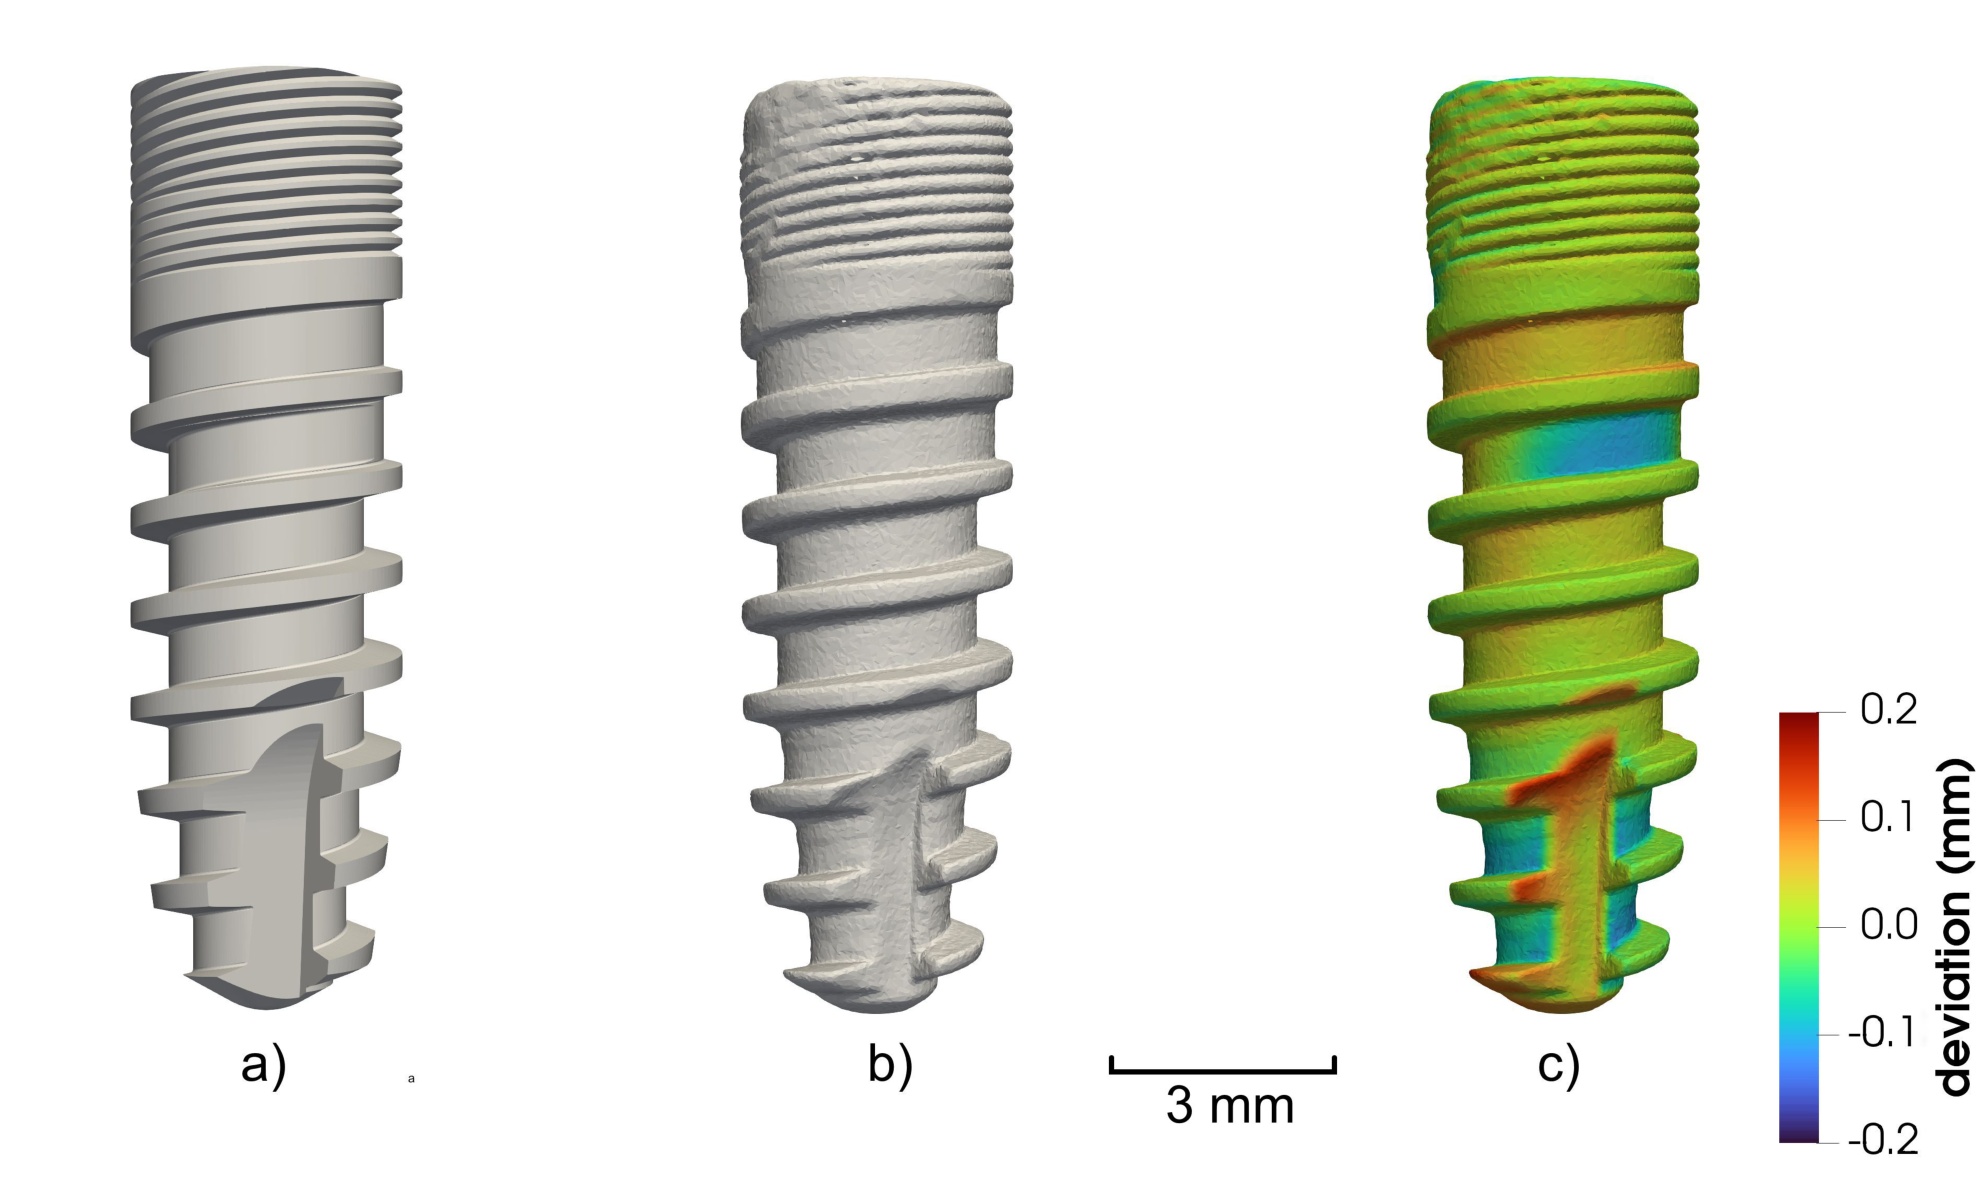
Fig. 2.
Component D1: (a) nominal CAD model; (b) μCT-derived STL surface; (c) supplied color-coded μCT-to-CAD deviation rendering. The scale bar indicates 3 mm and the displayed color represents ±0.2 mm deviation. Quantitative vertex summaries are calculated from the separate D1 export.
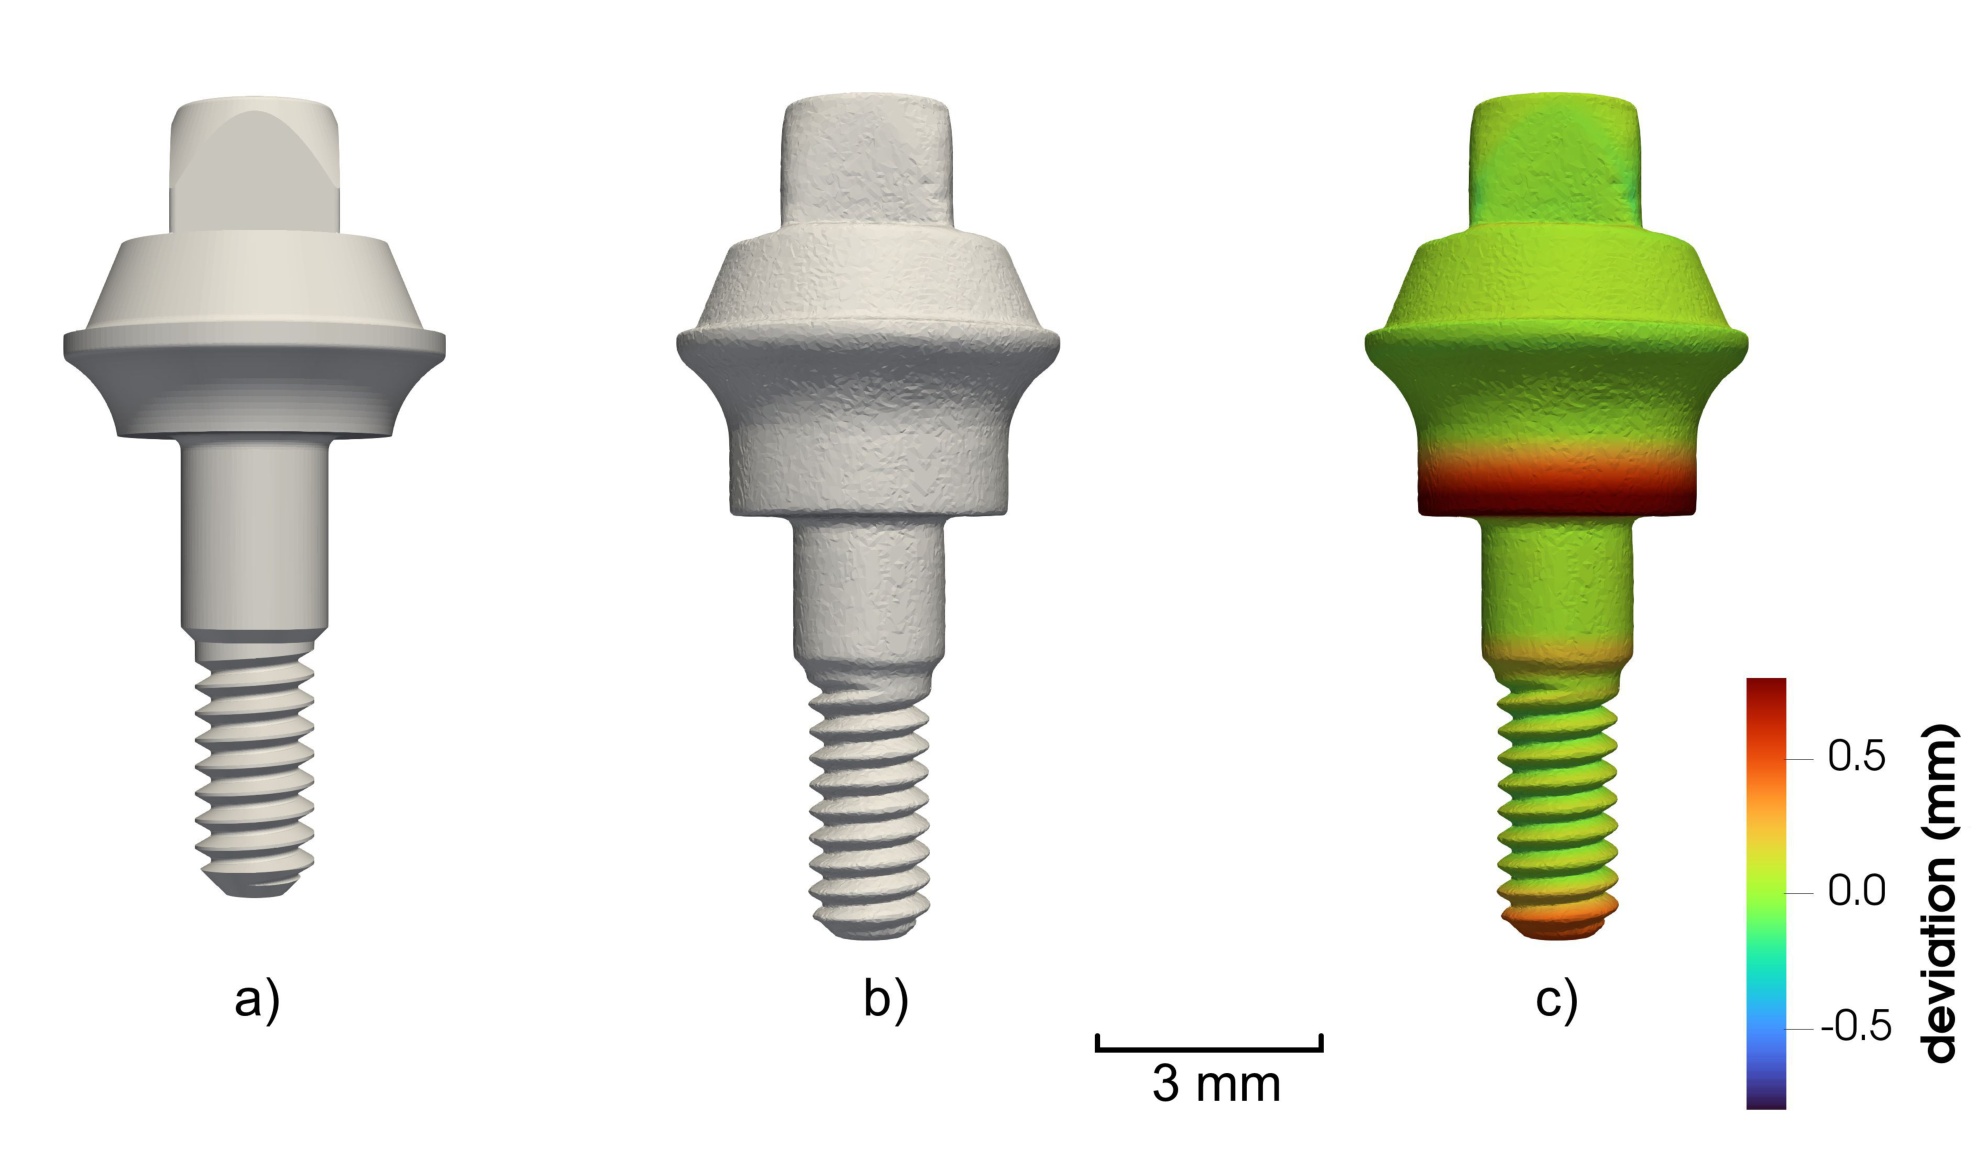
Fig. 3.
Component D2: (a) nominal CAD model; (b) μCT-derived STL surface; (c) supplied color-coded μCT-to-CAD deviation rendering. The scale bar indicates 3 mm, and the displayed color range represents ±0.7 mm deviation. The D1 and D2 colors represent different numeric scales.
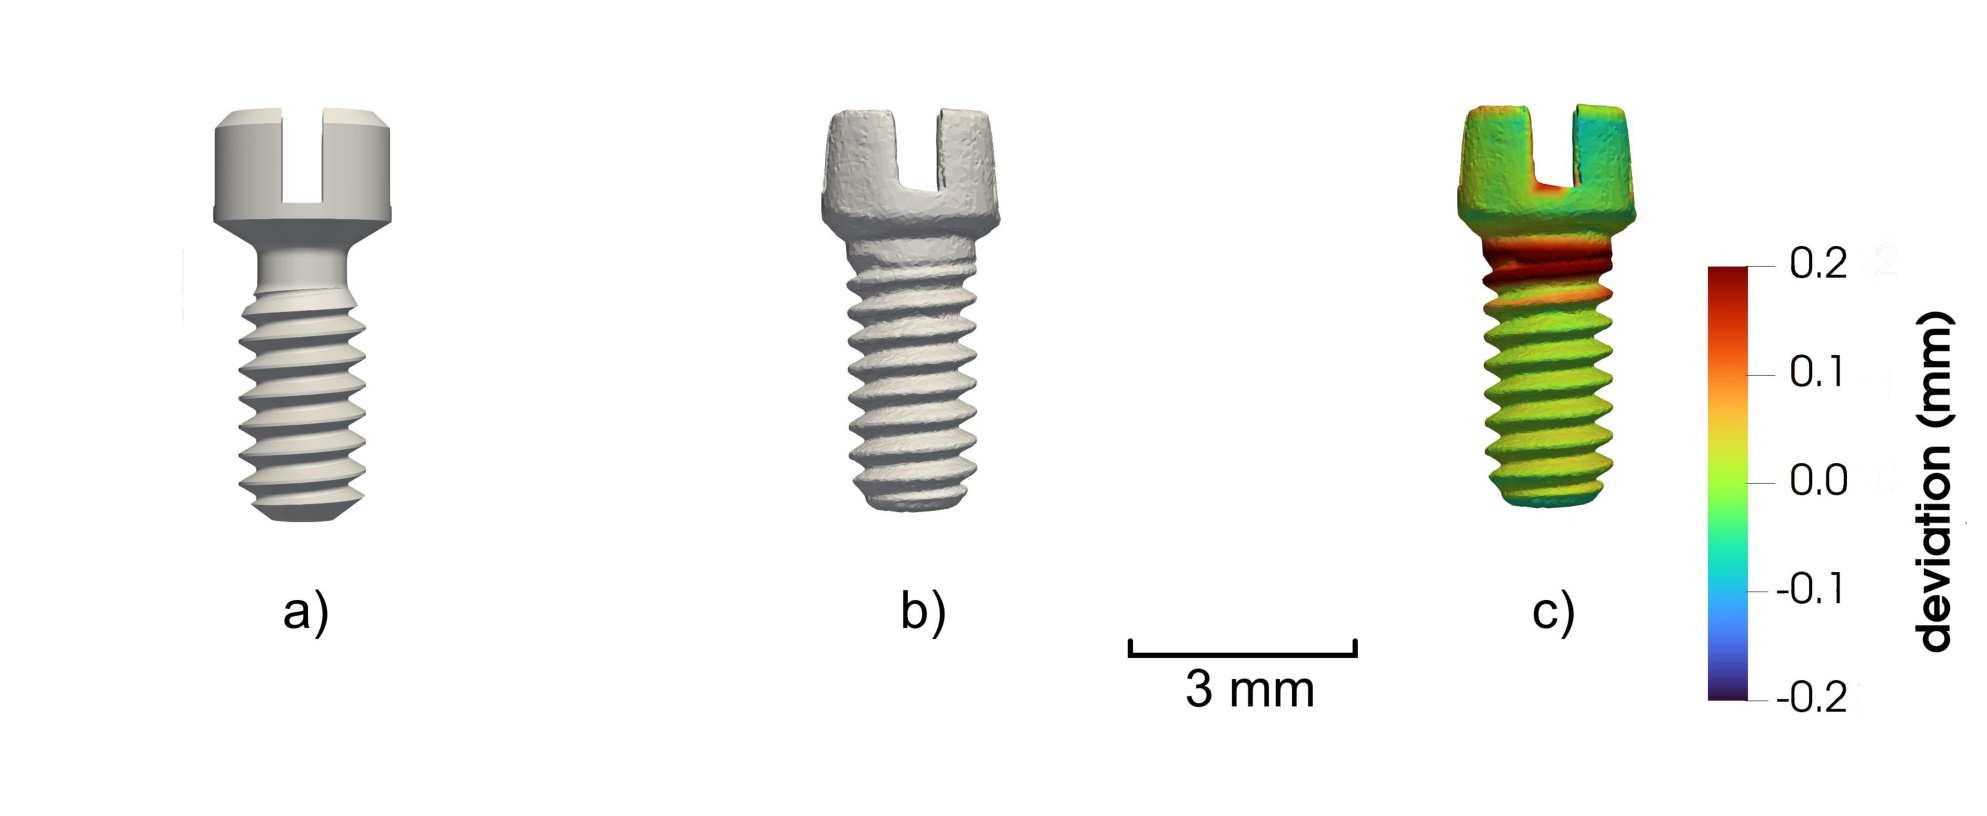
Fig. 4.
Component D3: (a) nominal CAD model; (b) μCT-derived STL surface; (c) supplied color-coded μCT-to-CAD deviation rendering. The scale bar indicates 3 mm, and the displayed color range represents ±0.2 mm deviation.
Table 1.
Signed nearest-surface μCT-to-CAD deviations at the measured STL vertices.
| Metric | D1 | D2 | D3 |
|---|---|---|---|
| N | 75 812 | 46 954 | 16 416 |
| Mean | 5.22 | 60.52 | 22.55 |
| Median | 9.26 | 28.48 | 13.12 |
| SD | 48.86 | 198.71 | 73.70 |
| RMS | 49.14 | 207.72 | 77.07 |
| MAE | 35.32 | 114.17 | 48.71 |
| Q0.95(|d|) | 92.08 | 526.78 | 191.73 |
| Q0.99(|d|) | 136.92 | 836.97 | 248.90 |
| Minimum | −154.78 | −485.76 | −218.32 |
| Maximum | 548.66 | 877.96 | 326.77 |
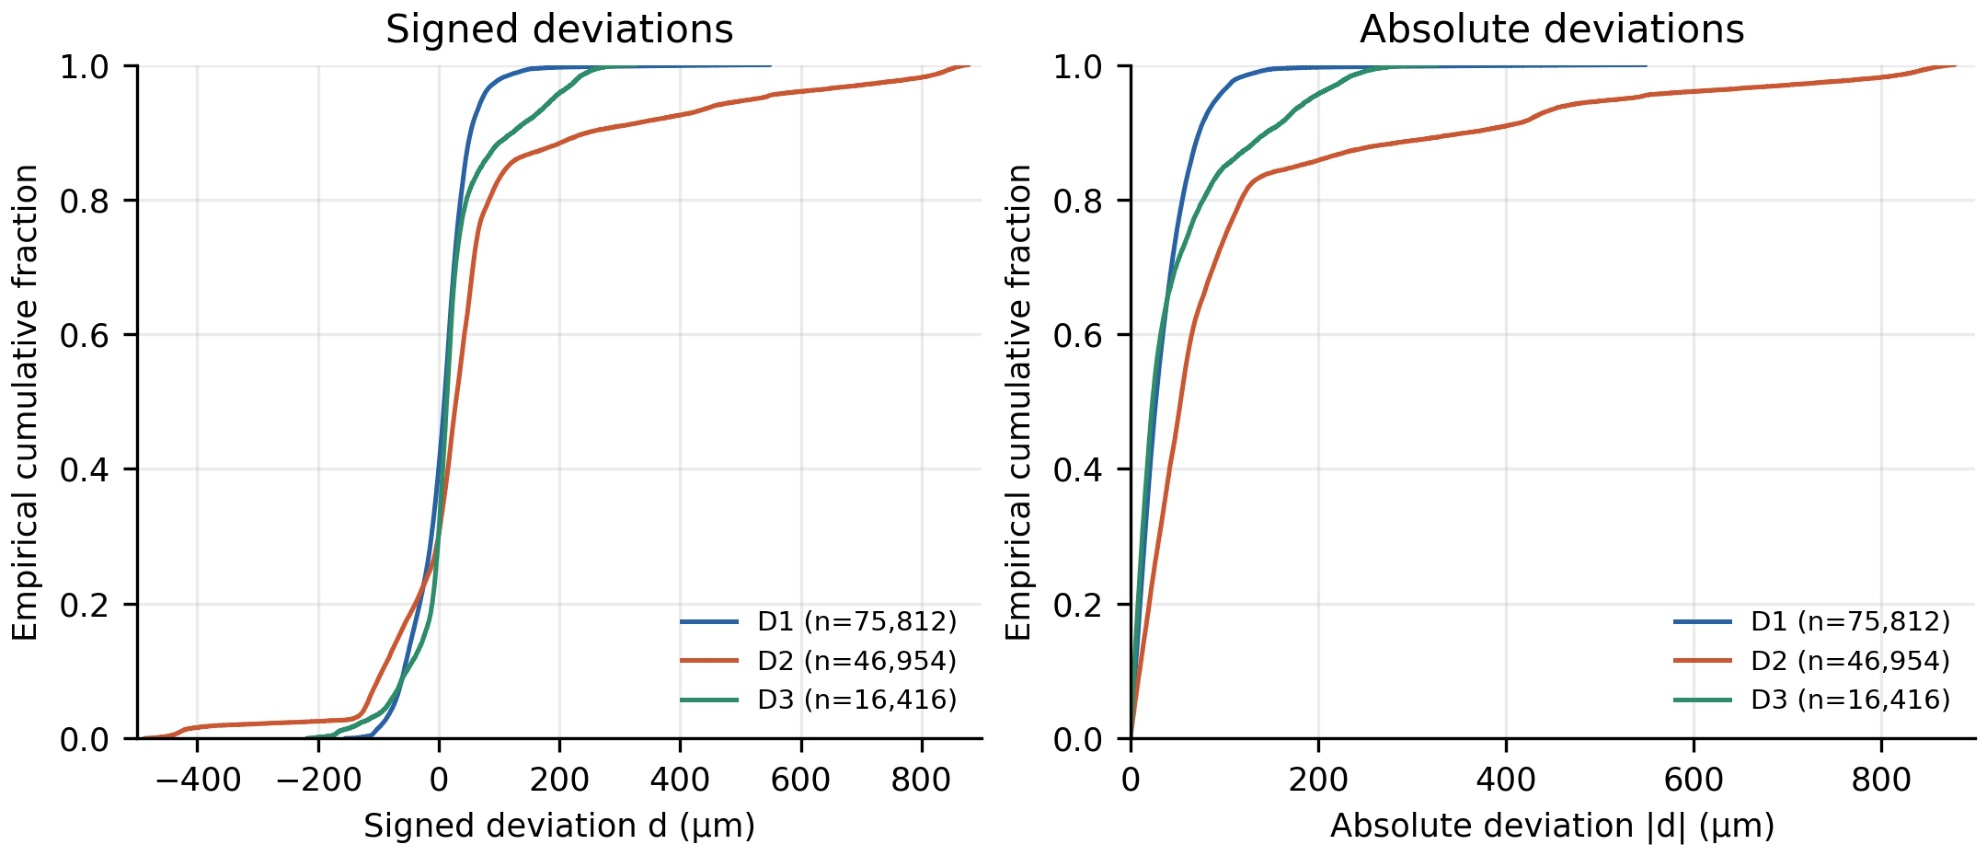
Fig. 5.
Vertex-based ECDFs of signed μCT-to-CAD nearest-surface deviations d (left) and absolute deviations |d| (right). The three curves use complete but differently meshed component surfaces.
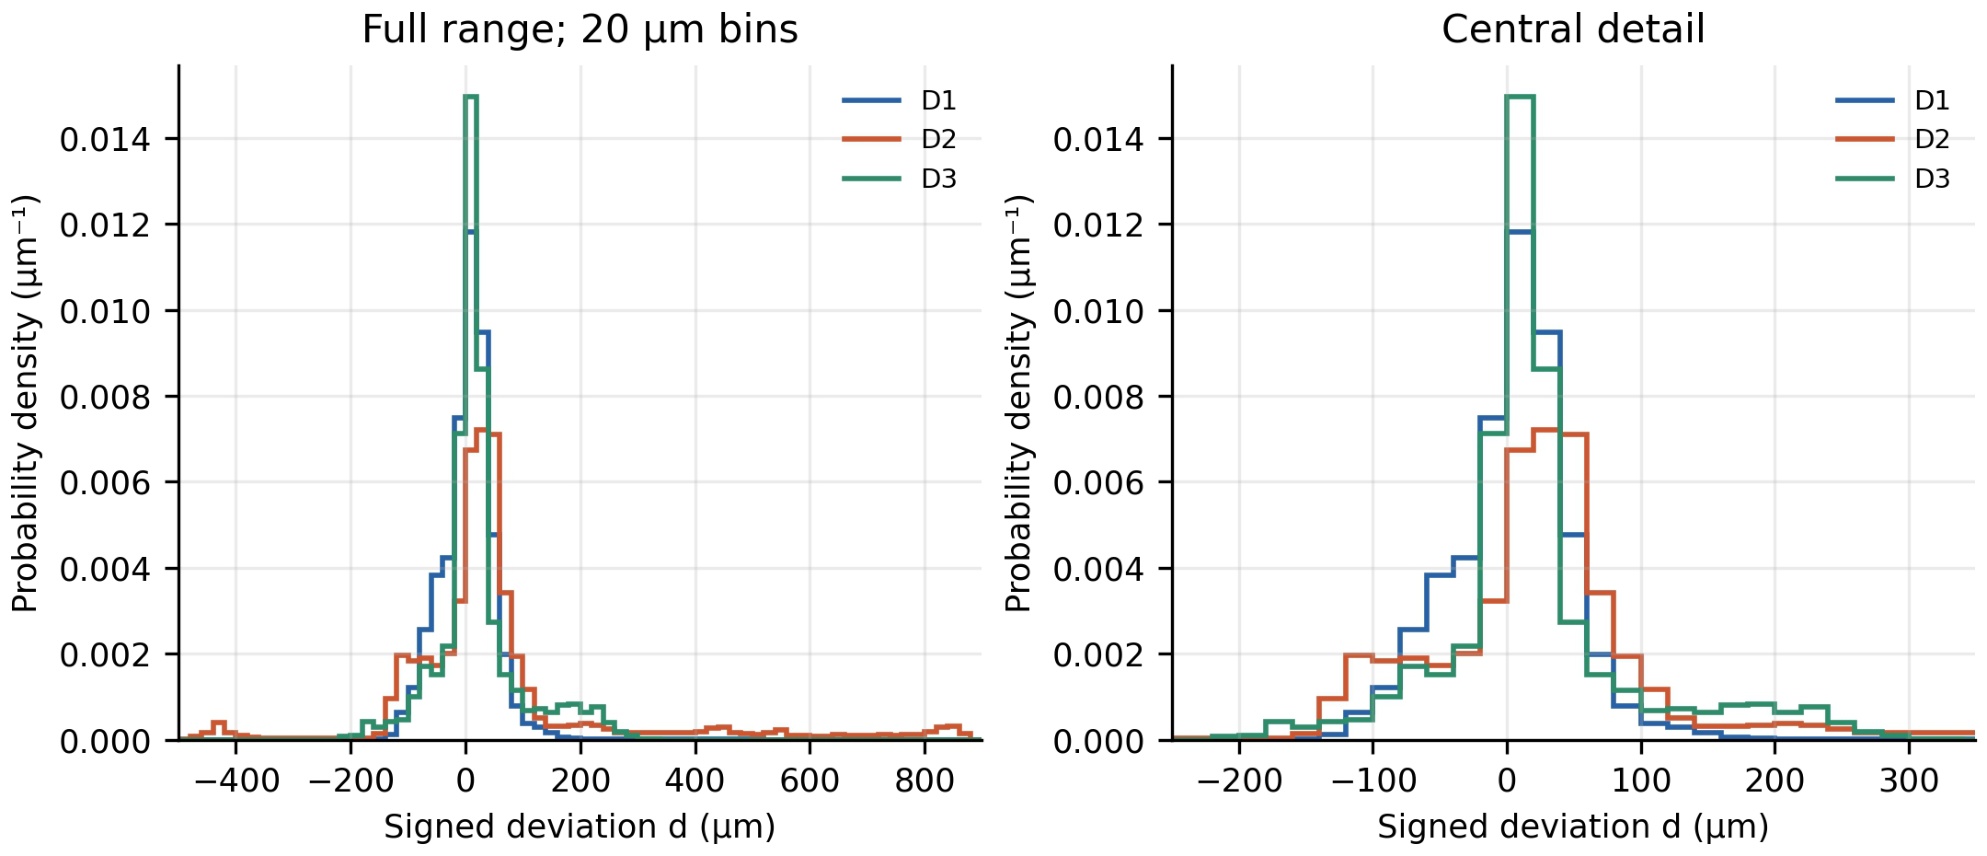
Fig. 6.
Histograms of signed vertex deviations normalized to probability density (μm−1). The entire range (left) and central detail (right) use identical 20 μm bins and density values. Each full histogram has unit area.
Table 2.
Percentage of vertices with |d| ≤ Δ.
| Δ (μm) | D1 | D2 | D3 |
|---|---|---|---|
| 20 | 38.60 | 19.94 | 44.17 |
| 50 | 75.89 | 46.90 | 70.64 |
| 100 | 96.28 | 74.25 | 84.90 |
| 200 | 99.65 | 85.83 | 95.67 |
| 300 | 99.80 | 88.76 | 99.94 |
Table 3.
Normality diagnostics and exploratory marginal fits for the full signed vertex-deviation exports.
| Quantity | D1 | D2 | D3 |
|---|---|---|---|
| N | 75 812 | 46 954 | 16 416 |
| Skewness | 1.34 | 1.88 | 0.88 |
| Excess kurtosis | 12.05 | 5.56 | 2.37 |
| AD statistic (normal) | 795.21 | 4414.05 | 833.92 |
| Nominal AD p | ≤ 0.0005 | ≤ 0.0005 | ≤ 0.0005 |
| AIC (normal) | −242577 | −18493 | −39028 |
| AIC (Student’s t) | −255007 | −62871 | −46548 |
Table 4.
Pairwise maximum distances between the vertex ECDFs of the three individual components.
| Component pair | DKS(d) | DKS(|d|) |
|---|---|---|
| D1–D2 | 0.2474 | 0.2908 |
| D1–D3 | 0.1111 | 0.1175 |
| D2–D3 | 0.2092 | 0.2878 |
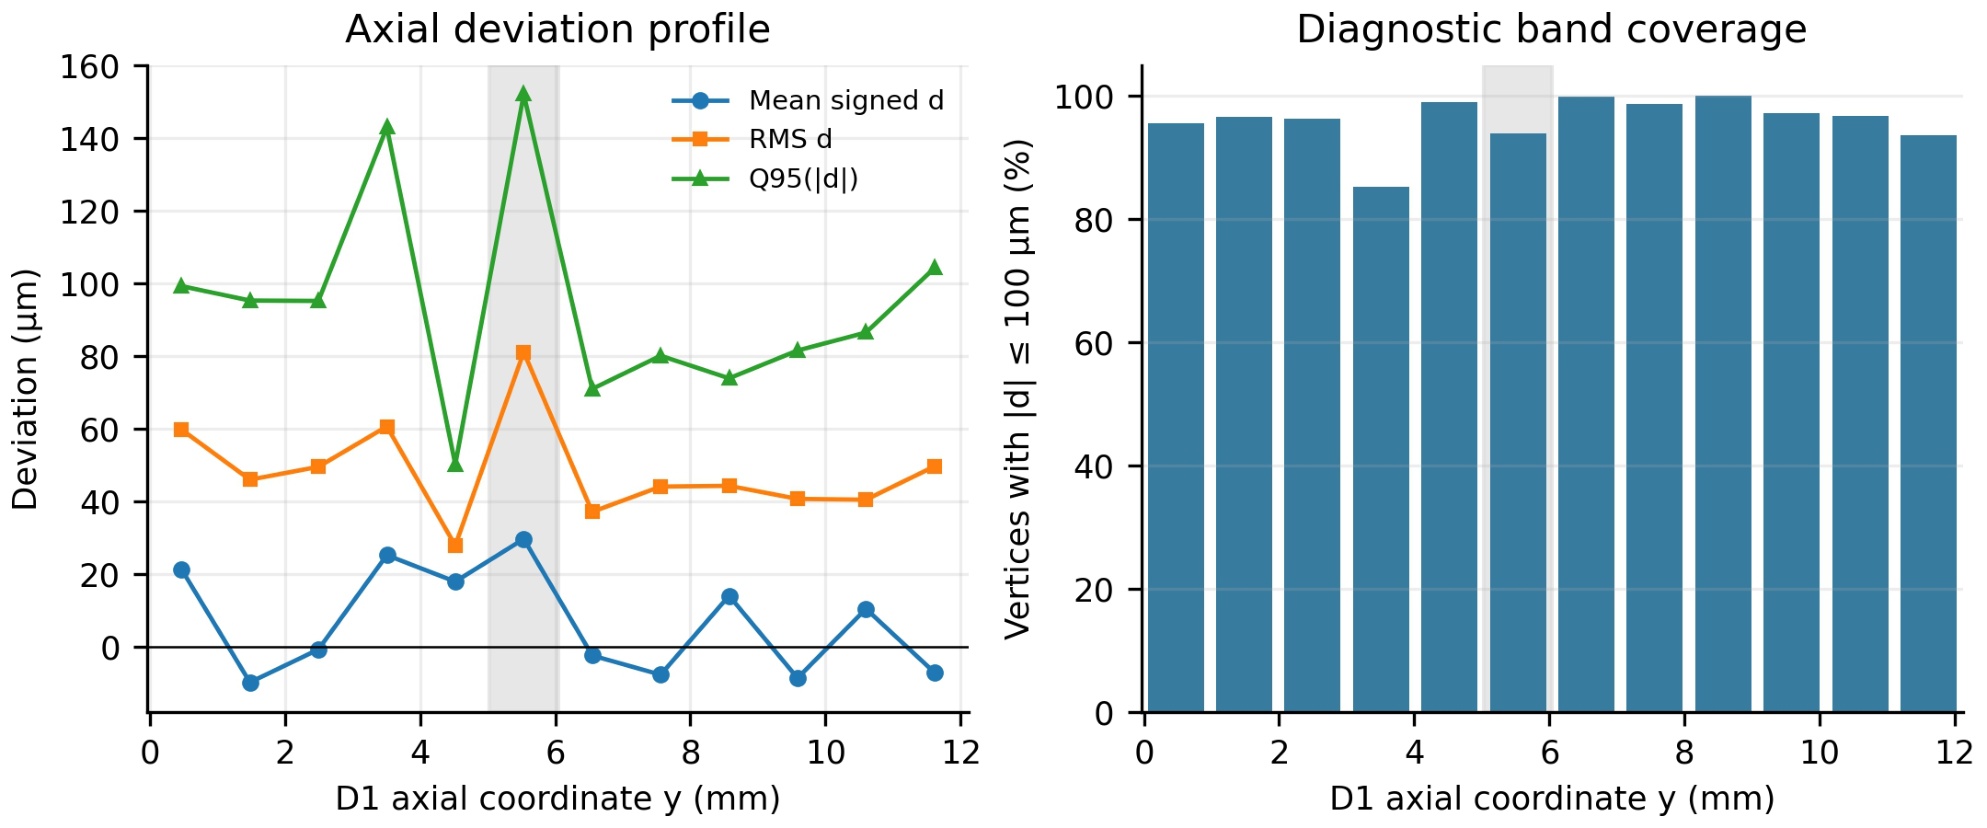
Fig. 7.
Axial analysis of the D1 vertex deviations in 12 equal-width y intervals. Left: signed mean, RMS, and 95th percentile of |d|; right: percentage of vertices with |d| ≤ 100 μm. Shading marks interval 6, which contains every D1 vertex with |d| > 200 μm. Regional weights reflect local mesh density.
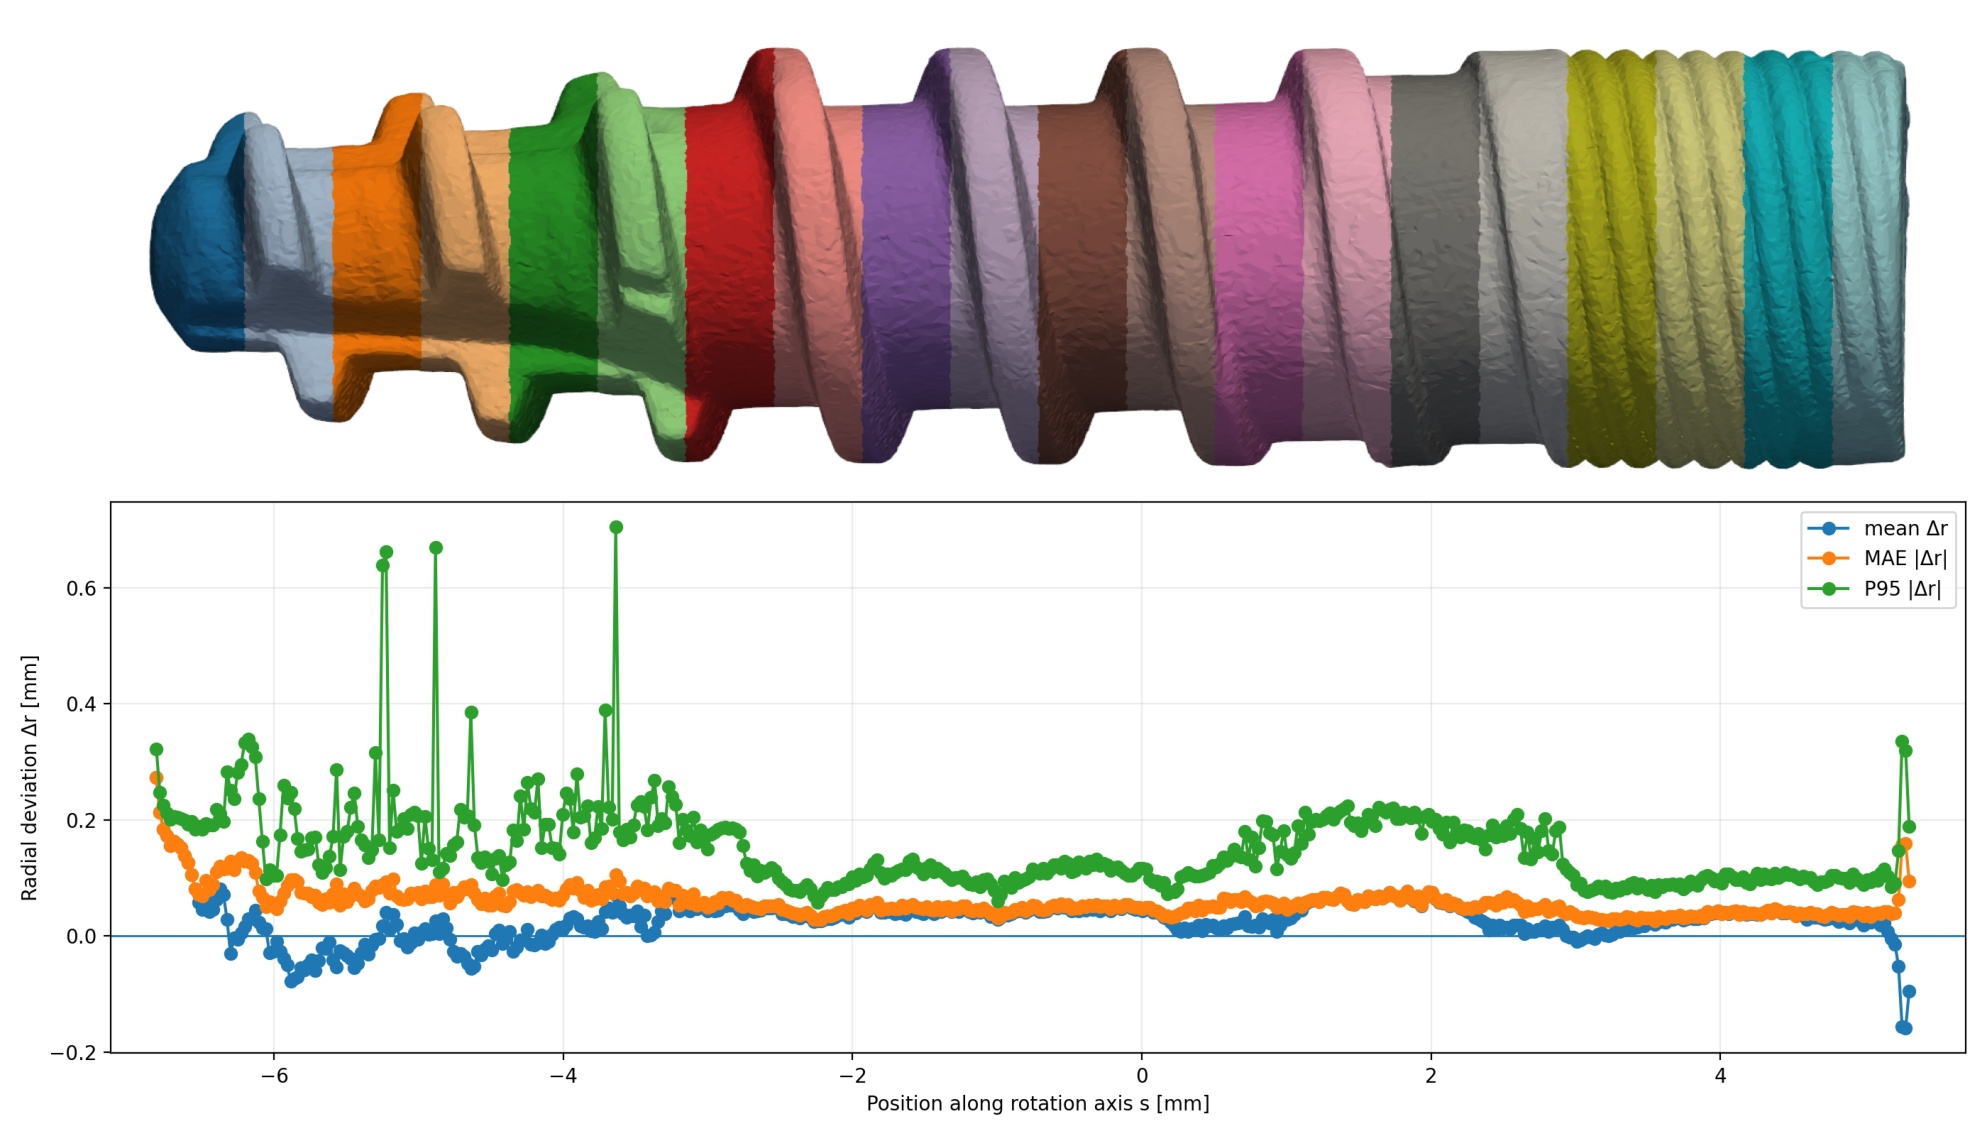
Fig. 8.
Rotational-axis diagnostics of μCT D1 aligned to CAD model. Upper: rendering of 75 812 STL vertices colored by axial region (colors identify regions, not deviation). Lower: 497 intervals along the rotation axis s; signed mean Δr, mean |Δr|, and 95th percentile of |Δr| are computed from 79 841 valid radial locations. The radial difference is defined relative to the recorded axis and must not be equated with the nearest-CAD-surface deviation in Fig. 7.