
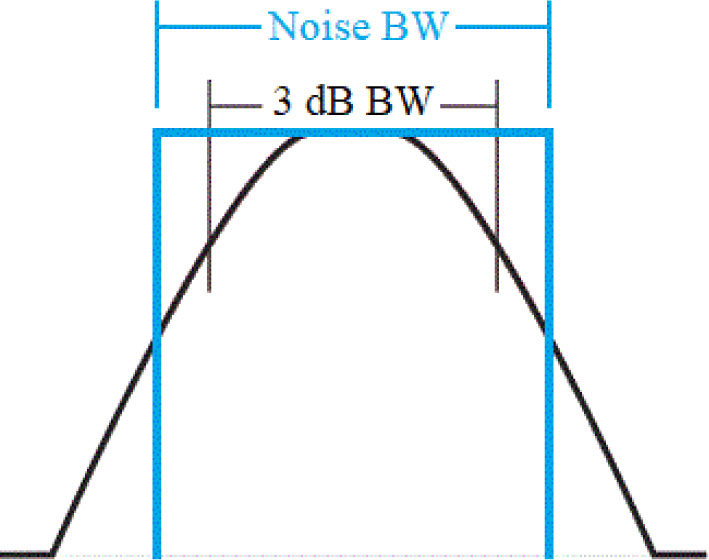
Fig. 1.
Noise bandwidth determination.
Table 1.
The tested resistors and their parameters.
| Resistor technology | Metal-oxide | Thick-film | Thick-film |
|---|---|---|---|
| Resistance [GΩ] | 1 | 1 | 1 |
| Tolerance [%] | ±1 | ±1 | ±1 |
| Manufacturer | Ohmite | Ohmite | Ohmite |
| Series | RX-1M Hi-Meg | Slim-Mox | Maxi-Mox |
| Number | RX-1M1007FE | SM102031007FE | MOX-1-121007FE |
| Package | Glass sealed | Planar | Axial |
| Rated voltage [kV] | 1 | 5 | 10 |
| Thermal coefficient [PPM/°C] | 50 | 25 | 100 |
| VCR voltage coefficient [PPM/V] | - | < 5 | < 2 |
| Number of tested samples | 2 | 10 | 1 |
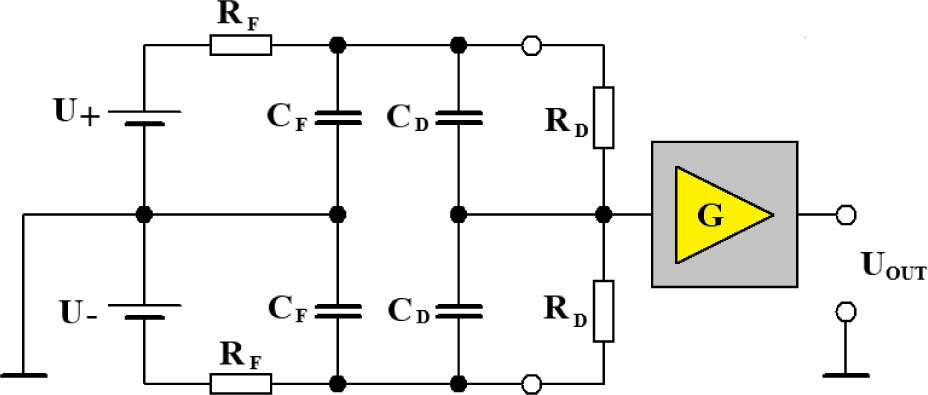
Fig. 2.
The circuit diagram for measuring resistor 1/f flicker noise with two identical resistors [17].
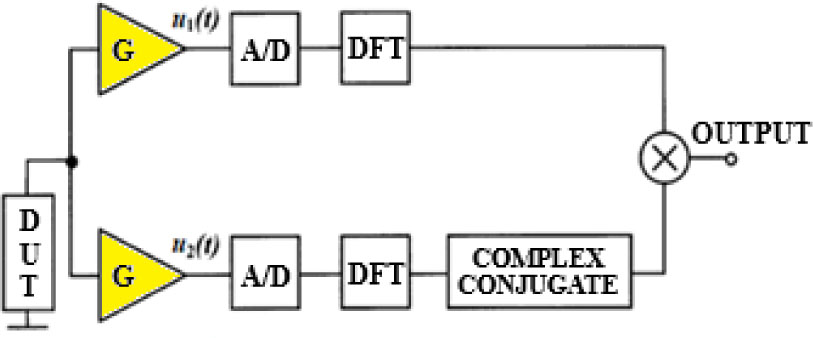
Fig. 3.
The block diagram for noise measurement using the correlation of two channels of a spectrum analyzer [18].
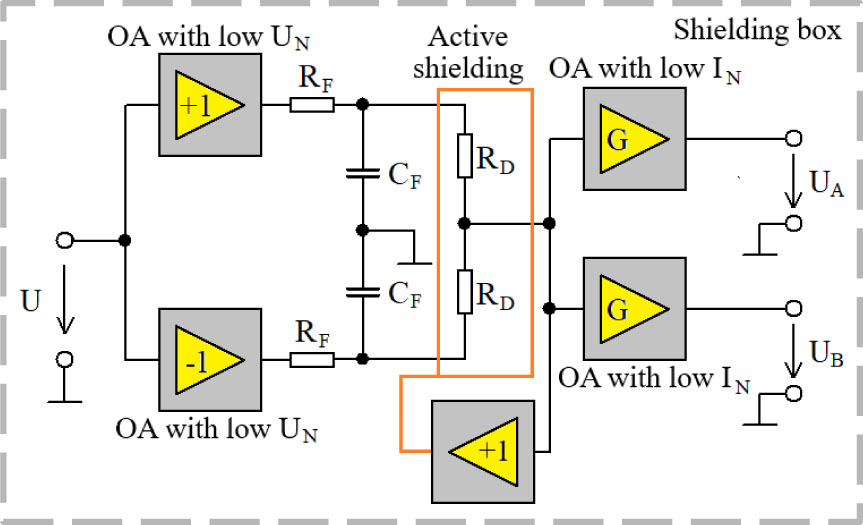
Fig. 4.
The circuit diagram for measuring resistor 1/f noise with two identical resistors and two channels of a spectrum analyzer [19].
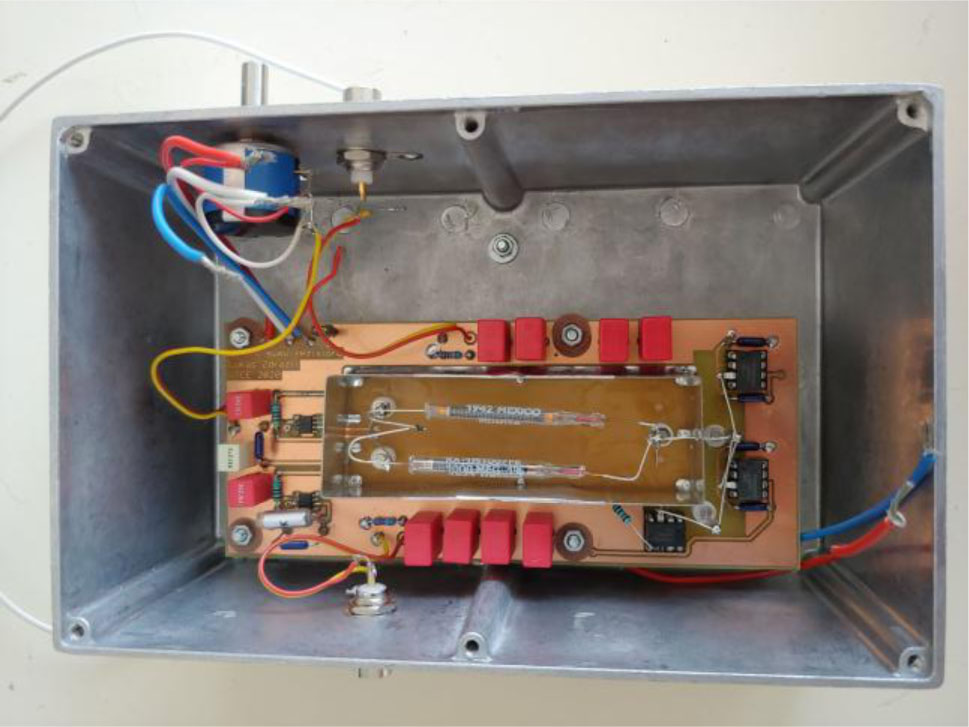
Fig. 5.
A photo of the measuring equipment in the shielding box.
Table 2.
The changes in the upper cut-off frequency in relation to the measured resistor.
| Resistor | Frequency [Hz] | |
|---|---|---|
| No active shielding | Active shielding | |
| 10 MΩ | 5500 | 6880 |
| 100 MΩ | 677 | 840 |
| 1 GΩ | 68 | 93 |
| 10 GΩ | 6.5 | 9.5 |
| 100 GΩ | 0.95 | 1.54 |
| 500 GΩ | 0.27 | 0.45 |
| 1 TΩ | 0.19 | 0.37 |
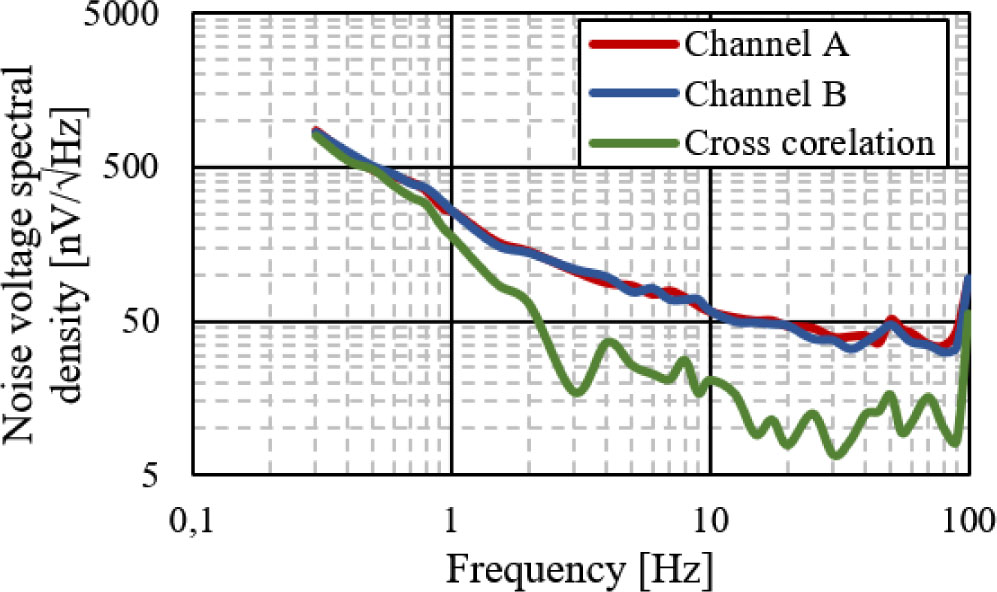
Fig. 6.
The spectral input noise voltage of the measuring system for the resistor noise measurements.
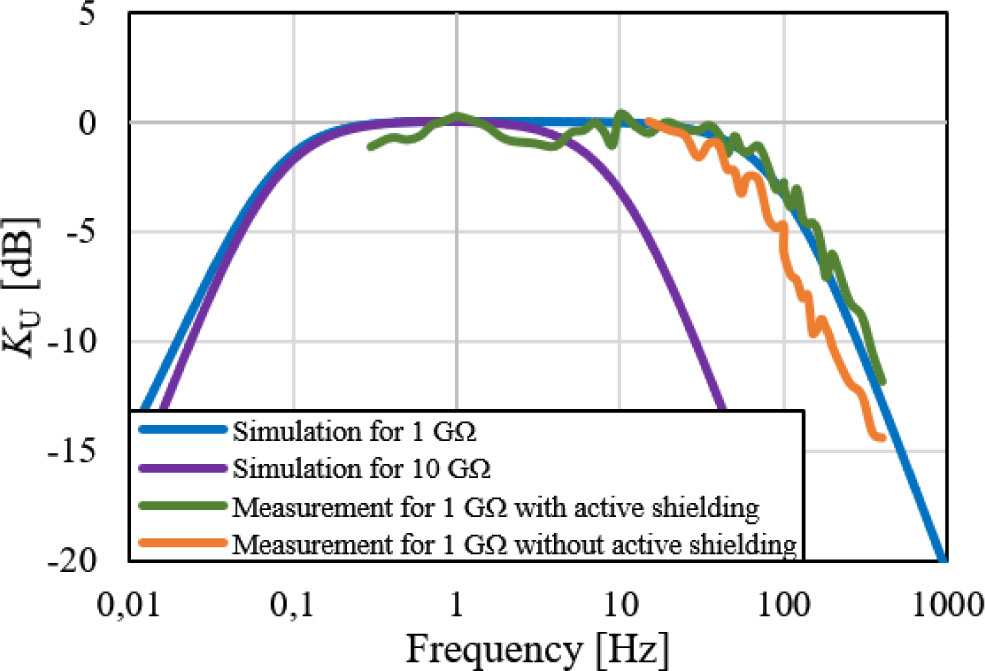
Fig. 7.
The simulated and the measured frequency characteristics of the measuring setup with and without active shielding.
Table 3.
The standard deviation for the measured resistor noise spectral density without cross correlation.
| Frequency [Hz] | 0.3 | 0.5 | 1 | 5 | 10 | 50 | 100 |
|---|---|---|---|---|---|---|---|
| Noise voltage [nV/√Hz] | 857 | 475 | 251 | 84 | 57 | 46 | 51 |
| Noise current [fA/√Hz] | 0.09 | 0.09 | 0.09 | 0.09 | 0.09 | 0.09 | 0.09 |
| Resistor | Deviation [%] | ||||||
| 10 MΩ | 216 | 94 | 33 | 4 | 2 | 1 | 2 |
| 100 MΩ | 38 | 13 | 4 | 0 | 0 | 0 | 0 |
| 1 GΩ | 4 | 1 | 0 | 0 | 0 | 0 | 0 |
| 10 GΩ | 1 | 1 | 0 | 0 | 0 | - | - |
| 100 GΩ | 4 | 4 | 4 | - | - | - | - |
| 500 GΩ | 20 | 20 | - | - | - | - | - |
| 1 TΩ | 37 | - | - | - | - | - | - |
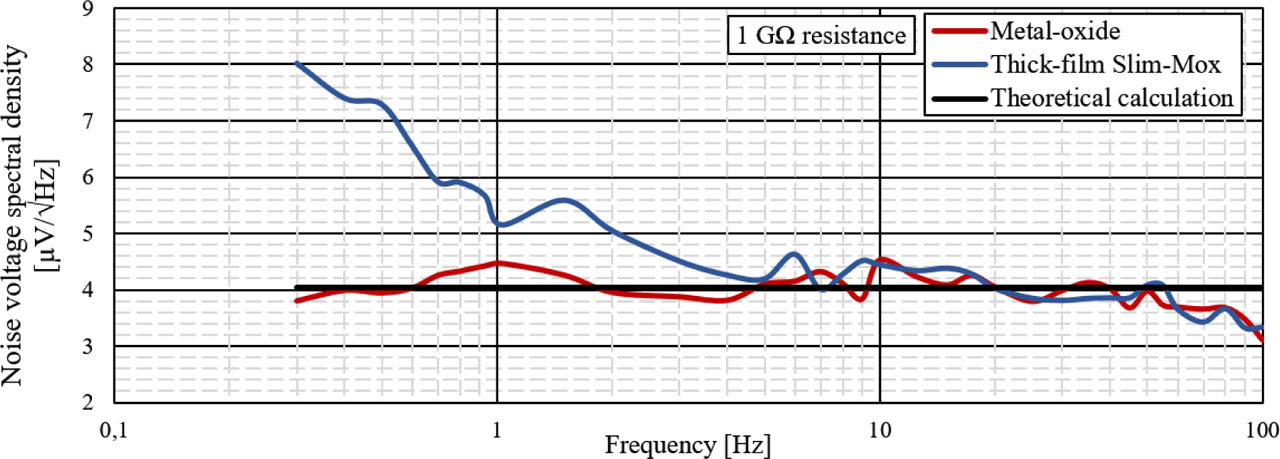
Fig. 8.
Measured noise voltage spectral density of metal-oxide and thick-film Slim-Mox series resistors.
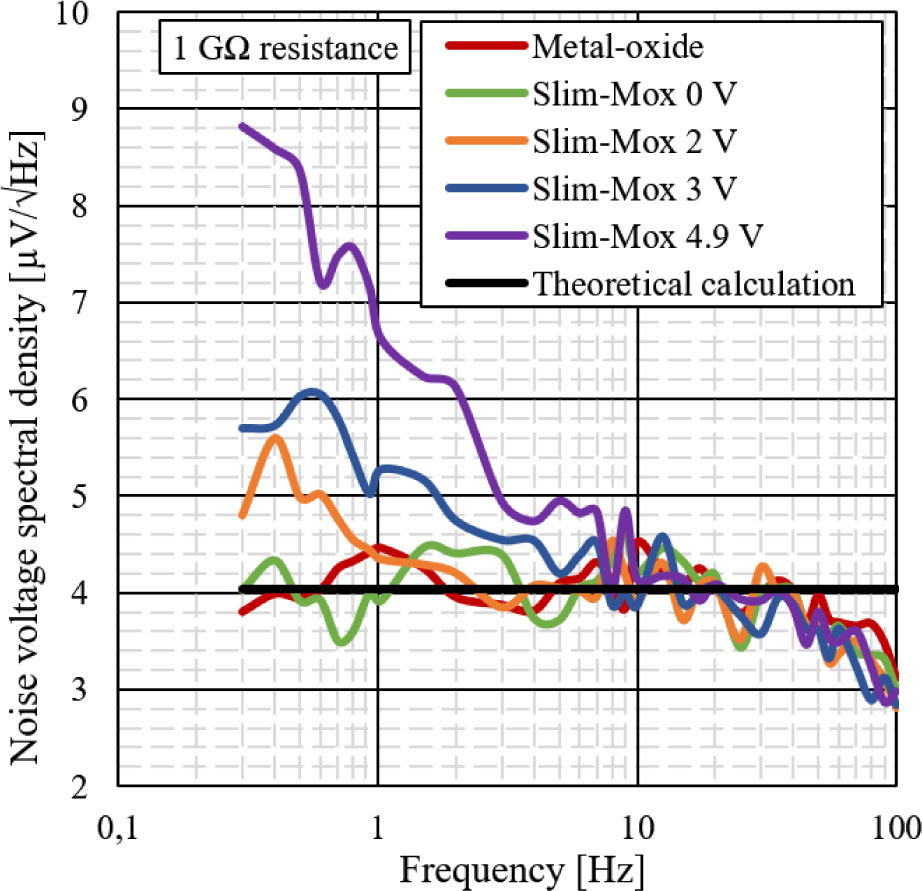
Fig. 9.
Measured spectral voltage density as a function of the voltage drop across the measured resistor.
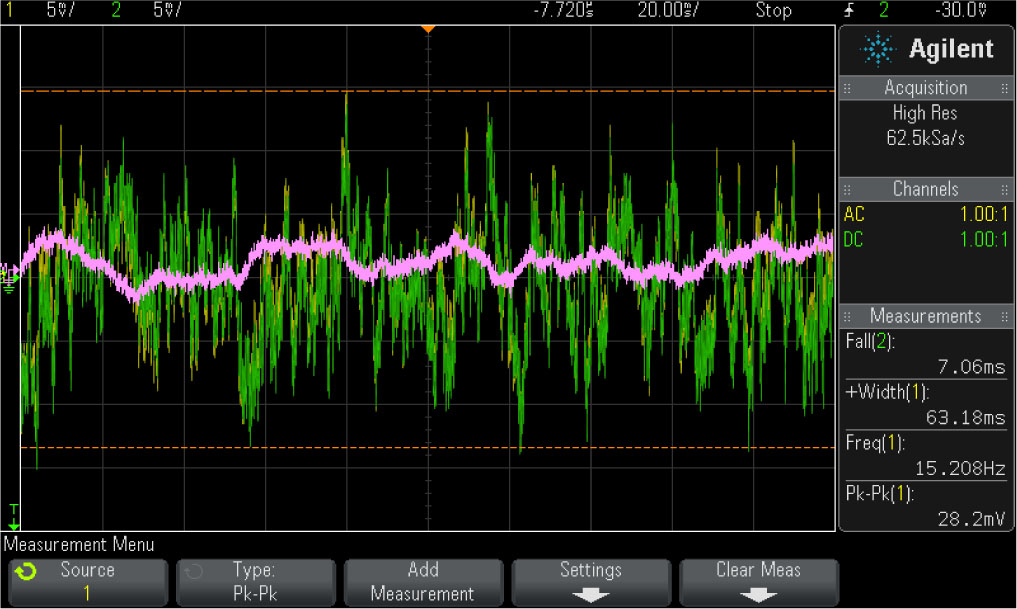
Fig. 10.
Time course of resistor noise voltage for both channels (yellow and green) and their difference (pink).
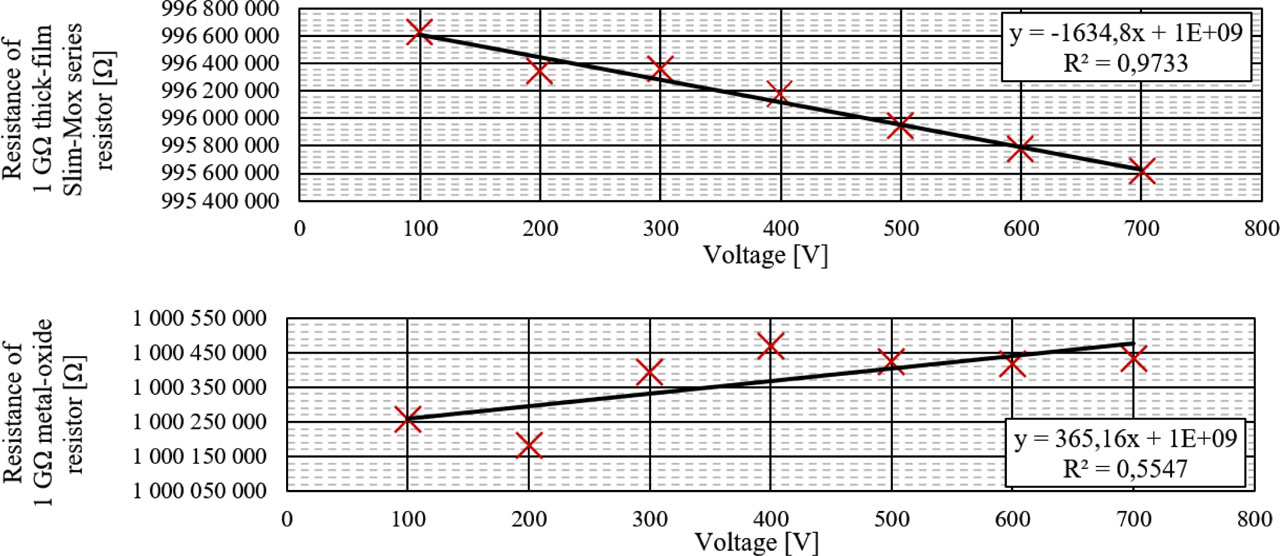
Fig. 11.
Resistance dependence on the applied voltage for a 1 GΩ thick-film Slim-Mox series resistor and a 1 GΩ metal-oxide resistor.
Table 4.
Standard deviation for measured resistance dependence on the applied voltage.
| Voltage [V] | 100 | 200 | 300 | 400 | 500 | 600 | 700 |
|---|---|---|---|---|---|---|---|
| Metal-oxide [kΩ] | 58.8 | 16.1 | 10.6 | 7.4 | 6.3 | 5.8 | 6.8 |
| Slim-Mox [kΩ] | 4.8 | 2.5 | 12.7 | 10.8 | 11.6 | 11.1 | 14.1 |
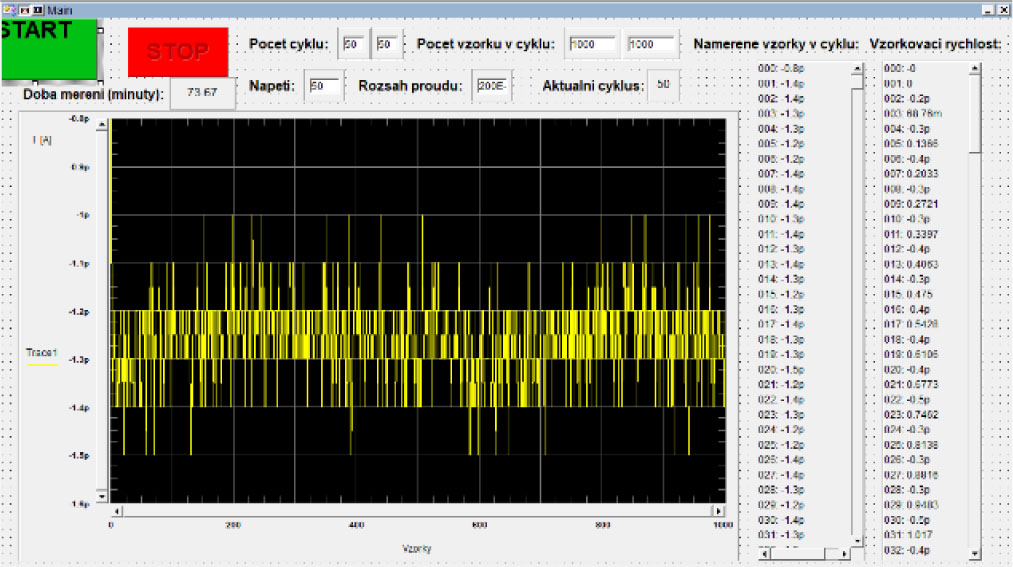
Fig. 12.
The main screen of the resistor current sampling application in the VEE environment.
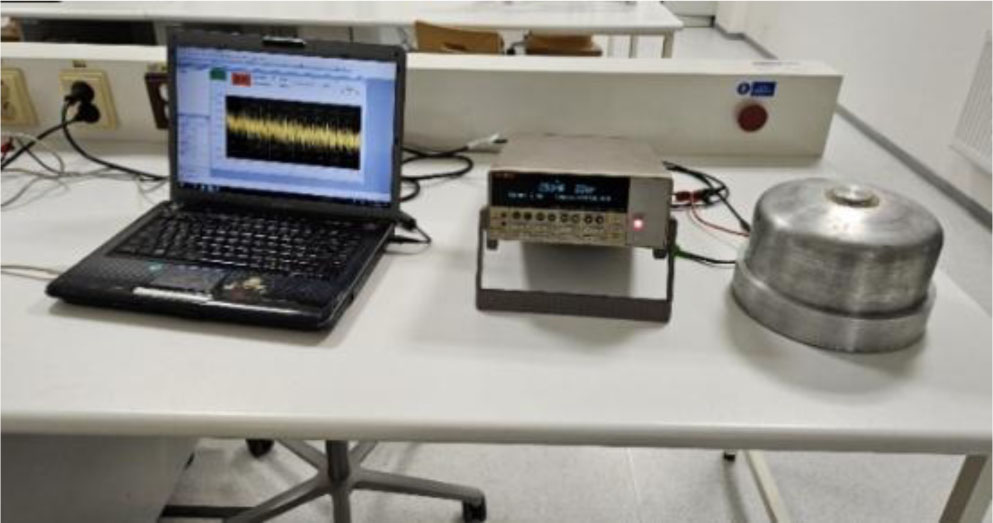
Fig. 13.
The measuring station with the Keithley 6517A electrometer.
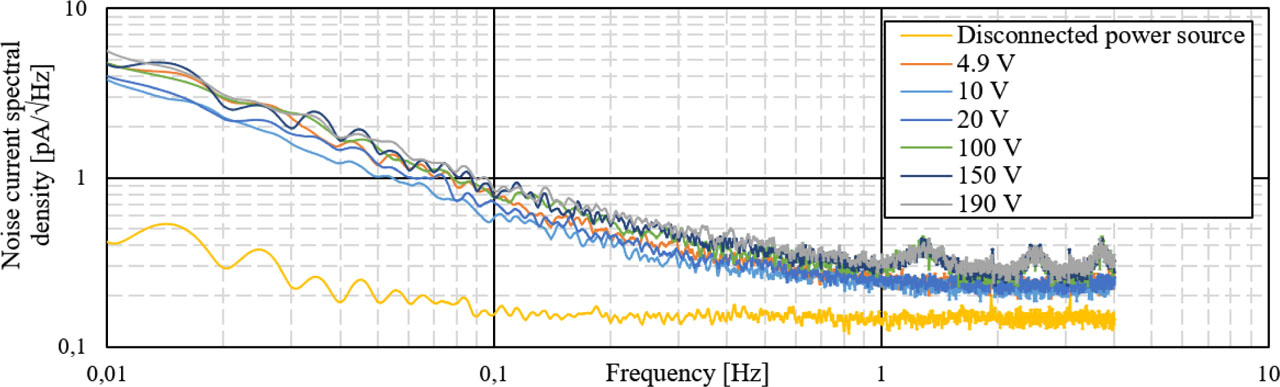
Fig. 14.
The 6517A electrometer background noise current spectral density.
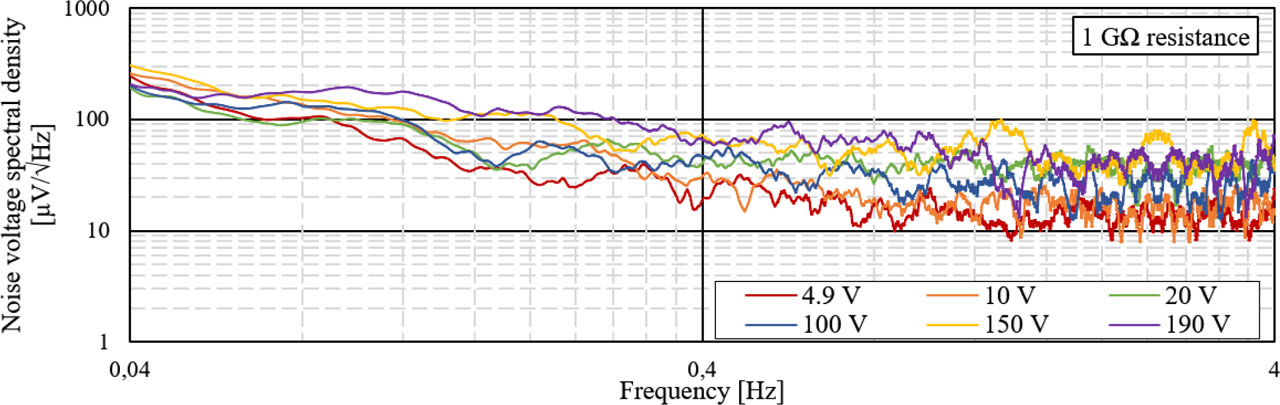
Fig. 15.
Noise voltage spectral density measured using the 6517A electrometer for a 1 GΩ thick-film Slim-Mox series resistor.
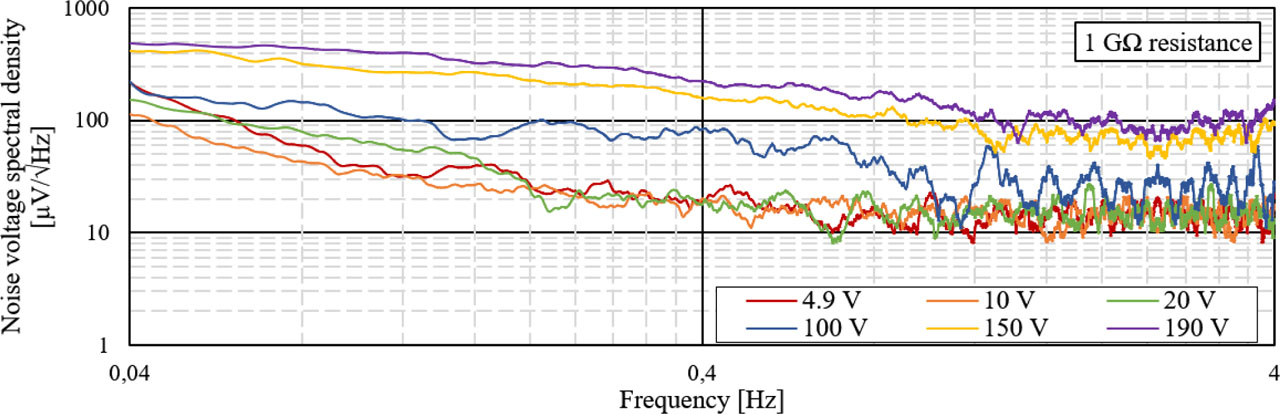
Fig. 16.
Noise voltage spectral density measured using the 6517A electrometer for a 1 GΩ thick-film Maxi-Mox series resistor.
Table 5.
Verification of the repeatability of the voltage coefficient (VCR) and noise measurements for a series of Slim-Mox resistors.
| Resistor samples | Tolerance [%] | VCR [PPM/V] | Noise [µV/√Hz] |
|---|---|---|---|
| 1 | –0.43 | –5.29 | 8.8 |
| 2 | –0.33 | –3.84 | |
| 3 | –0.54 | –3.49 | 8.6 |
| 5 | –0.23 | –3.90 | |
| 8 | –0.64 | –4.59 | 8.3 |
| 10 | –0.65 | –5.07 | |
| 4 | –0.61 | –4.03 | 8.1 |
| 9 | –0.18 | –4.04 | |
| 6 | –0.44 | –4.16 | 7.9 |
| 7 | –0.15 | –4.11 |