
| Symbol/Abbreviation | Definition | Unit |
|---|---|---|
| ASR | Alkali–silica reaction | — |
| C–S–H | Calcium silicate hydrate | — |
| GG | Green Glass | — |
| ITZ | Interfacial transition zone | — |
| K f | Sulfate resistance coefficient | % |
| LCD | Liquid crystal display | — |
| MIP | Mercury intrusion porosimetry | — |
| MS | Manufactured sand | — |
| RS | River sand | — |
| SEM | Scanning electron microscopy | — |
| SSD | Saturated surface dry | — |
| TG | LCD Glass | — |
| ρ | Electrical resistivity | kΩ cm |
| ф | Porosity | % |
Table 1
The physical properties of cement.
| Property | Value |
|---|---|
| Specific surface area (m3/kg) | 358 |
| Initial setting time (min) | 151 |
| Final setting time (min) | 220 |
| 28 day compressive strength (MPa) | 48.6 |
| 28 day flexural strength (MPa) | 8.5 |
Source: Author’s contribution.
Table 2
Chemical composition of cementitious materials (wt%).
| CaO | SiO2 | Al2O3 | Fe2O3 | MgO | TiO2 | SO3 | Other | Loss |
|---|---|---|---|---|---|---|---|---|
| 56.5 | 23.1 | 7.6 | 3.4 | 1.9 | 0.7 | 2.2 | 2.8 | 1.8 |
Source: Author’s contribution.
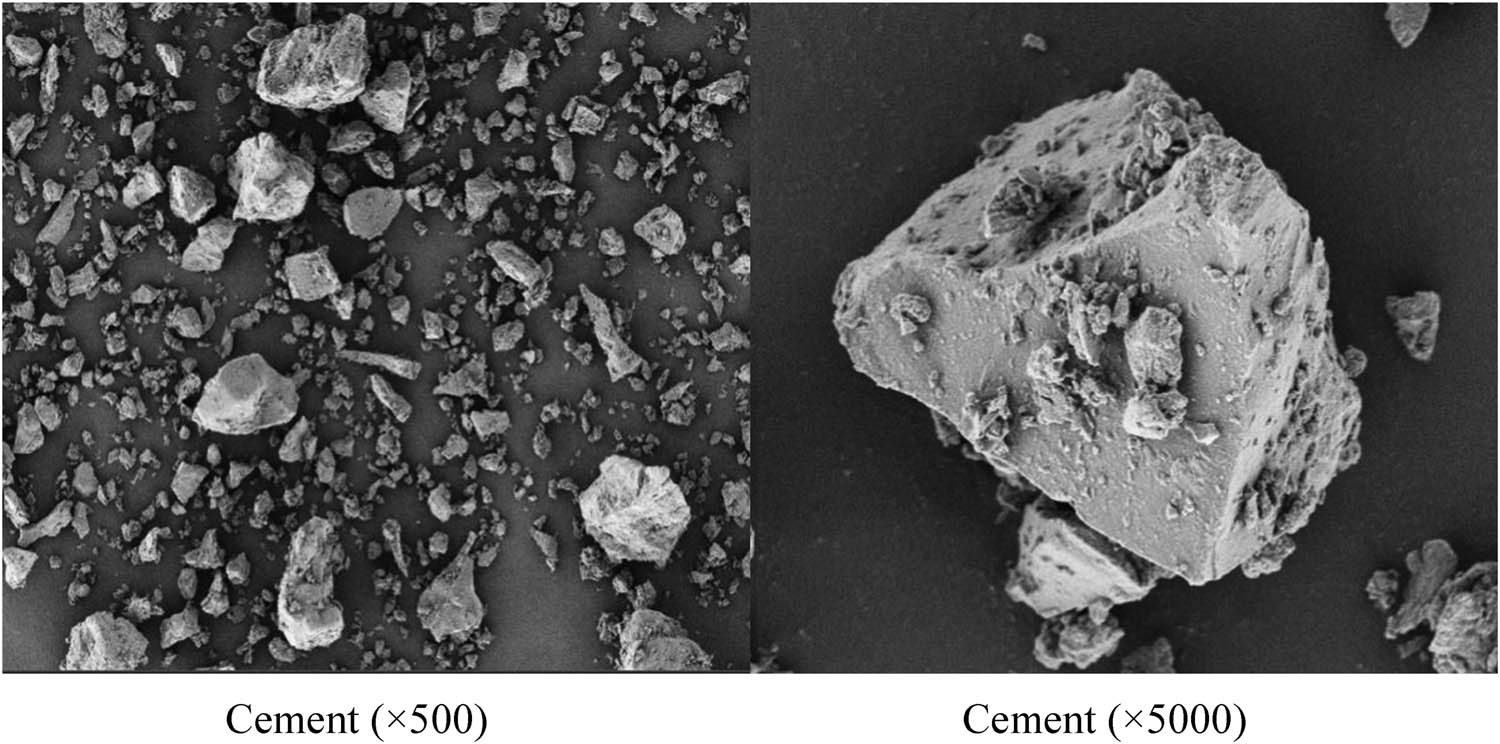
Figure 1
SEM Image of a cement particle.
Source: Author’s contribution.
Table 3
The properties of coarse aggregate.
| Project | Apparent density (kg/m3) | Bulk density (kg/m3) | Crush index (%) | Needle content (%) | Water absorption (%) |
|---|---|---|---|---|---|
| Gravel | 2,710 | 1,840 | 5.0 | 3.6 | 1.5 |
Source: Author’s contribution.
Table 4
Accumulated sieve allowance of gravel.
| Sieve size (mm) | Sieve size (mm) | |||||
|---|---|---|---|---|---|---|
| 2.5 | 5.0 | 10 | 16 | 20 | 25 | |
| Gravel (%) | 99.8 | 78.2 | 53.4 | 21.5 | 2.3 | 0 |
Source: Author’s contribution.
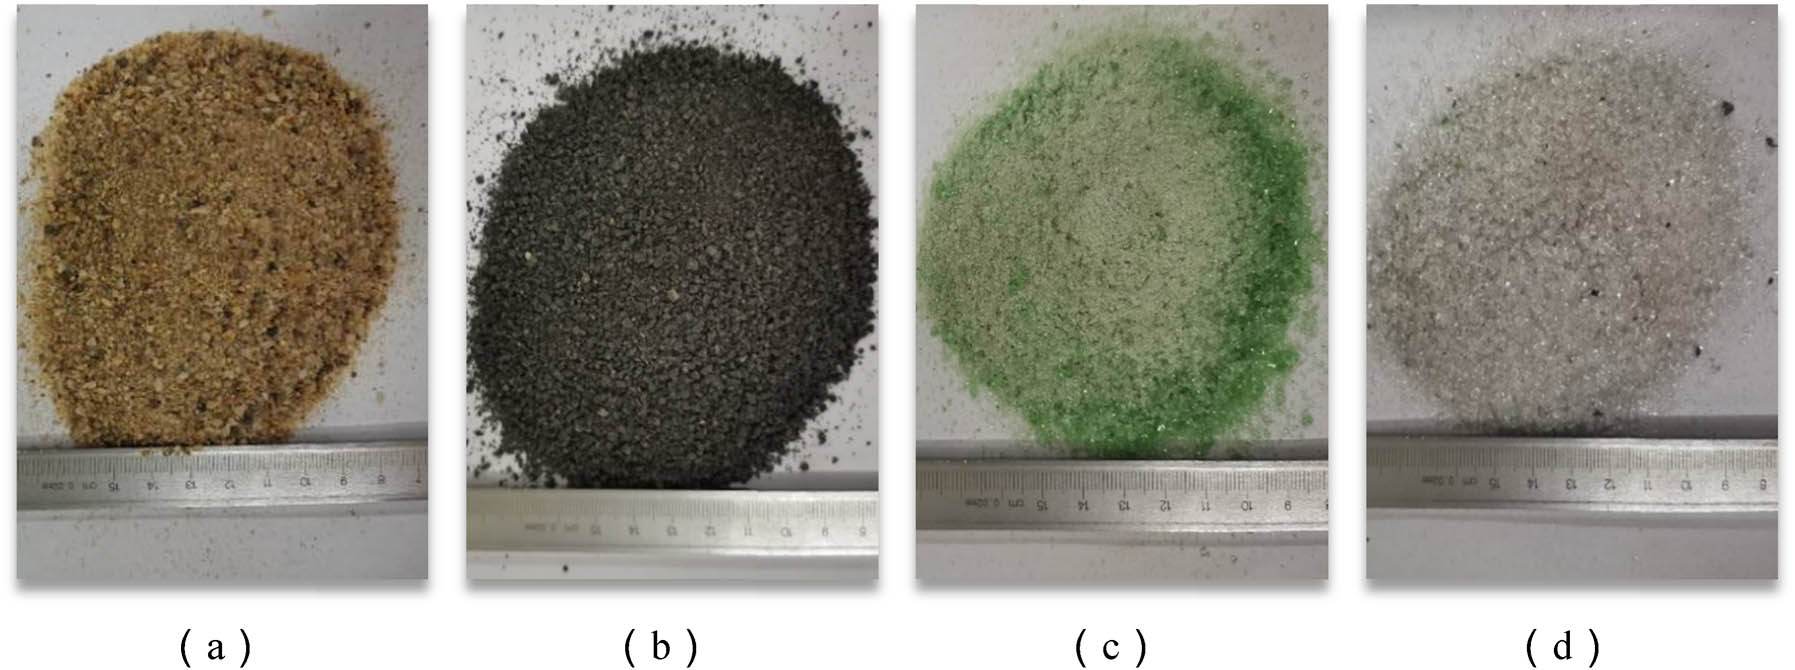
Figure 2
The natural accumulation of fine aggregates. (a) RS, (b) MS, (c) GG, and (d) TG.
Source: Author’s contribution.
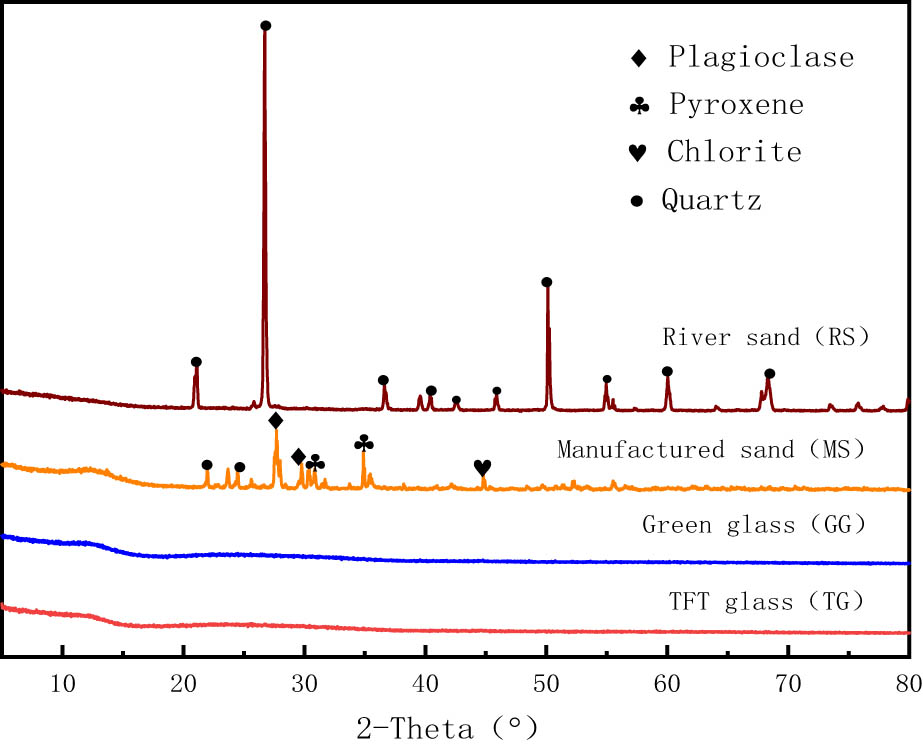
Figure 3
XRD Atlas of two types of glass sand and river sand.
Source: Author’s contribution.
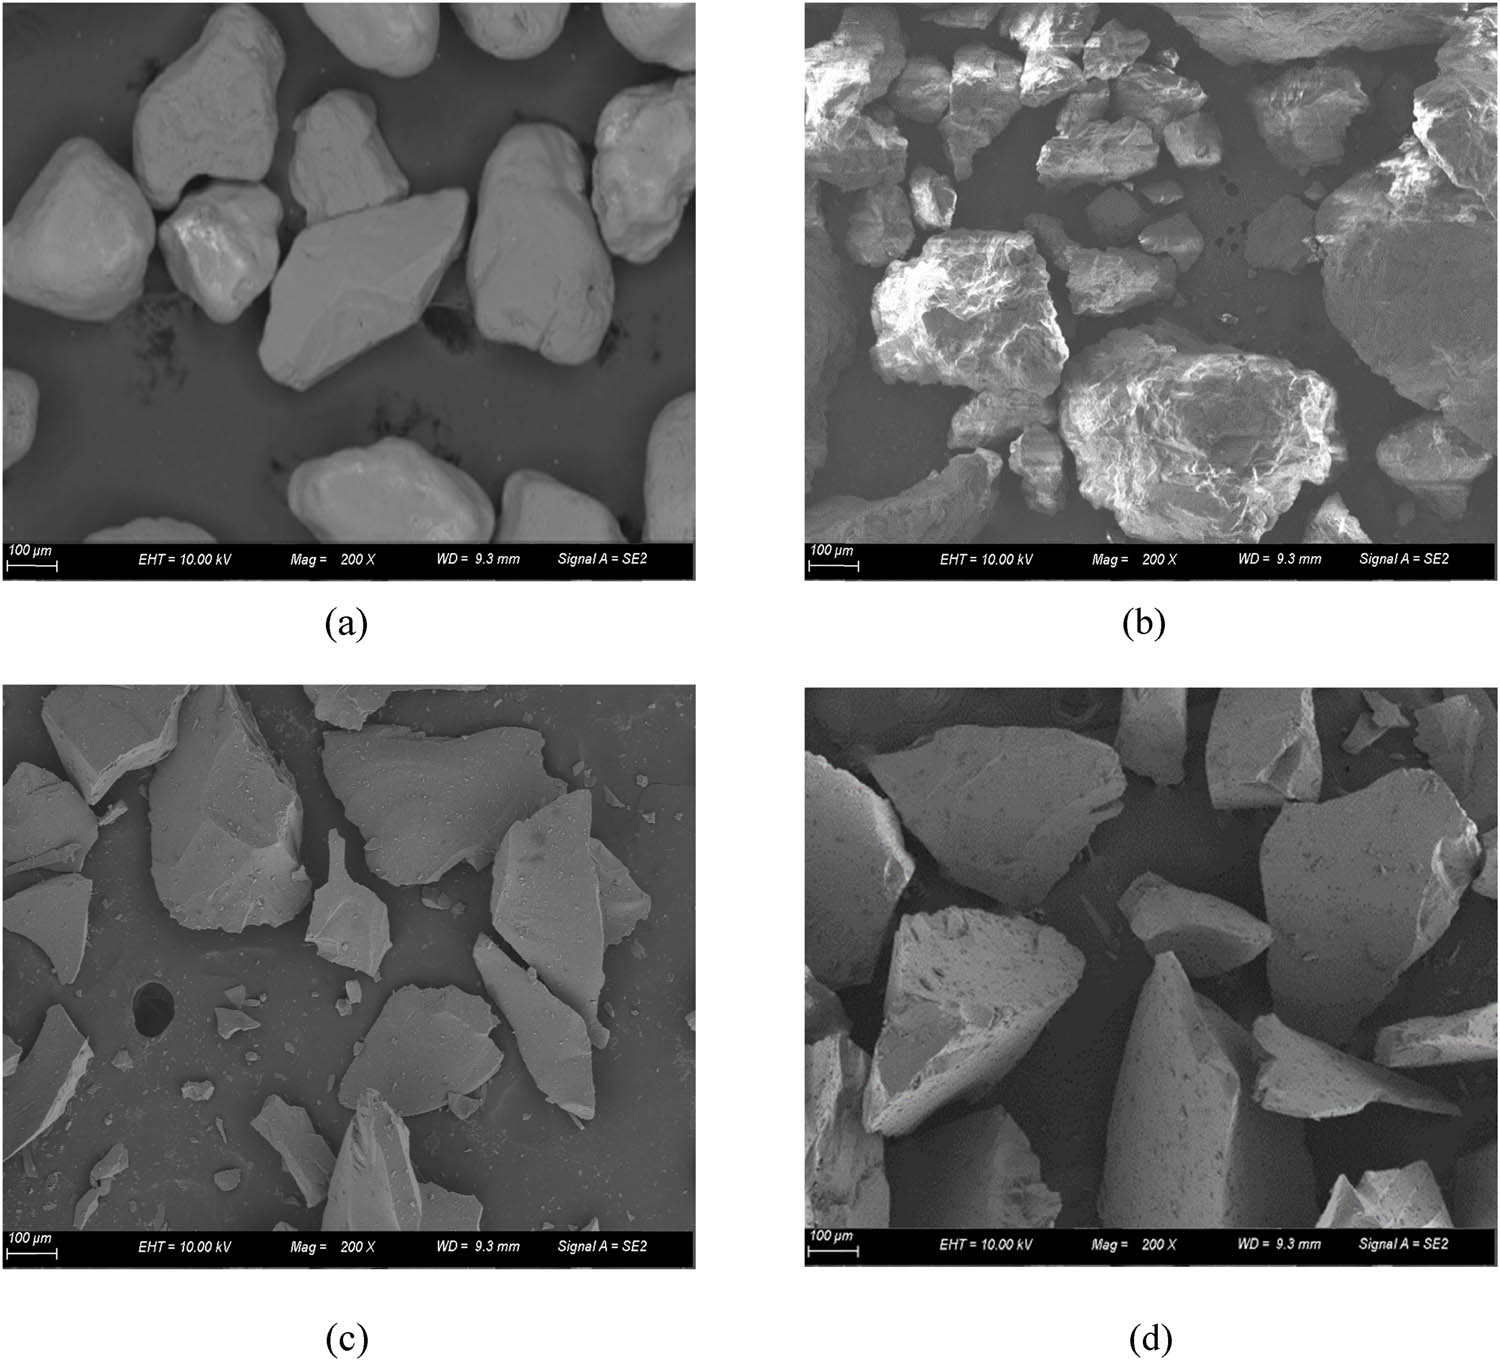
Figure 4
SEM Image of fine aggregate. (a) RS, (b) MS, (c) GG, and (d) TG.
Source: Author’s contribution.
Table 5
The performance index of waste glass.
| Aggregates | The specific gravity (SSD) | The water absorption (%) | Fineness modulus (F.M.) | Crush index (%) |
|---|---|---|---|---|
| River sand (RS) | 1.7 | 1.5 | 2.5 | 11.8 |
| Manufactured sand (MS) | 1.5 | 1.8 | 2.6 | 5.4 |
| Green glass (GG) | 1.2 | 0.2 | 2.3 | 17.6 |
| TFT glass (TG) | 1.3 | 0.1 | 2.4 | 18.3 |
Source: Author’s contribution.
Table 6
Particle size distributions of fine aggregates.
| Sieve size (mm) | 2.36 | 1.18 | 0.60 | 0.30 | 0.15 | 0.075 |
|---|---|---|---|---|---|---|
| RS (%) | 0.0 | 33.0 | 54.7 | 80.2 | 95.4 | 99.0 |
| MS (%) | 0.0 | 35.0 | 46.6 | 87.6 | 98.3 | 99.6 |
| GG (%) | 0.0 | 25.1 | 49.1 | 80.5 | 81.8 | 98.4 |
| TG (%) | 0.0 | 31.5 | 50.3 | 75.0 | 91.6 | 98.2 |
Source: Author’s contribution.
Table 7
Chemical compositions of fine aggregates (wt%)
| Component | Al2O3 | SiO2 | Fe2O3 | MgO | K2O | CaO | Na2O | BaO | SrO | Cr2O3 | Other | Loss |
|---|---|---|---|---|---|---|---|---|---|---|---|---|
| RS | 6.4 | 84.3 | 1.8 | 0.4 | 0.3 | 3.1 | — | — | — | — | 3.5 | 0.2 |
| MS | 14.3 | 46.7 | 17.9 | 4.0 | 1.6 | 8.7 | 3.1 | — | — | — | 3.3 | 0.3 |
| GG | 3.0 | 66.6 | 2.3 | 1.8 | 0.9 | 10.6 | 12.6 | — | — | 0.5 | 1.2 | 0.5 |
| TG | 2.5 | 56.2 | 1.4 | 0.2 | 7.3 | 0.8 | 7.7 | 10.6 | 11.1 | — | 2.0 | 0.2 |
Source: Author’s contribution.
Table 8
Mixture proportions of concretes (kg/m3)
| Mix no. | Cement | River sand | Manufactured sand | Green glass | TFT glass | Gravel | Water |
|---|---|---|---|---|---|---|---|
| RS | 413 | 658 | — | — | — | 1,209 | 178 |
| MS | 413 | — | 658 | — | — | 1,209 | 178 |
| GG20 | 413 | — | 526 | 132 | — | 1,209 | 178 |
| TG20 | 413 | — | 526 | — | 132 | 1,209 | 178 |
Source: Author’s contribution.
Table 9
Test items and referenced standards
| Test method | Specimen dimensions (mm) and types | Referenced standards |
|---|---|---|
| Methylene blue test | Fine aggregates | ASTM C 144-03 [33] |
| Slump test | Concrete mixture | GB/T 50080-2016 [34] |
| Flexural strength test | 150 × 150 × 550 (concrete) | GB/T 50081-2019 [28] |
| Compressive strength test | 150 × 150 × 150 (concrete) | GB/T 50081-2019 [28] |
| Dry shrinkage test | 100 × 100 × 515 (concrete) | GB/T 50082-2009 [29] |
| Impermeability test | The upper diameter is 175 mm, the lower diameter is 185 mm, and the height is 150 mm (concrete) | GB/T 50082-2009 [29] |
| Sulfate resistance test | 100 × 100 × 100 (concrete) | GB/T 50082-2009 [29] |
| Alkali aggregate reaction | 25 × 25 × 280 (mortar) | JGJ 52-2006 [31] |
| Absorption test | 100 × 100 × 100 (concrete) | GB/T 50081-2019 [28] |
| Surface resistivity test | 150 × 150 × 150 (concrete) | ASTM D257-14 [30] |
| MIP | 10 × 10 × 10 (paste) | ASTM D4404-10 [35] |
| SEM | <10 mm fragments (paste) | ASTM C1723-10 [36] |
Source: Author’s contribution.
Table 10
Stone powder content of mixed sand
| Mix no. | MB | Stone powder (%) |
|---|---|---|
| RS | 0.2 | 1.02 |
| MS | 1.3 | 2.20 |
| GG20 | 1.0 | 1.61 |
| TG20 | 0.9 | 1.53 |
Source: Author’s contribution.
Table 11
Slump of concrete
| Mix no. | Slump (mm) | Cohesion | Water retention |
|---|---|---|---|
| RS | 83 | Good | None |
| MS | 58 | Good | None |
| GG20 | 64 | Good | None |
| TG20 | 71 | Good | None |
Source: Author’s contribution.
Table 12
Mechanical properties of concrete (average value ± standard deviation)
| Mix no. | Compressive strength (MPa) | Flexural strength (MPa) | ||||
|---|---|---|---|---|---|---|
| 3 days | 14 days | 28 days | 3 days | 14 days | 28 days | |
| RS | 29.4 ± 1.0 | 40.2 ± 1.1 | 46.3 ± 0.9 | 3.6 ± 0.3 | 4.3 ± 0.3 | 4.9 ± 0.4 |
| MS | 30.2 ± 1.4 | 42.4 ± 0.8 | 48.4 ± 0.6 | 3.9 ± 0.3 | 5.1 ± 0.5 | 5.6 ± 0.4 |
| GG20 | 32.1 ± 1.1 | 46.1 ± 1.0 | 51.8 ± 0.8 | 4.3 ± 0.4 | 5.5 ± 0.2 | 6.1 ± 0.3 |
| TG20 | 30.8 ± 1.5 | 45.3 ± 1.2 | 50.1 ± 1.1 | 4.1 ± 0.2 | 5.2 ± 0.3 | 5.9 ± 0.4 |
Source: Author’s contribution.
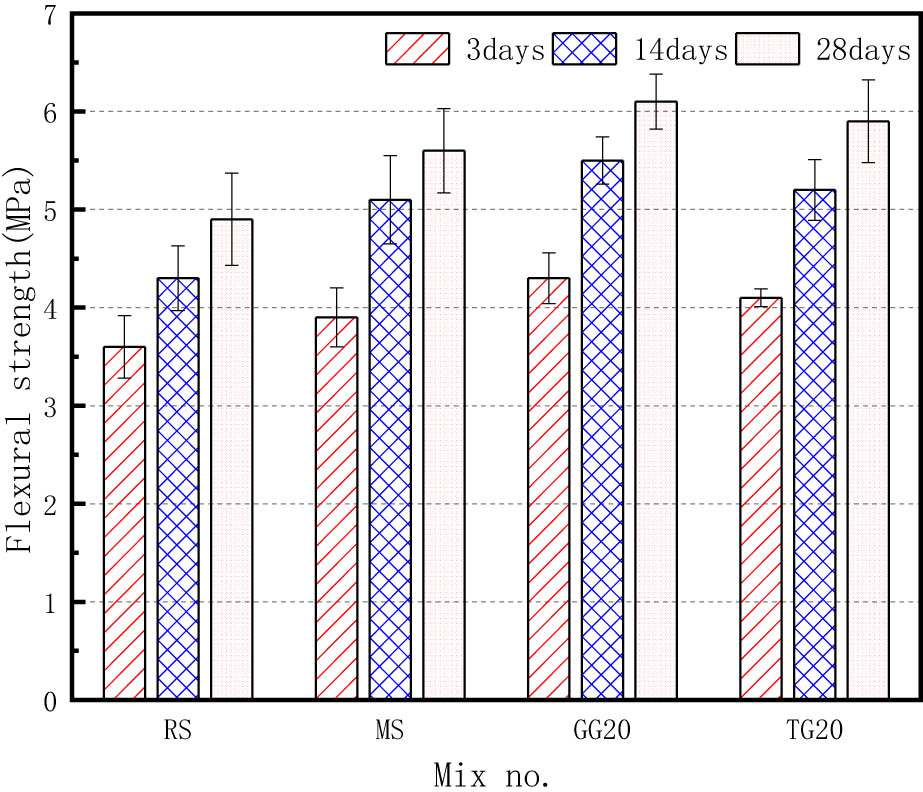
Figure 5
Flexural strength of concrete.
Source: Author’s contribution.
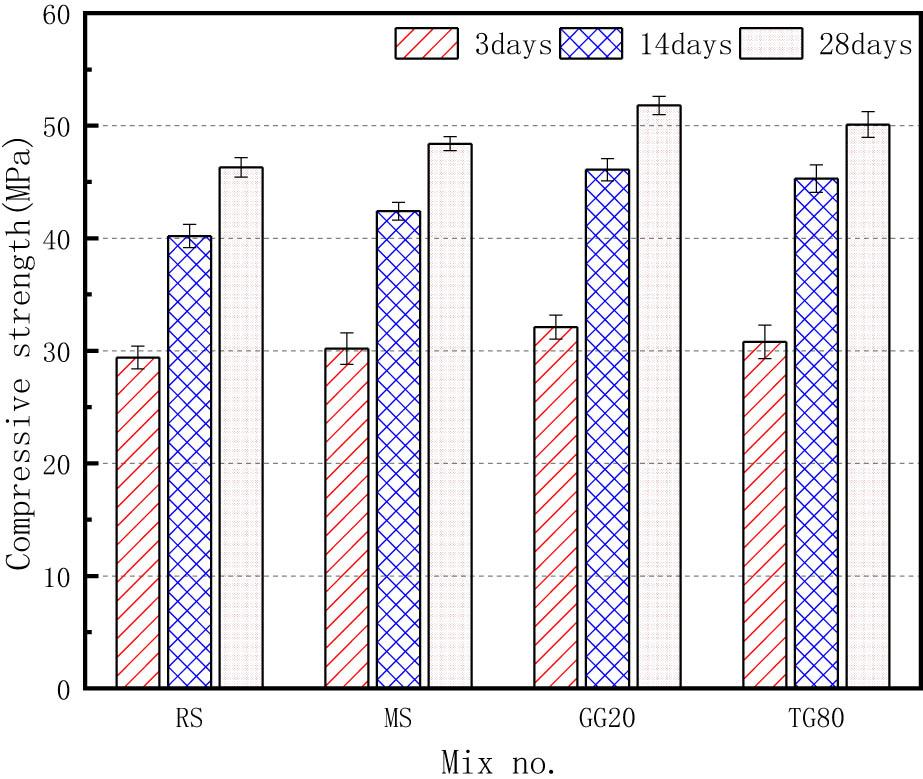
Figure 6
Compressive strength of concrete.
Source: Author’s contribution.
Table 13
Concrete pore size distribution at 28 days
| Mix no. | Porosity (%) | Average pore diameter (nm) (%) | Probable pore diameter (nm) | Pore size distribution (%) | |||
|---|---|---|---|---|---|---|---|
| <20 nm | 20–50 nm | 50–200 nm | >200 nm | ||||
| RS | 11.02 | 37.02 | 40.26 | 20.01 | 21.23 | 27.12 | 31.64 |
| MS | 15.51 | 40.12 | 40.27 | 22.72 | 22.58 | 26.21 | 28.49 |
| GG20 | 12.43 | 27.84 | 32.40 | 28.22 | 23.32 | 25.86 | 22.60 |
| TG20 | 12.09 | 30.21 | 38.26 | 24.24 | 22.86 | 25.91 | 26.99 |
Source: Author’s contribution.
Table 14
Impermeability of concrete
| Mix no. | Impermeability grade | Penetration height (mm) |
|---|---|---|
| RS | P12 | 67 |
| MS | P12 | 96 |
| GG20 | P12 | 83 |
| TG20 | P12 | 74 |
Source: Author’s contribution.
Table 15
Sulfate resistance of concrete (after 15 wet-dry cycles)
| Mix no. | Compressive strength (MPa) | Sulfate resistance coefficient (%) | |
|---|---|---|---|
| Control specimen | Sulfate wetting-drying cycle | ||
| RS | 42.6 | 47.0 | 90.5 |
| MS | 45.1 | 52.4 | 86.0 |
| GG20 | 50.3 | 57.2 | 87.9 |
| TG20 | 47.1 | 53.1 | 88.6 |
Source: Author’s contribution.
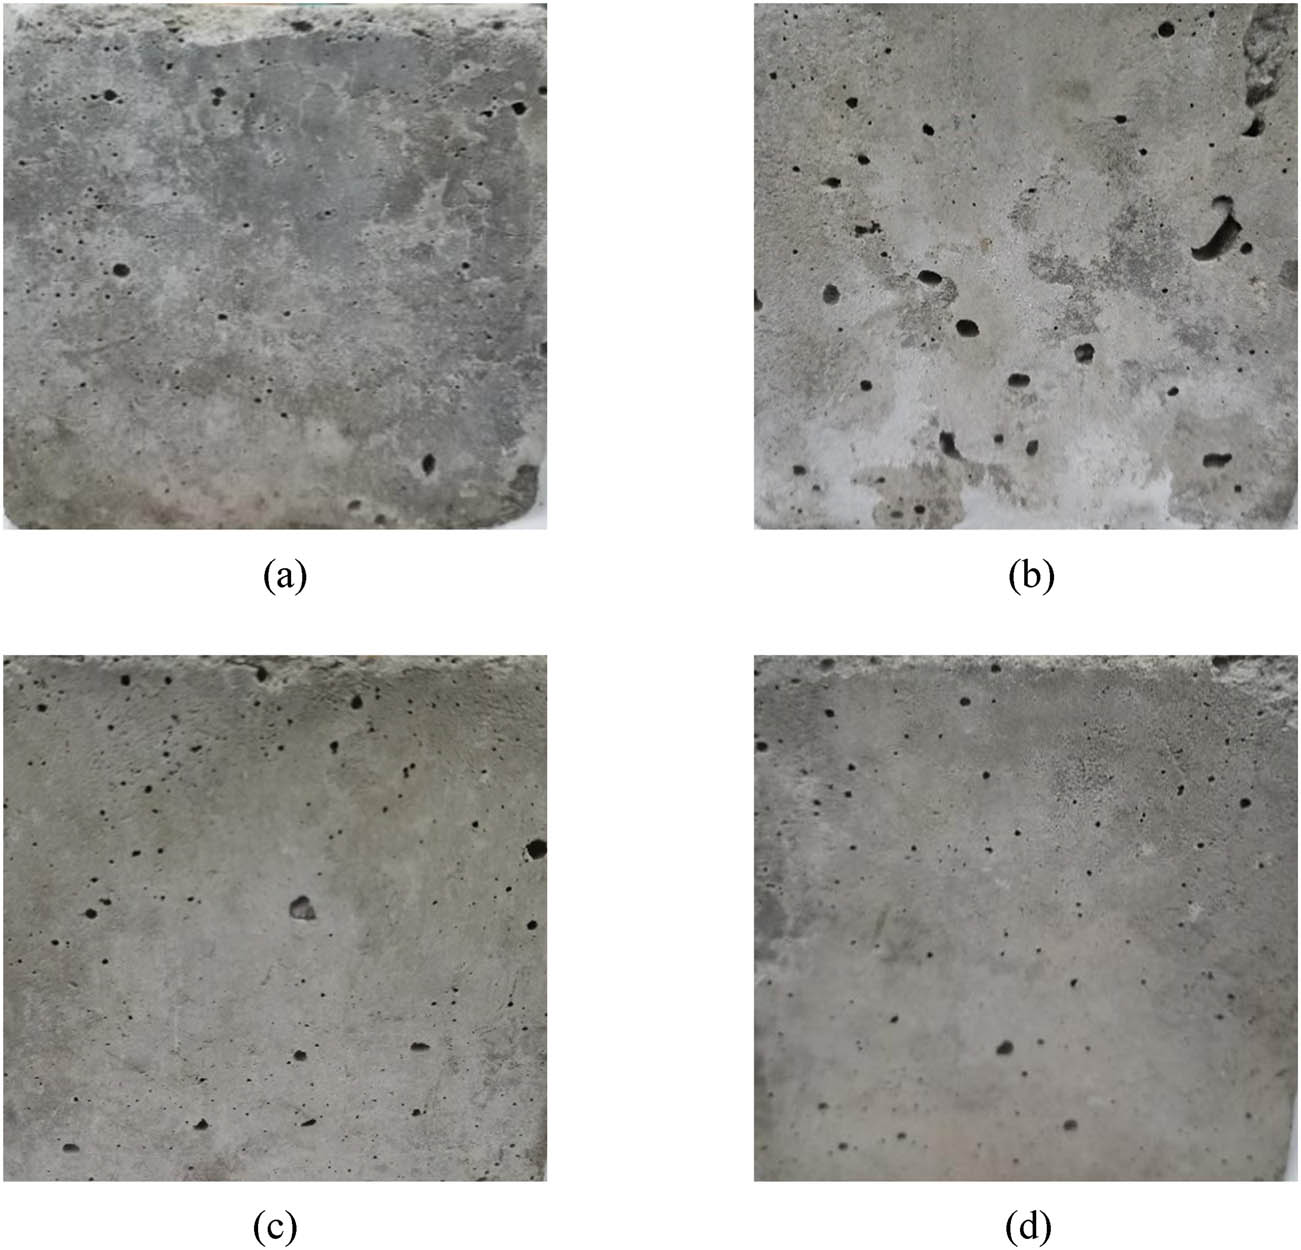
Figure 7
Appearance of the specimen after sulfate attack. (a) RS, (b) MS, (c) GG20, and (d) TG20.
Source: Author’s contribution.
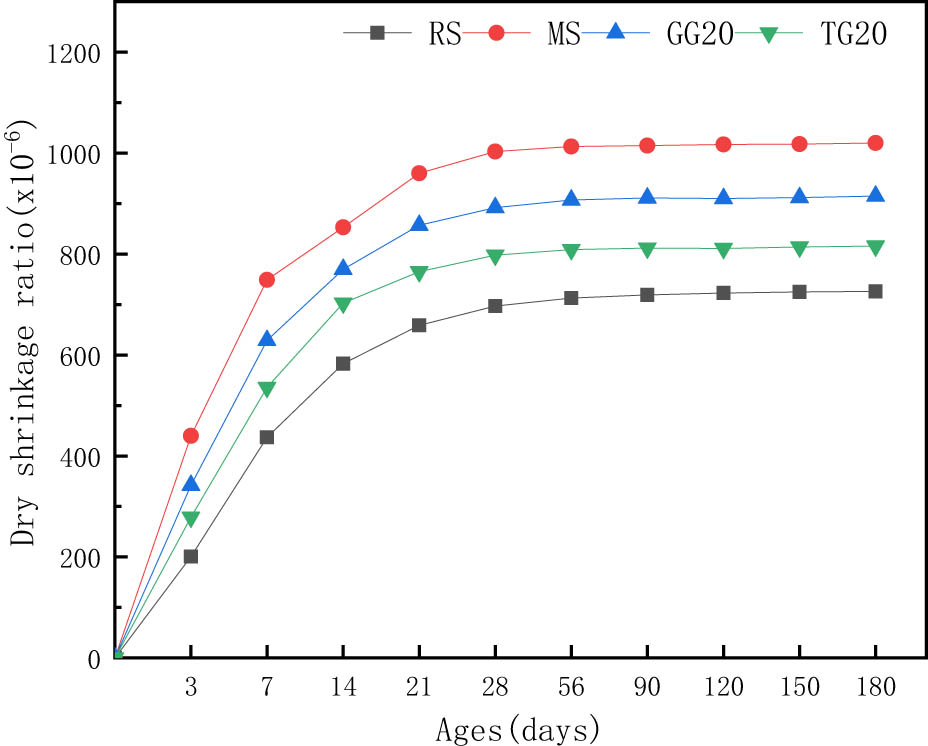
Figure 8
Drying shrinkage of concrete up to 180 days.
Source: Author’s contribution.
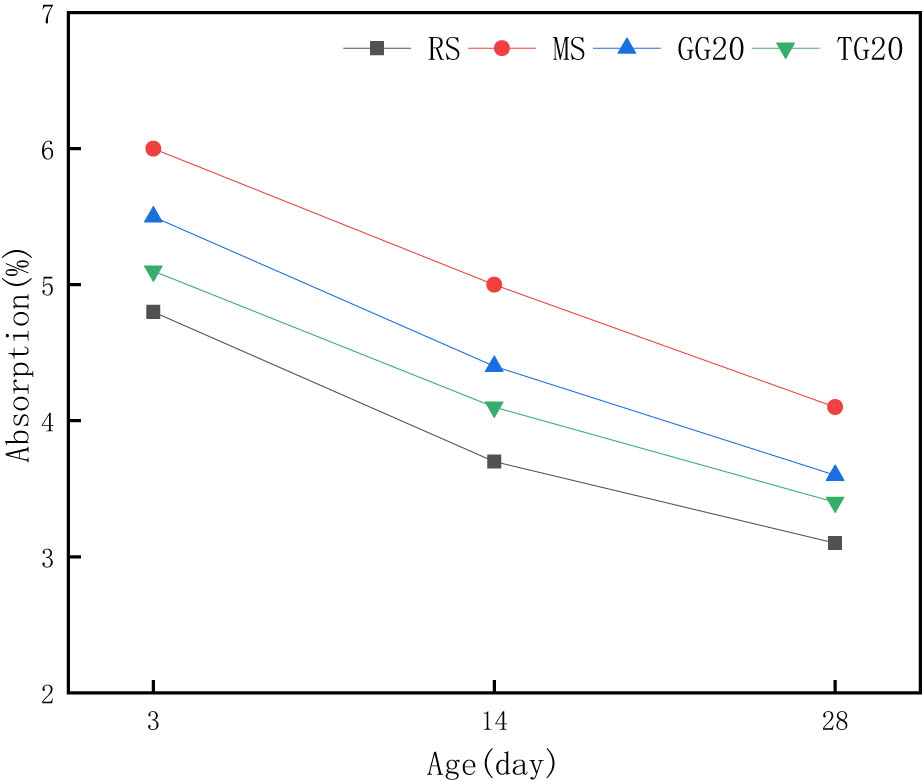
Figure 9
Different kinds of concrete water absorption.
Source: Author’s contribution.
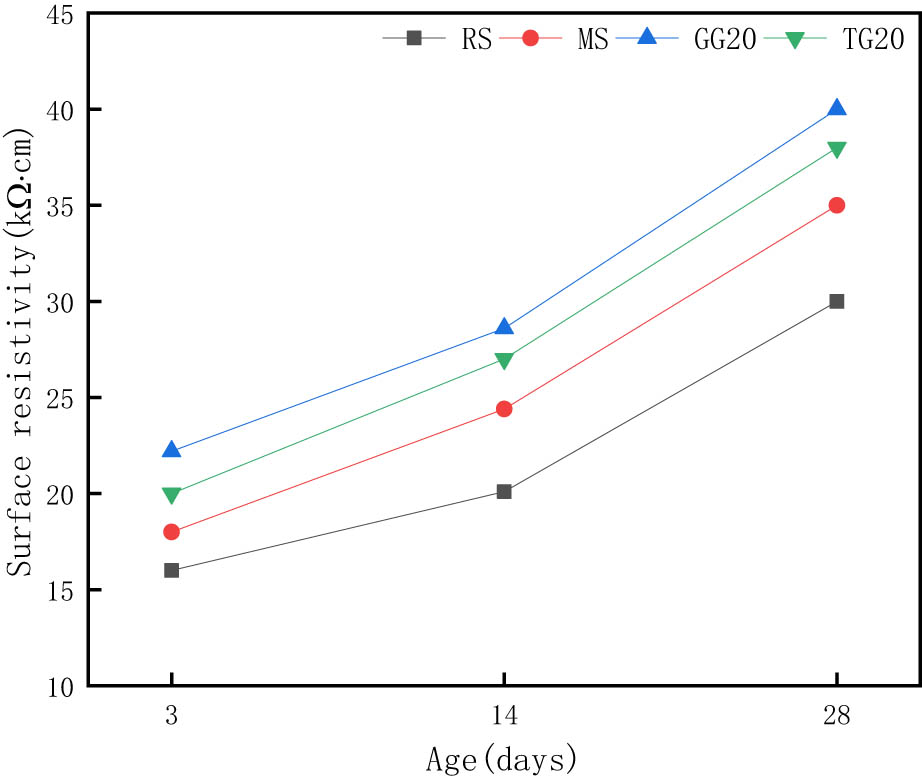
Figure 10
Different kinds of concrete resistivity.
Source: Author’s contribution.
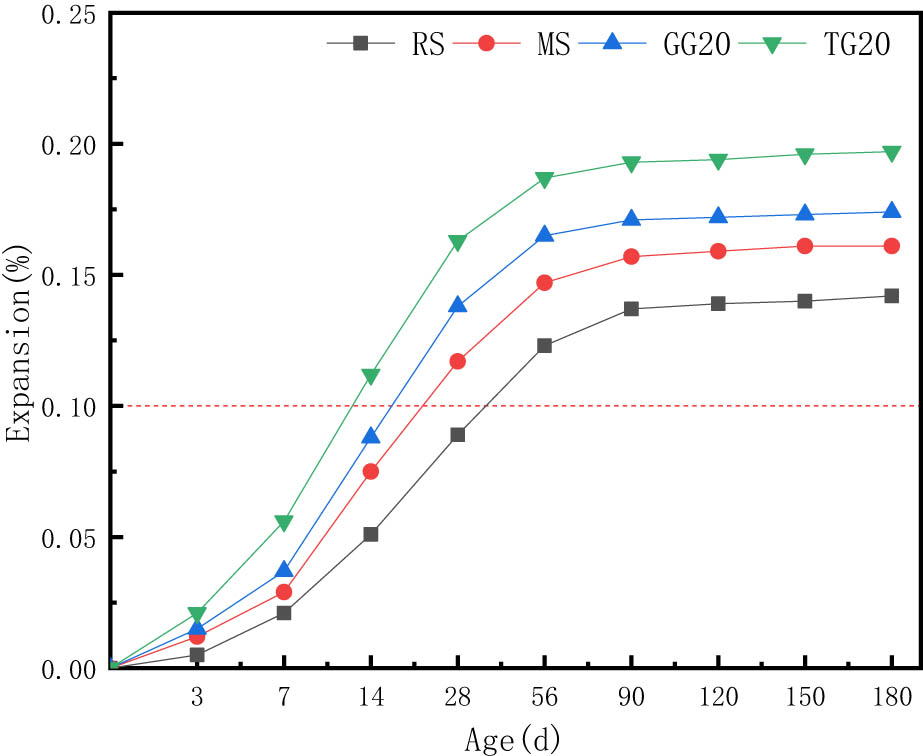
Figure 11
Slurry rod expansion rate vs age curve.
Source: Author’s contribution.
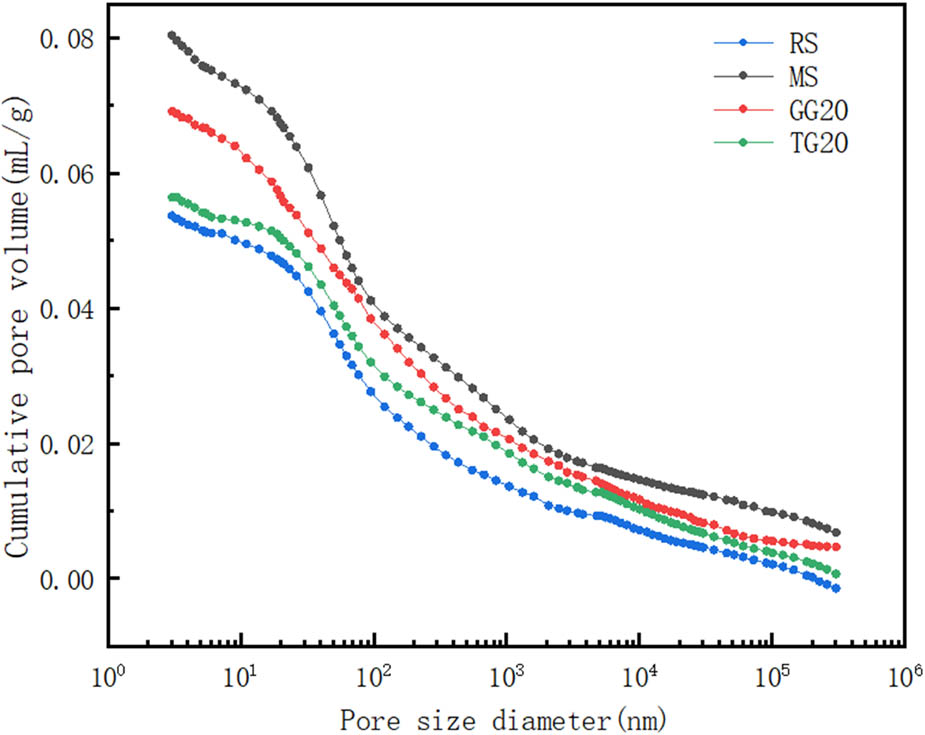
Figure 12
Integral curves for the distribution of pore sizes in different concrete.
Source: Author’s contribution.
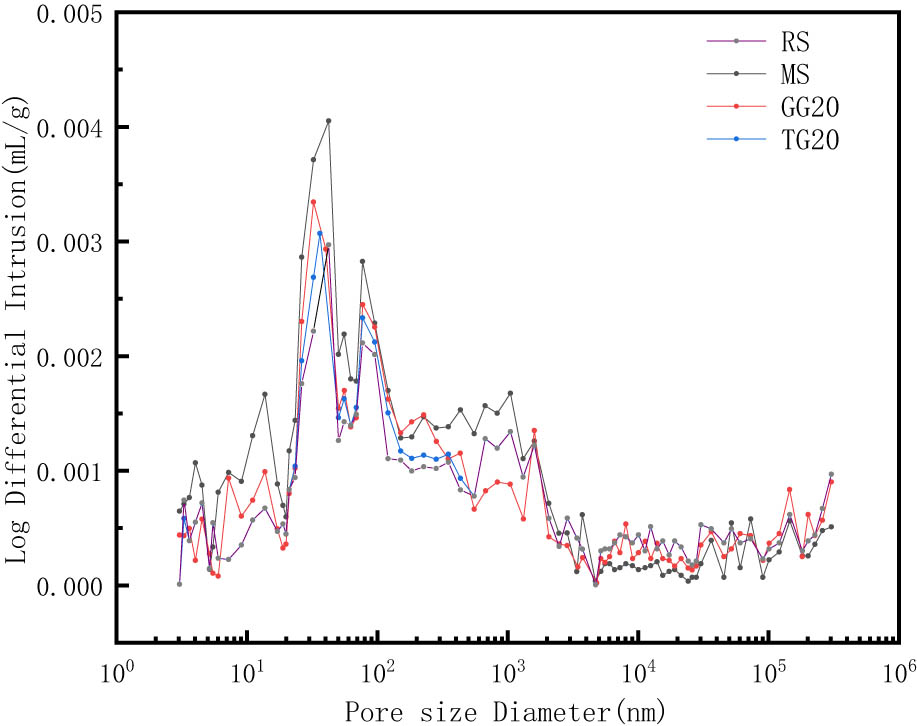
Figure 13
Differential curve of pore size distribution of different concrete.
Source: Author’s contribution.
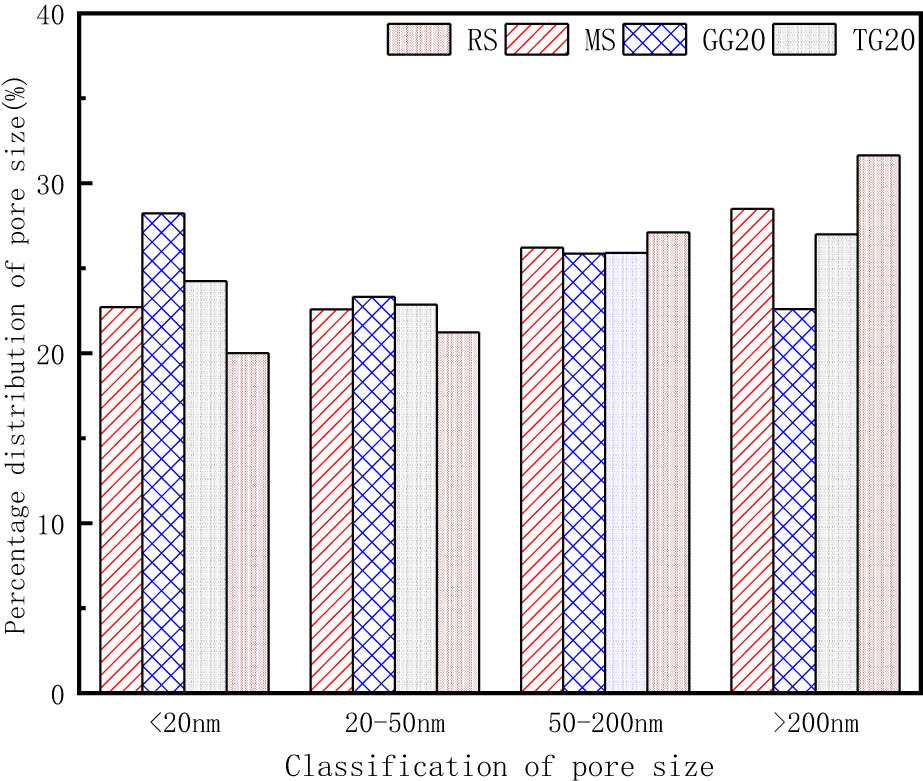
Figure 14
Pore size distribution of different concrete specimens.
Source: Author’s contribution.
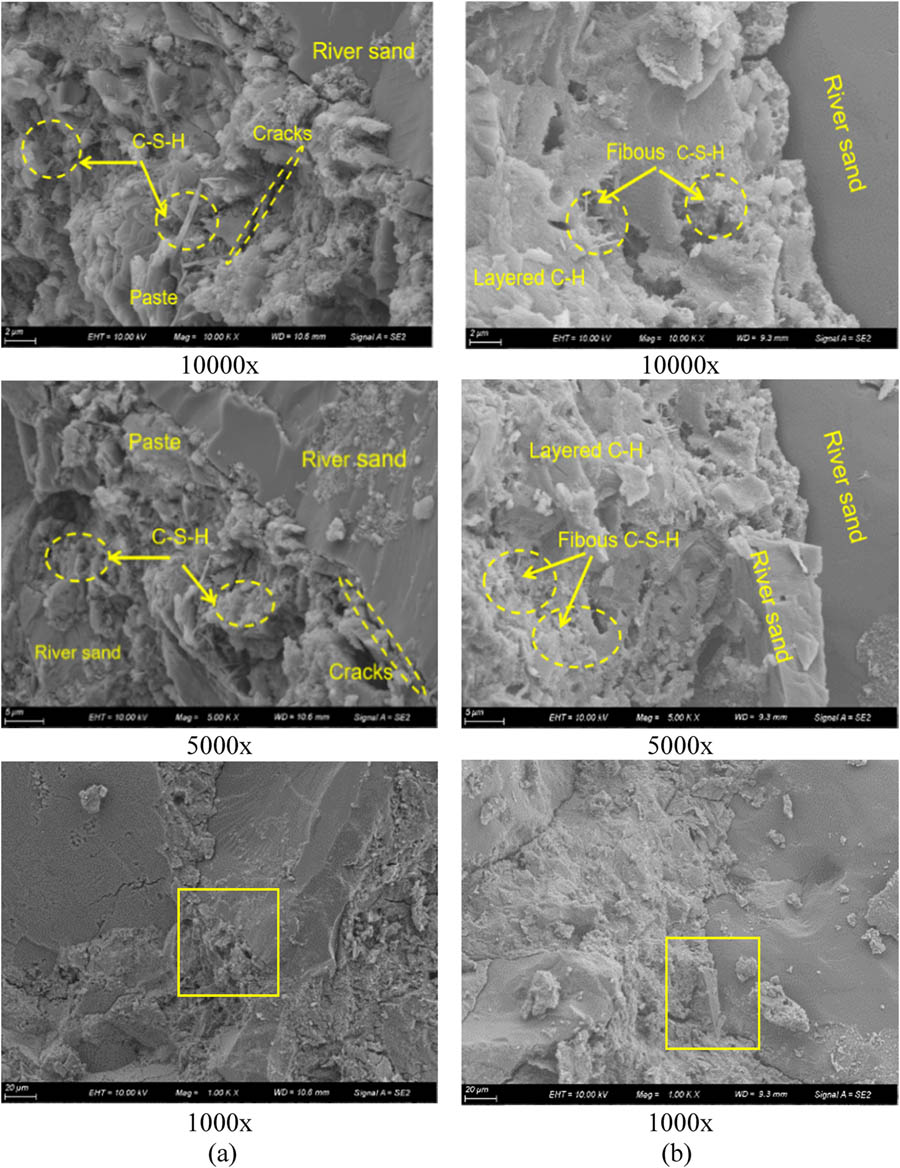
Figure 15
SEM images of RS at (a) 3 days and (b) 28 days.
Source: Author’s contribution.
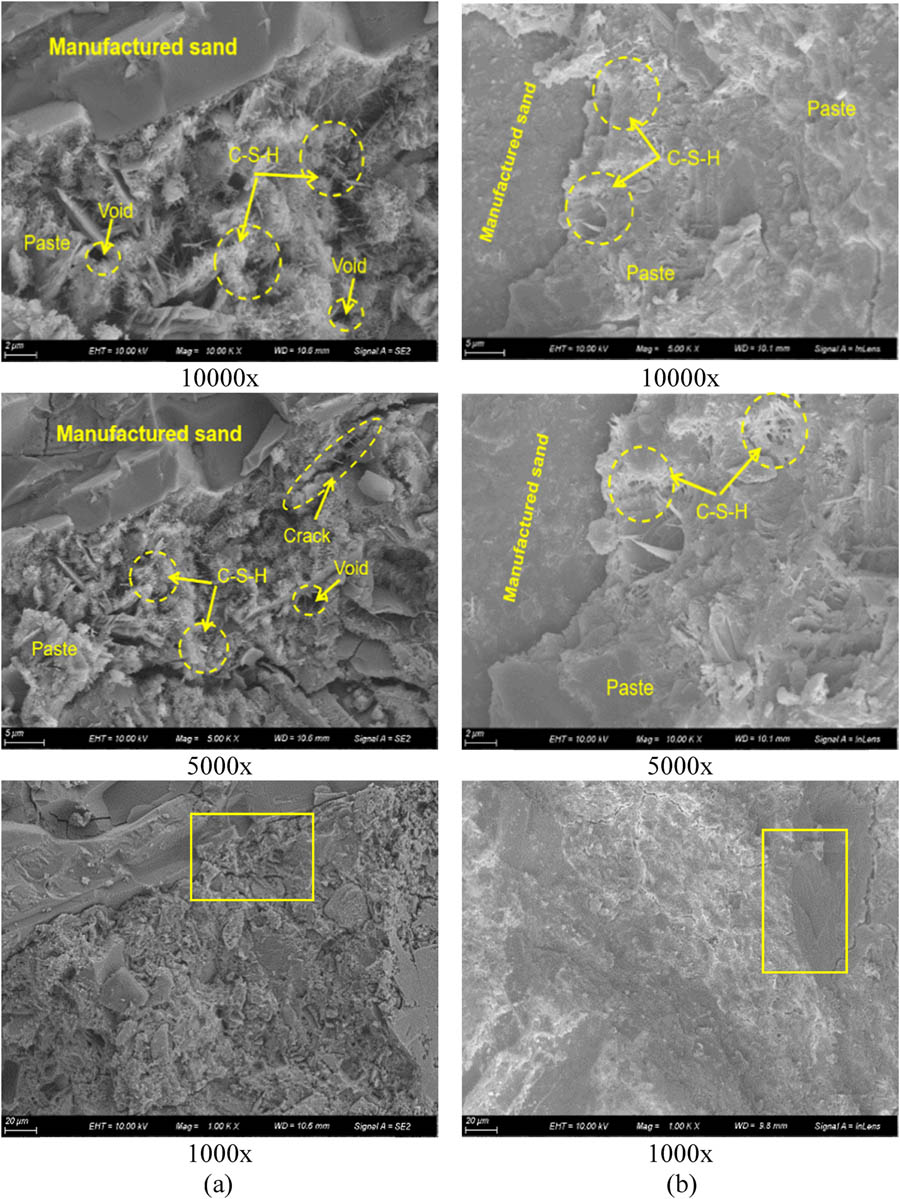
Figure 16
SEM images of MS at (a) 3 days and (b) 28 days.
Source: Author’s contribution.
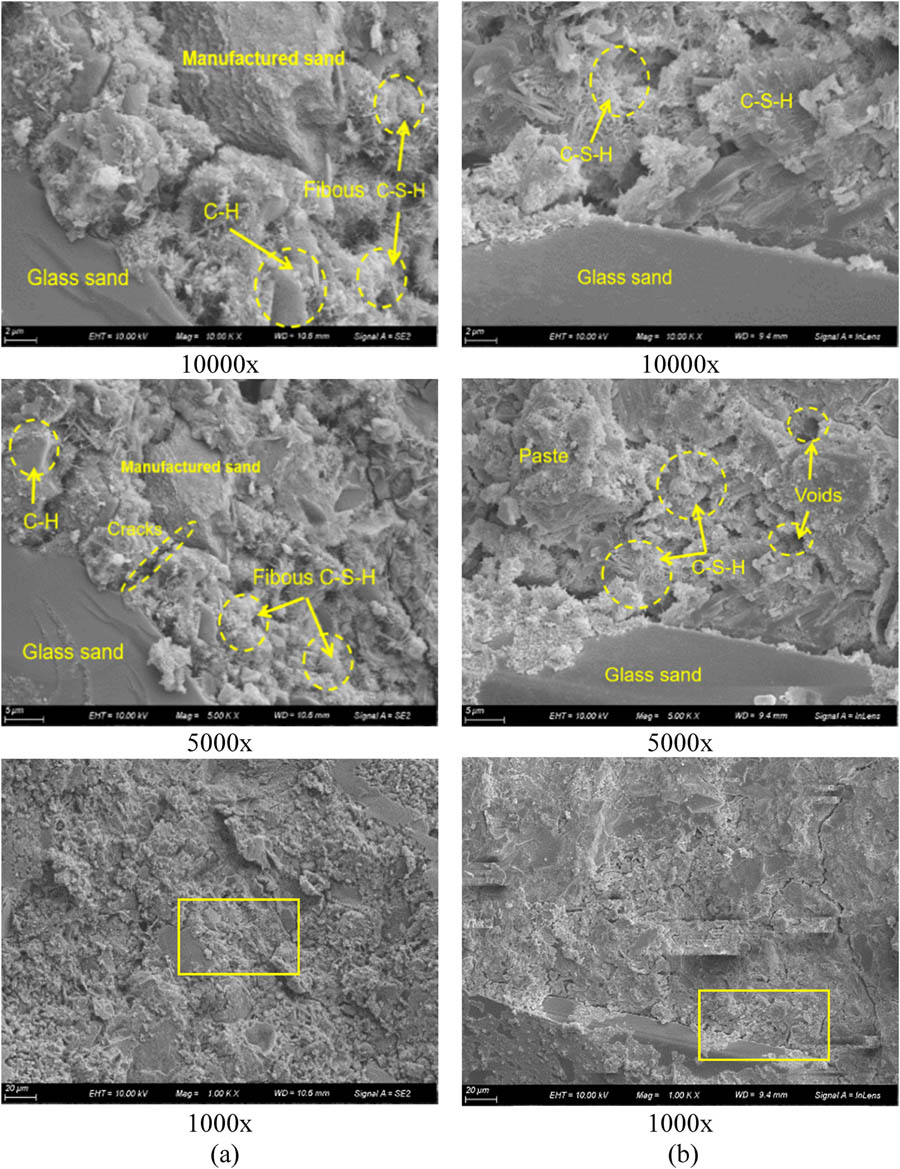
Figure 17
SEM images of GG20 at (a) 3 days and (b) 28 days.
Source: Author’s contribution.
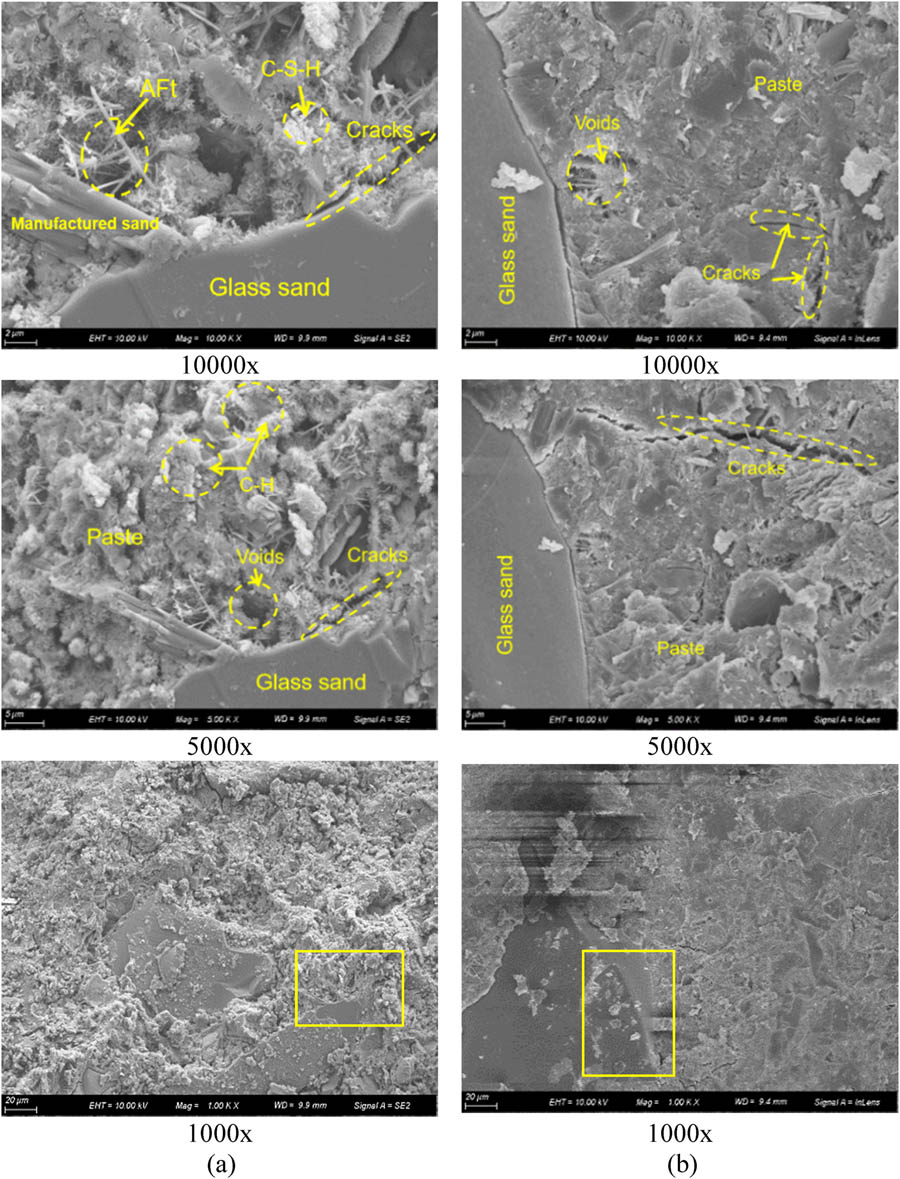
Figure 18
SEM images of TG20 at (a) 3 days and (b) 28 days.
Source: Author’s contribution.