
Nomenclature and abbreviations
| Symbol/Abbreviation | Definition | Unit |
|---|---|---|
| ASR | Alkali–silica reaction | — |
| C–S–H | Calcium silicate hydrate | — |
| GG | Green Glass | — |
| ITZ | Interfacial transition zone | — |
| K f | Sulfate resistance coefficient | % |
| LCD | Liquid crystal display | — |
| MIP | Mercury intrusion porosimetry | — |
| MS | Manufactured sand | — |
| RS | River sand | — |
| SEM | Scanning electron microscopy | — |
| SSD | Saturated surface dry | — |
| TG | LCD Glass | — |
| ρ | Electrical resistivity | kΩ cm |
| ф | Porosity | % |
1. Introduction
1.1. The global aggregate crisis and ecological implications
Concrete is the primary material for global infrastructure, but its massive consumption has triggered a shortage of natural river sand. Yang [1] investigated the quality improvement methods for sand used in the construction industry to ensure structural safety. A UNEP report [2] highlighted the need for new solutions to global sand resource governance to prevent ecological collapse. Huang [3] analyzed the application status of building aggregates and emphasized the importance of utilizing mineral sand. Furthermore, Gavrilets [4] detailed the biodiversity loss and riverbed degradation caused by the global sand crisis. Ren [5] proposed countermeasures to develop alternative minerals to address construction shortages. These factors have forced the industry toward manufactured sand (MS). However, MS often has a high stone powder content and angular shapes, which hinder workability, as noted by Son et al. [6] and Min [7] in their respective studies on aggregate morphology.
1.2. Evolution of waste glass in cementitious systems
Disposal of waste glass presents significant environmental challenges as it is non-biodegradable. Meyer [8] proposed greening the concrete industry by reusing industrial waste to reduce carbon footprints. Tamanna et al. [9] examined the performance of recycled waste glass sand as a partial replacement for natural aggregates, demonstrating its potential for resource conservation. Rana et al. [10] explored the effect of waste glass on the properties of recycled brick aggregate concrete, while Kou and Poon [11] investigated the filling capacity of self-compacting concrete using recycled glass. Additionally, Bohn et al. [12] developed novel methods for producing ceramic pavers from waste glass, demonstrating the method’s versatility.
Finely ground glass serves as a pozzolanic material. Song et al. [13] emphasized the synergistic effect of glass powder and recycled aggregates in optimizing concrete microstructure. Bhat and Rao [14] found that using glass powder as a partial replacement for cement effectively improves concrete compressive strength. The pozzolanic activity in glass was further studied by Li et al. [15], who examined its role in blended cement mortar, and Shayan and Xu [16], who observed that amorphous silica reacts with Ca(OH)2 to form secondary C–S–H gels. Shi et al. [17] detailed the characteristics of this reactivity across different glass types, while Soldado et al. [18] highlighted the importance of mixture compactness in low-carbon concrete. Specialty glass types, such as CRT glass explored by Ling and Poon [19], and various recycled types reviewed by Ahmed and Rana [20], exhibit varied hydration kinetics. However, alkali–silica reaction (ASR) remains a concern. Chen et al. [21] noted the mitigation of ASR for tunnel waste rock, and Du and Tan [22] provided methods for ASR inhibition in mortar. Zhao et al. [23] discussed the impact of contaminated glass in UHPC, while Saccani and Bignozzi [24] analyzed the expansion behavior of recycled fine aggregates in high-alkali environments.
1.3. Innovation and objectives of this study
While many studies focus on common bottle glass, the interaction between specialized LCD glass and manufactured sand remains underexplored. This study aims to evaluate glass sand as a “micro-structure modifier” specifically for basalt-based MS systems. By employing mercury intrusion porosimetry (MIP), scanning electron microscopy (SEM), and electrical resistivity, we reveal how the chemical differences between green soda-lime glass (GG) and LCD aluminosilicate glass (TG) dictate the concrete’s mechanical threshold and ion transport properties.
2. Materials and methods
2.1. Raw materials
The cementitious material used was P.O. 42.5 ordinary Portland cement. Its physical properties and chemical compositions are detailed in Tables 1 and 2. The surface morphology of typical cement particles is shown in Figure 1. Coarse aggregate (gravel) properties and gradation are listed in Tables 3 and 4. Fine aggregates included river sand (RS), manufactured sand (MS), green glass (GG), and LCD glass (TG). Their natural accumulation appearance is shown in Figure 2. The crystal structure analysis is shown in Figure 3. XRD Atlas of two types of glass sand and river sand. SEM images in Figure 4. The SEM image of fine aggregate confirms the morphology. Physical properties and chemical compositions are detailed in Table 5. The performance index of waste glass is given in Table 5. Particle size distributions of fine aggregates are given in Table 6, and Table 7 lists chemical compositions of fine aggregates (wt%).
Table 1
The physical properties of cement.
| Property | Value |
|---|---|
| Specific surface area (m3/kg) | 358 |
| Initial setting time (min) | 151 |
| Final setting time (min) | 220 |
| 28 day compressive strength (MPa) | 48.6 |
| 28 day flexural strength (MPa) | 8.5 |
Source: Author’s contribution.
Table 2
Chemical composition of cementitious materials (wt%).
| CaO | SiO2 | Al2O3 | Fe2O3 | MgO | TiO2 | SO3 | Other | Loss |
|---|---|---|---|---|---|---|---|---|
| 56.5 | 23.1 | 7.6 | 3.4 | 1.9 | 0.7 | 2.2 | 2.8 | 1.8 |
Source: Author’s contribution.
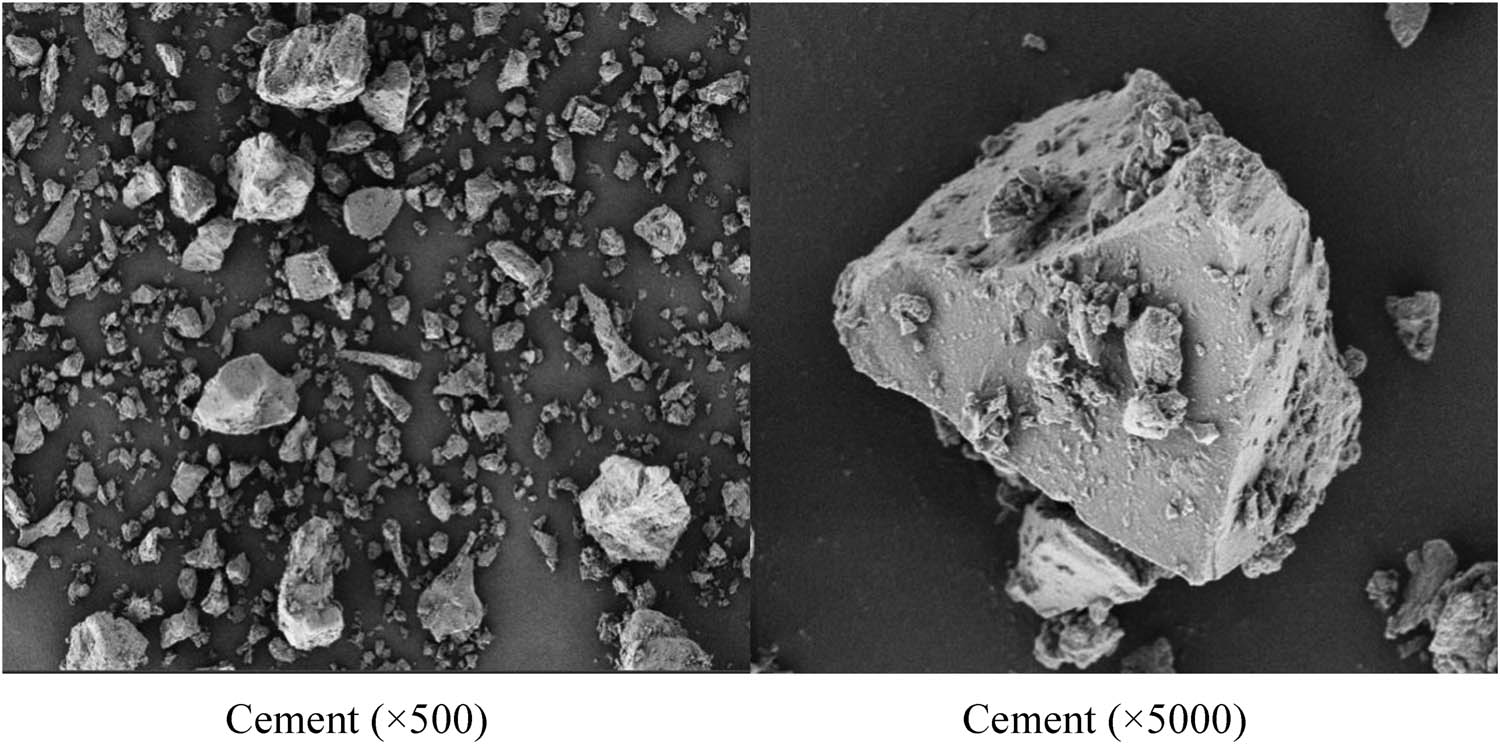
Figure 1
SEM Image of a cement particle.
Source: Author’s contribution.
Table 3
The properties of coarse aggregate.
| Project | Apparent density (kg/m3) | Bulk density (kg/m3) | Crush index (%) | Needle content (%) | Water absorption (%) |
|---|---|---|---|---|---|
| Gravel | 2,710 | 1,840 | 5.0 | 3.6 | 1.5 |
Source: Author’s contribution.
Table 4
Accumulated sieve allowance of gravel.
| Sieve size (mm) | Sieve size (mm) | |||||
|---|---|---|---|---|---|---|
| 2.5 | 5.0 | 10 | 16 | 20 | 25 | |
| Gravel (%) | 99.8 | 78.2 | 53.4 | 21.5 | 2.3 | 0 |
Source: Author’s contribution.
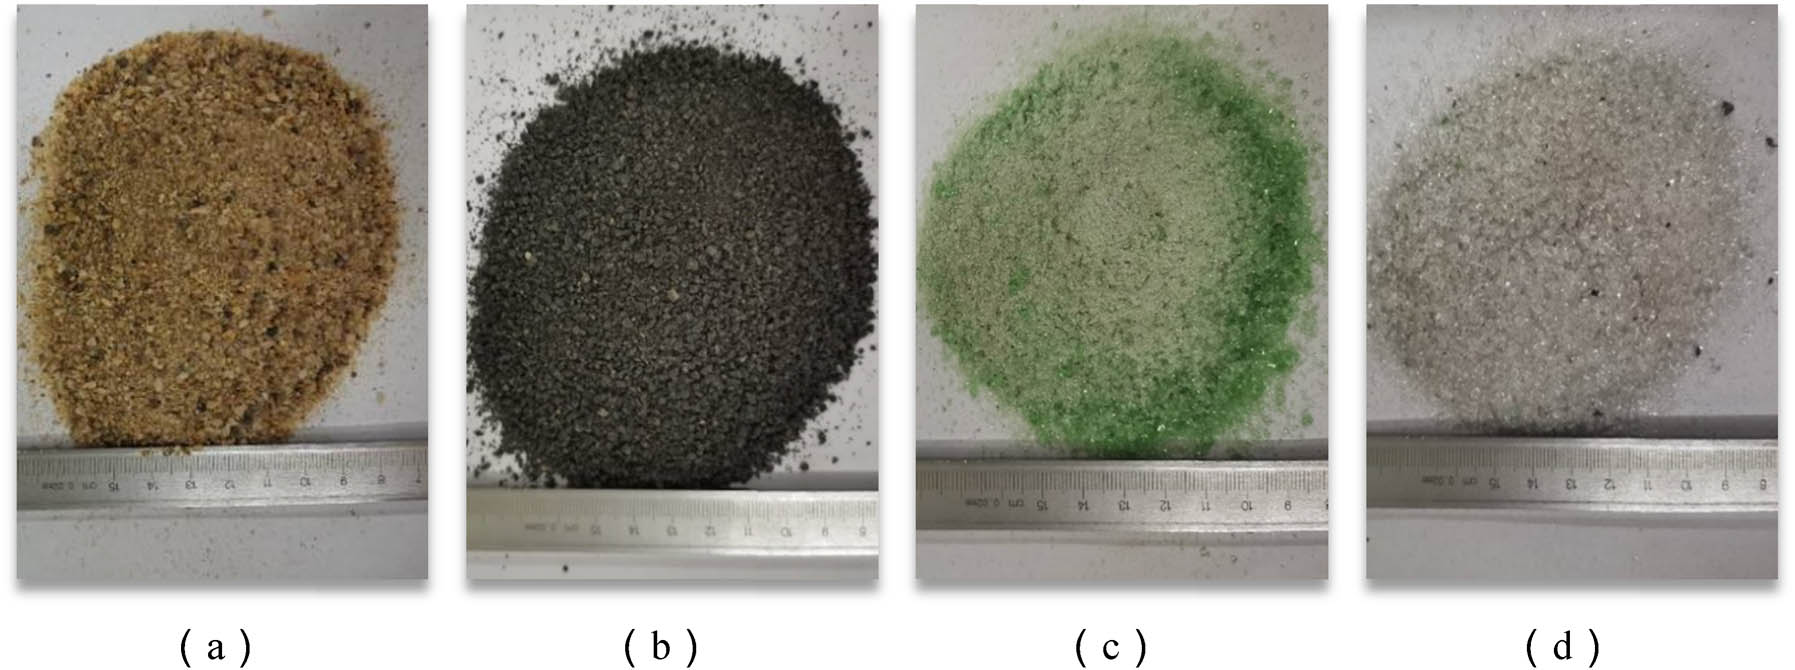
Figure 2
The natural accumulation of fine aggregates. (a) RS, (b) MS, (c) GG, and (d) TG.
Source: Author’s contribution.
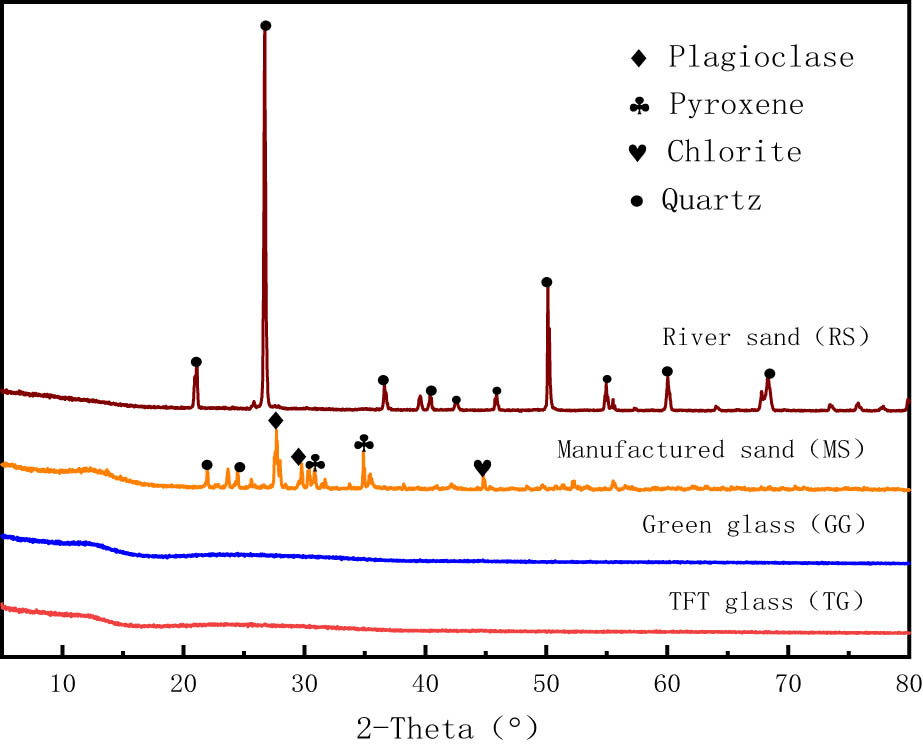
Figure 3
XRD Atlas of two types of glass sand and river sand.
Source: Author’s contribution.
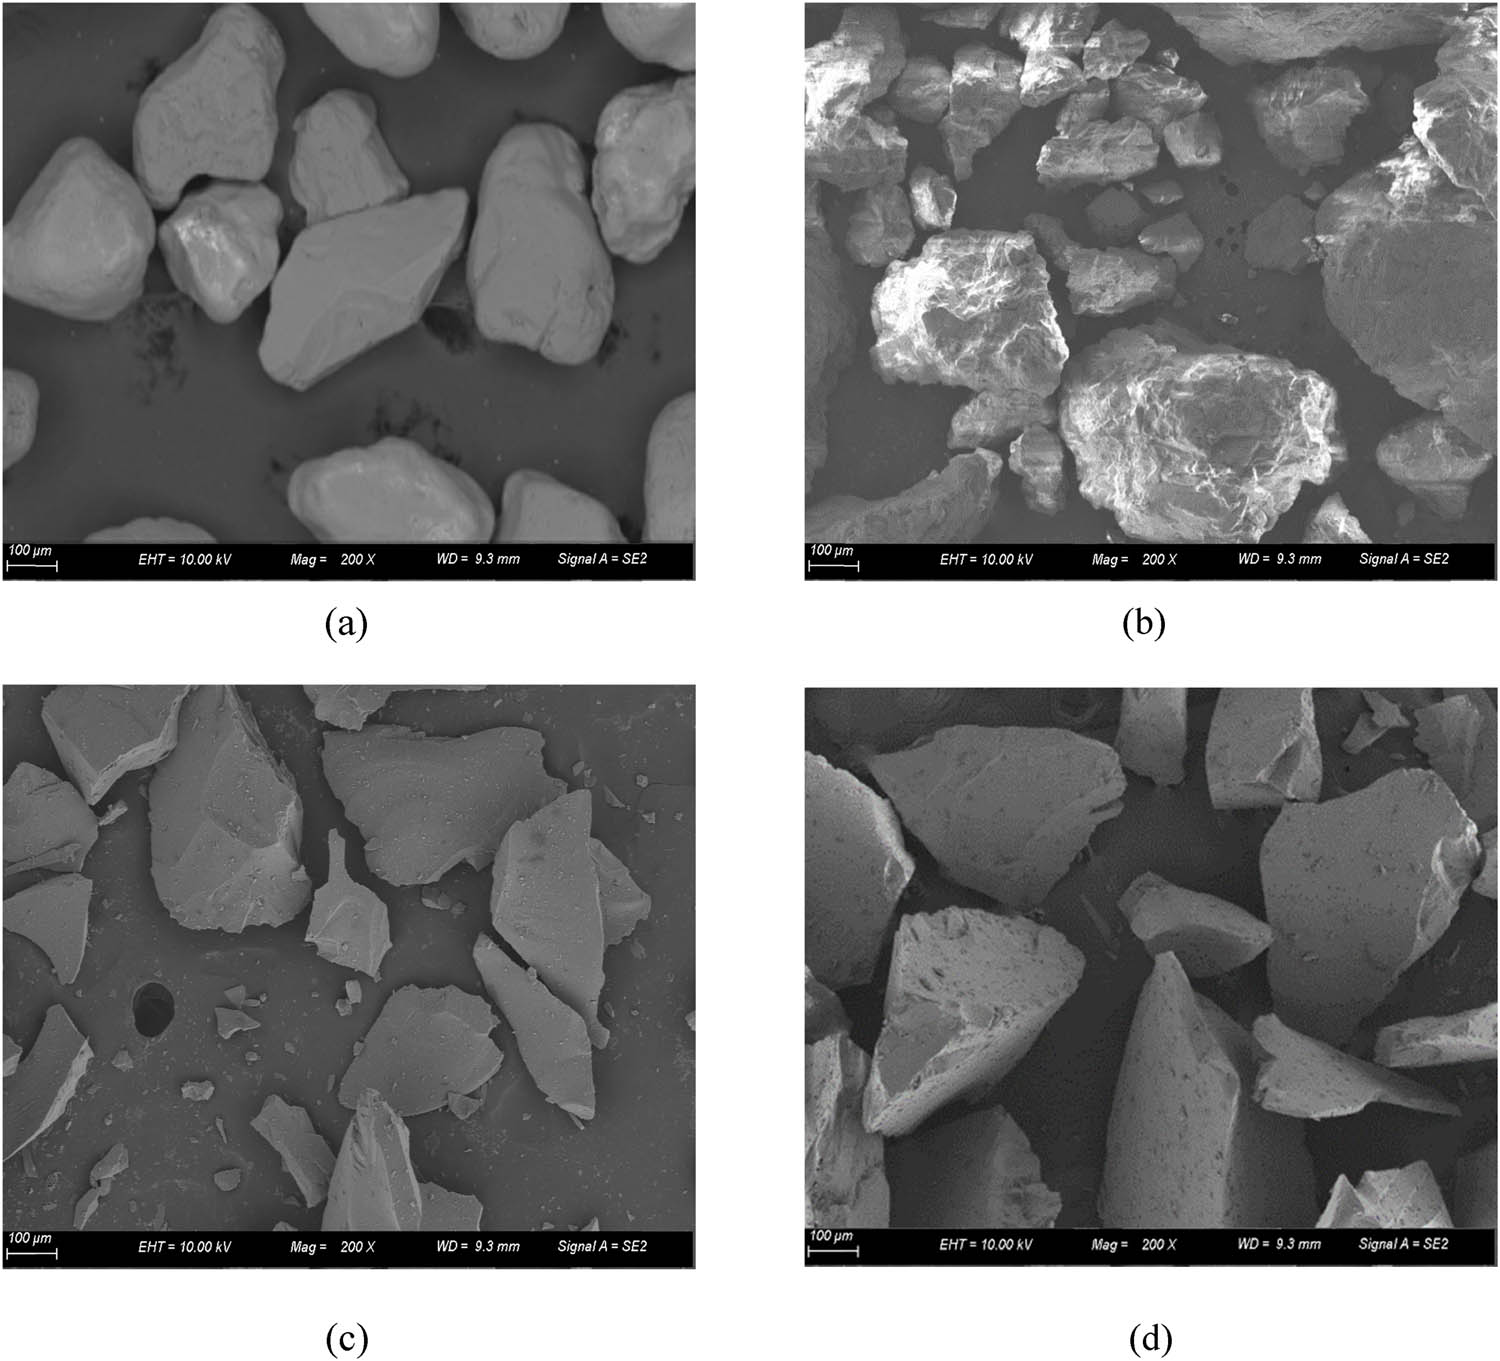
Figure 4
SEM Image of fine aggregate. (a) RS, (b) MS, (c) GG, and (d) TG.
Source: Author’s contribution.
Table 5
The performance index of waste glass.
| Aggregates | The specific gravity (SSD) | The water absorption (%) | Fineness modulus (F.M.) | Crush index (%) |
|---|---|---|---|---|
| River sand (RS) | 1.7 | 1.5 | 2.5 | 11.8 |
| Manufactured sand (MS) | 1.5 | 1.8 | 2.6 | 5.4 |
| Green glass (GG) | 1.2 | 0.2 | 2.3 | 17.6 |
| TFT glass (TG) | 1.3 | 0.1 | 2.4 | 18.3 |
Source: Author’s contribution.
2.2. Mixing procedure
To ensure uniform dispersion of glass flakes and avoid clumps of manufactured sand powder, a standardized mixing procedure was adopted:
(1) Dry Mixing (60 s): Mix coarse and fine aggregates (MS combined with GG or TG) to homogenize the granular skeleton.
(2) Adding Cement (60 s): Add cement and stir until the aggregate surfaces are uniformly coated.
(3) Wet Mixing Phase I (120 s): Slowly add 80% of the design water to initiate initial hydration and pozzolanic activity.
(4) Final Stabilization (60 s): Add the remaining 20% water and continue stirring until a uniform, cohesive consistency is achieved.
2.3. Test methods and procedures
Four mixtures followed Table 8. Mixture proportions of concretes are given in kg/m3. A 20% replacement was selected based on optimal thresholds reported by Arivalagan and Sethuraman [25], who investigated mechanical-strength improvements, and by He [26], who focused on particle packing. Tests followed standard procedures for fresh properties [27], mechanical strength [28], durability [29], and resistivity [30]. Alkali aggregate reactions were evaluated in accordance with JGJ 52 [31]. Microstructural analyses used MIP [32] and SEM [33]. Tests that followed the standards are listed in Table 9.
Table 8
Mixture proportions of concretes (kg/m3)
| Mix no. | Cement | River sand | Manufactured sand | Green glass | TFT glass | Gravel | Water |
|---|---|---|---|---|---|---|---|
| RS | 413 | 658 | — | — | — | 1,209 | 178 |
| MS | 413 | — | 658 | — | — | 1,209 | 178 |
| GG20 | 413 | — | 526 | 132 | — | 1,209 | 178 |
| TG20 | 413 | — | 526 | — | 132 | 1,209 | 178 |
Source: Author’s contribution.
Table 9
Test items and referenced standards
| Test method | Specimen dimensions (mm) and types | Referenced standards |
|---|---|---|
| Methylene blue test | Fine aggregates | ASTM C 144-03 [33] |
| Slump test | Concrete mixture | GB/T 50080-2016 [34] |
| Flexural strength test | 150 × 150 × 550 (concrete) | GB/T 50081-2019 [28] |
| Compressive strength test | 150 × 150 × 150 (concrete) | GB/T 50081-2019 [28] |
| Dry shrinkage test | 100 × 100 × 515 (concrete) | GB/T 50082-2009 [29] |
| Impermeability test | The upper diameter is 175 mm, the lower diameter is 185 mm, and the height is 150 mm (concrete) | GB/T 50082-2009 [29] |
| Sulfate resistance test | 100 × 100 × 100 (concrete) | GB/T 50082-2009 [29] |
| Alkali aggregate reaction | 25 × 25 × 280 (mortar) | JGJ 52-2006 [31] |
| Absorption test | 100 × 100 × 100 (concrete) | GB/T 50081-2019 [28] |
| Surface resistivity test | 150 × 150 × 150 (concrete) | ASTM D257-14 [30] |
| MIP | 10 × 10 × 10 (paste) | ASTM D4404-10 [35] |
| SEM | <10 mm fragments (paste) | ASTM C1723-10 [36] |
Source: Author’s contribution.
3. Results and discussion
3.1. Workability and stone powder content
Substitution with clean glass sand reduces the total stone powder content (Table 10. Stone powder content of mixed sand). Topçu and Canbaz [34] reported that the smooth surface of glass increases “effective water” available for lubrication, as shown in Table 11. Slump of concrete. Yoo et al. [35] noted that the non-absorbent nature of glass improves filling capacity and workability in manufactured s and systems.
Table 10
Stone powder content of mixed sand
| Mix no. | MB | Stone powder (%) |
|---|---|---|
| RS | 0.2 | 1.02 |
| MS | 1.3 | 2.20 |
| GG20 | 1.0 | 1.61 |
| TG20 | 0.9 | 1.53 |
Source: Author’s contribution.
Table 11
Slump of concrete
| Mix no. | Slump (mm) | Cohesion | Water retention |
|---|---|---|---|
| RS | 83 | Good | None |
| MS | 58 | Good | None |
| GG20 | 64 | Good | None |
| TG20 | 71 | Good | None |
Source: Author’s contribution.
3.1.1. Mechanical performance: Intrinsic micro-cracks vs filling effect
Results are in Table 12, Figures 5 and 6. GG20 reached 51.8 MPa at 28 days via pozzolanic refinement. However, TG20 strength (50.1 MPa) was lower. Zhang [36] discussed the impact of sand content on the development of concrete strength. Park et al. [37] found that angular particles and internal flaws from glass crushing increase stress concentrations, which is further discussed in the microstructural Section 3.4. Pore distribution results are summarized in Table 13.
Table 12
Mechanical properties of concrete (average value ± standard deviation)
| Mix no. | Compressive strength (MPa) | Flexural strength (MPa) | ||||
|---|---|---|---|---|---|---|
| 3 days | 14 days | 28 days | 3 days | 14 days | 28 days | |
| RS | 29.4 ± 1.0 | 40.2 ± 1.1 | 46.3 ± 0.9 | 3.6 ± 0.3 | 4.3 ± 0.3 | 4.9 ± 0.4 |
| MS | 30.2 ± 1.4 | 42.4 ± 0.8 | 48.4 ± 0.6 | 3.9 ± 0.3 | 5.1 ± 0.5 | 5.6 ± 0.4 |
| GG20 | 32.1 ± 1.1 | 46.1 ± 1.0 | 51.8 ± 0.8 | 4.3 ± 0.4 | 5.5 ± 0.2 | 6.1 ± 0.3 |
| TG20 | 30.8 ± 1.5 | 45.3 ± 1.2 | 50.1 ± 1.1 | 4.1 ± 0.2 | 5.2 ± 0.3 | 5.9 ± 0.4 |
Source: Author’s contribution.
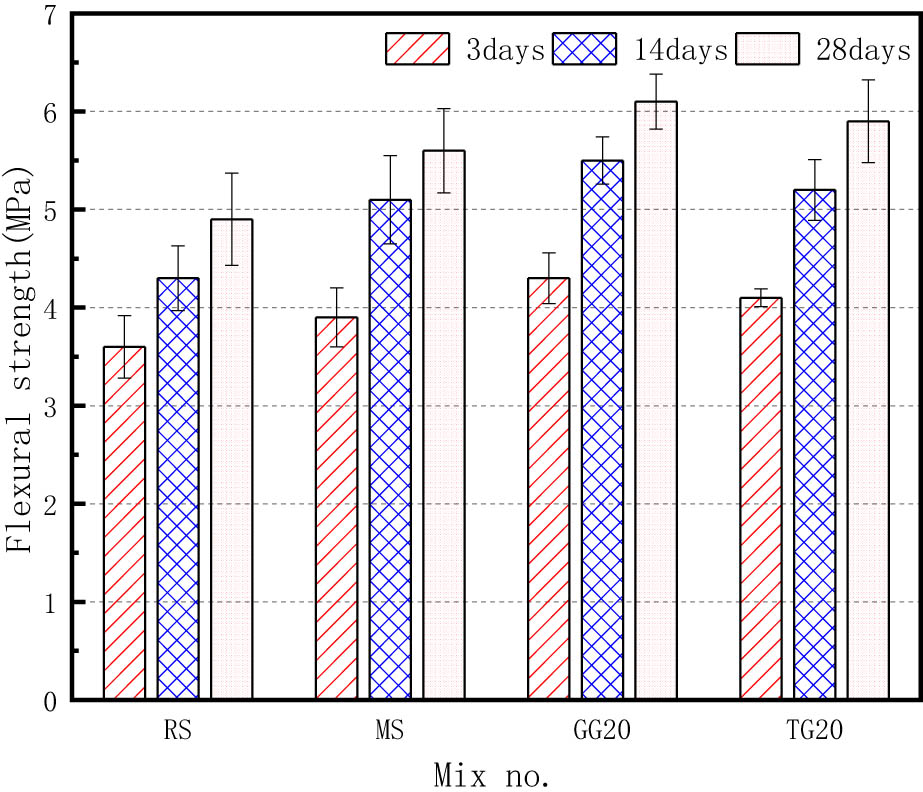
Figure 5
Flexural strength of concrete.
Source: Author’s contribution.
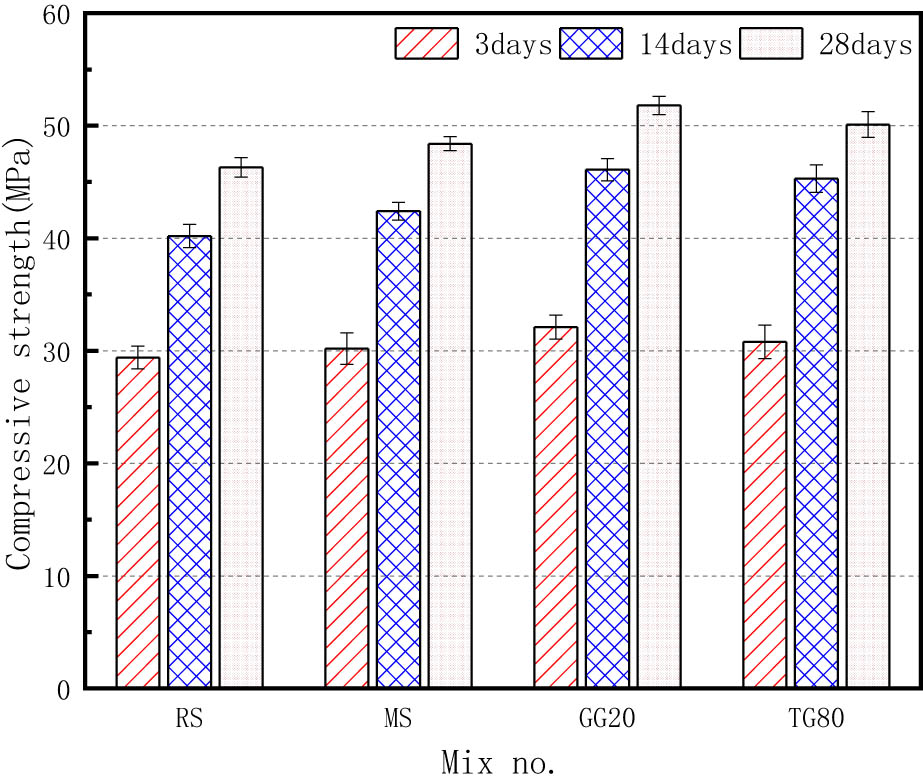
Figure 6
Compressive strength of concrete.
Source: Author’s contribution.
Table 13
Concrete pore size distribution at 28 days
| Mix no. | Porosity (%) | Average pore diameter (nm) (%) | Probable pore diameter (nm) | Pore size distribution (%) | |||
|---|---|---|---|---|---|---|---|
| <20 nm | 20–50 nm | 50–200 nm | >200 nm | ||||
| RS | 11.02 | 37.02 | 40.26 | 20.01 | 21.23 | 27.12 | 31.64 |
| MS | 15.51 | 40.12 | 40.27 | 22.72 | 22.58 | 26.21 | 28.49 |
| GG20 | 12.43 | 27.84 | 32.40 | 28.22 | 23.32 | 25.86 | 22.60 |
| TG20 | 12.09 | 30.21 | 38.26 | 24.24 | 22.86 | 25.91 | 26.99 |
Source: Author’s contribution.
3.1.2. Durability and transport properties
Impermeability: Detailed in Table 14. Glass particles act as micro-aggregates, reducing penetration height.
Table 14
Impermeability of concrete
| Mix no. | Impermeability grade | Penetration height (mm) |
|---|---|---|
| RS | P12 | 67 |
| MS | P12 | 96 |
| GG20 | P12 | 83 |
| TG20 | P12 | 74 |
Source: Author’s contribution.
Sulfate Resistance: Detailed in Table 15. Figure 7 shows the appearance after the attack. TG20 demonstrates superior resistance (K f = 88.6%) because its lower porosity (Table 13) increases pore tortuosity, hindering the capillary transport of sulfate ions ().
Table 15
Sulfate resistance of concrete (after 15 wet-dry cycles)
| Mix no. | Compressive strength (MPa) | Sulfate resistance coefficient (%) | |
|---|---|---|---|
| Control specimen | Sulfate wetting-drying cycle | ||
| RS | 42.6 | 47.0 | 90.5 |
| MS | 45.1 | 52.4 | 86.0 |
| GG20 | 50.3 | 57.2 | 87.9 |
| TG20 | 47.1 | 53.1 | 88.6 |
Source: Author’s contribution.
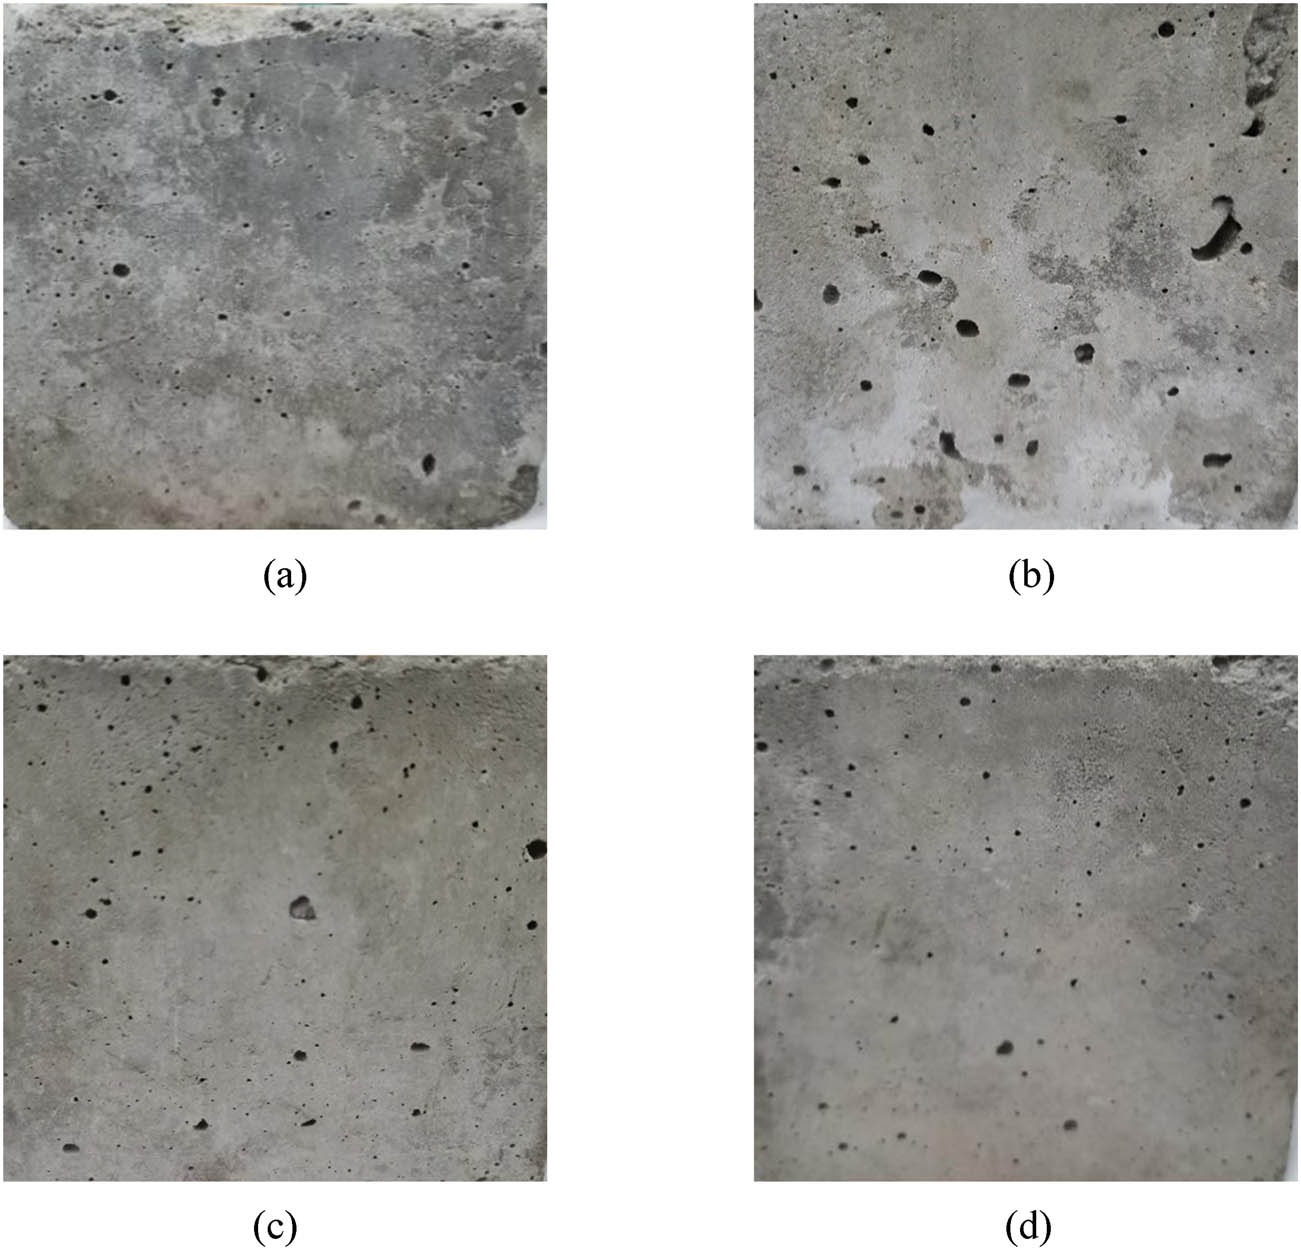
Figure 7
Appearance of the specimen after sulfate attack. (a) RS, (b) MS, (c) GG20, and (d) TG20.
Source: Author’s contribution.
Drying Shrinkage: Non-absorbent glass sand reduces capillary tension and shrinkage, as shown in Figure 8. Drying shrinkage of concrete up to 180 days, which was also discussed by You [38] regarding CRT glass.
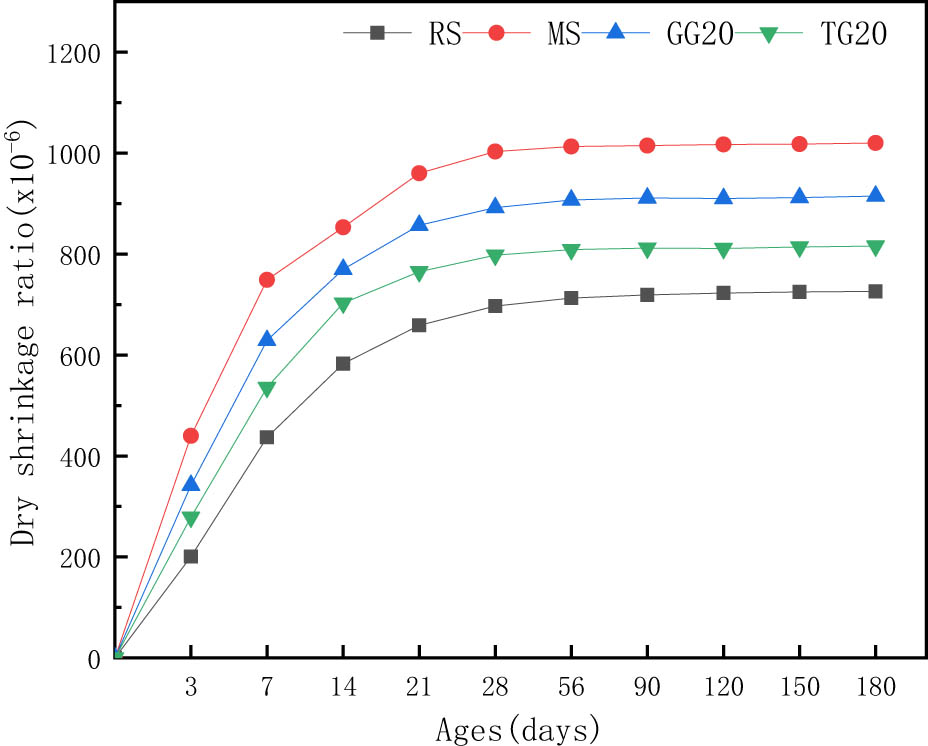
Figure 8
Drying shrinkage of concrete up to 180 days.
Source: Author’s contribution.
Electrical Resistivity & Water Absorption: Details are shown in Figure 9. Different kinds of concrete water absorption are shown in Figure 10. Different kinds of concrete resistivity. Wei et al. [39] used resistivity to study cement hydration kinetics, while Kim et al. [40] found that replacing LCD glass alters ion transport paths.
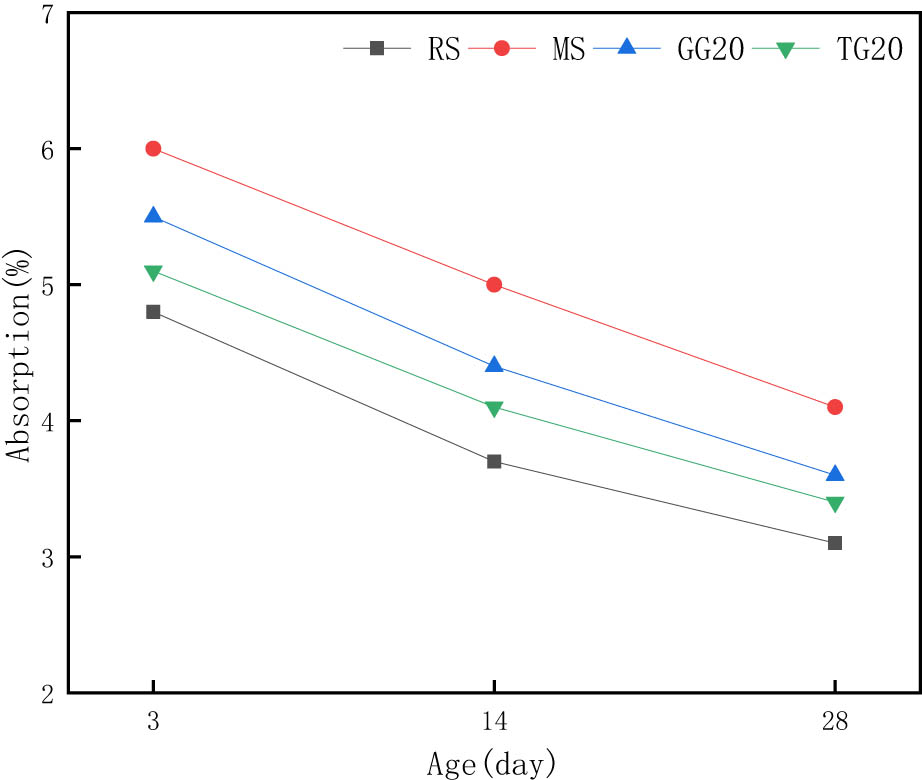
Figure 9
Different kinds of concrete water absorption.
Source: Author’s contribution.
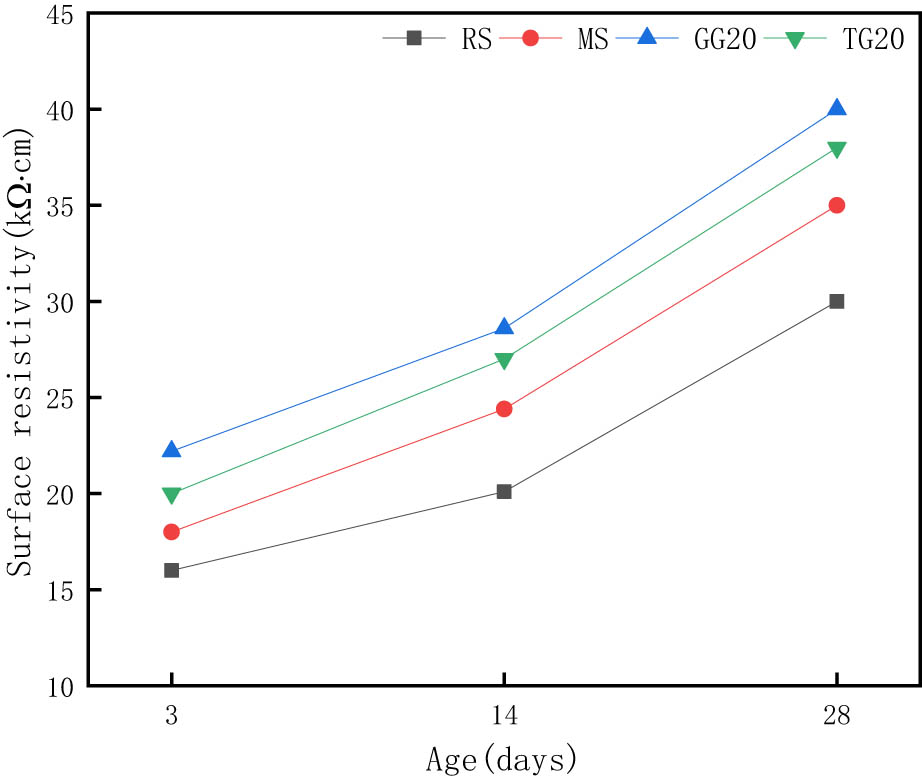
Figure 10
Different kinds of concrete resistivity.
Source: Author’s contribution.
ASR Expansion: Slurry rod expansion rate vs age curve shows that TG20 reached 0.11% expansion at 14 days (Figure 11), exceeding the 0.1% safe threshold.
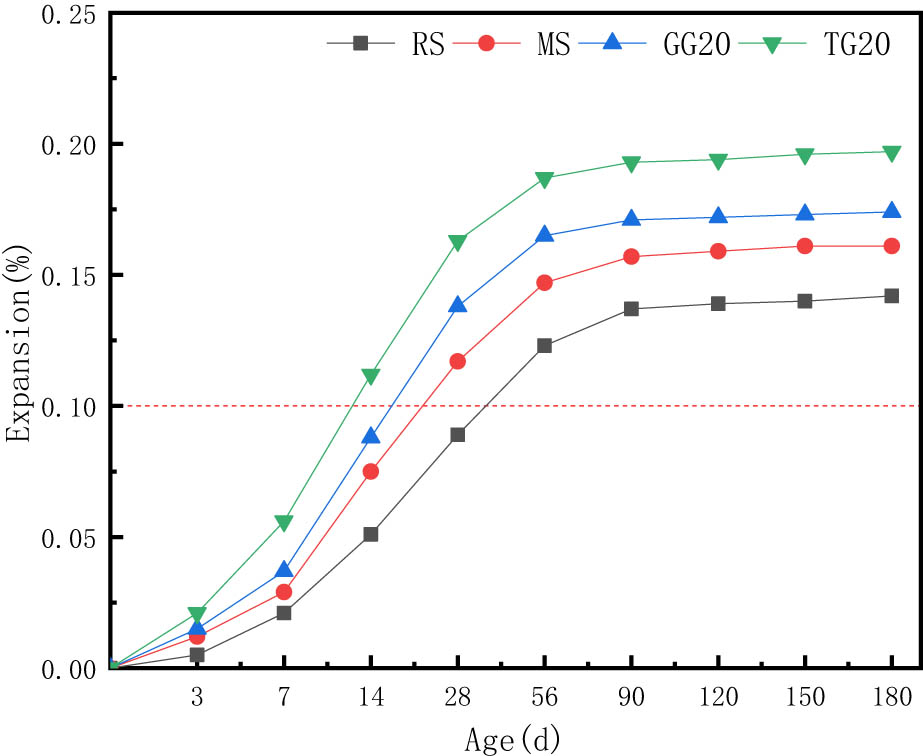
Figure 11
Slurry rod expansion rate vs age curve.
Source: Author’s contribution.
Pore Refinement: Table 13 Concrete pore size distribution at 28 days and Figures 12–14 confirm refinement. Zeng et al. [41] used MIP to analyze pore-structure evolution, while Han and Liang [42] optimized mix designs for manufactured sand concrete.
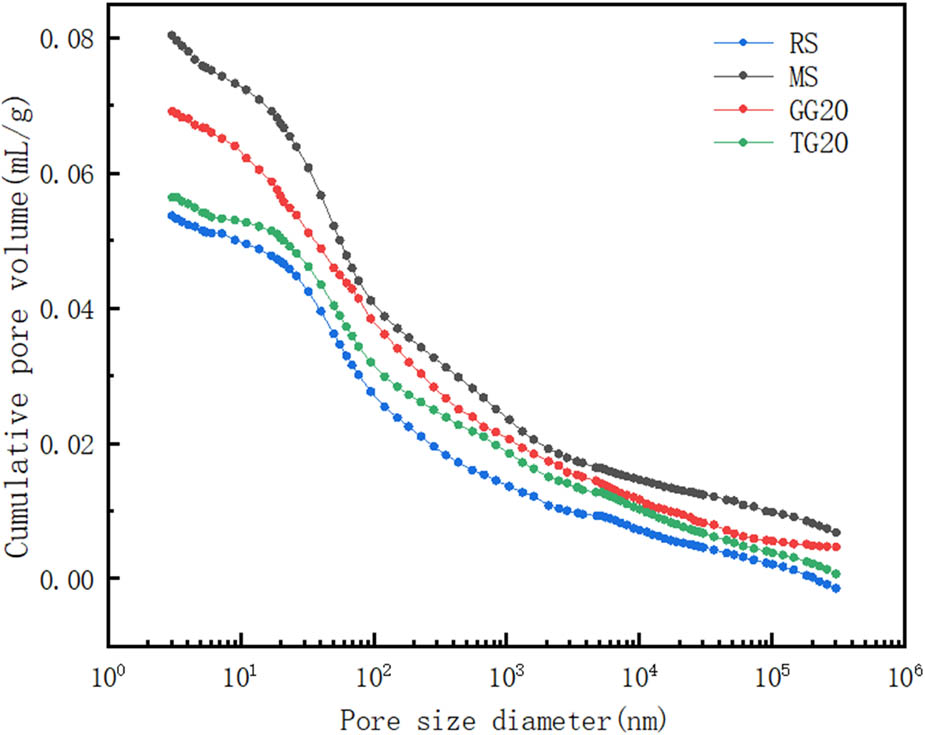
Figure 12
Integral curves for the distribution of pore sizes in different concrete.
Source: Author’s contribution.
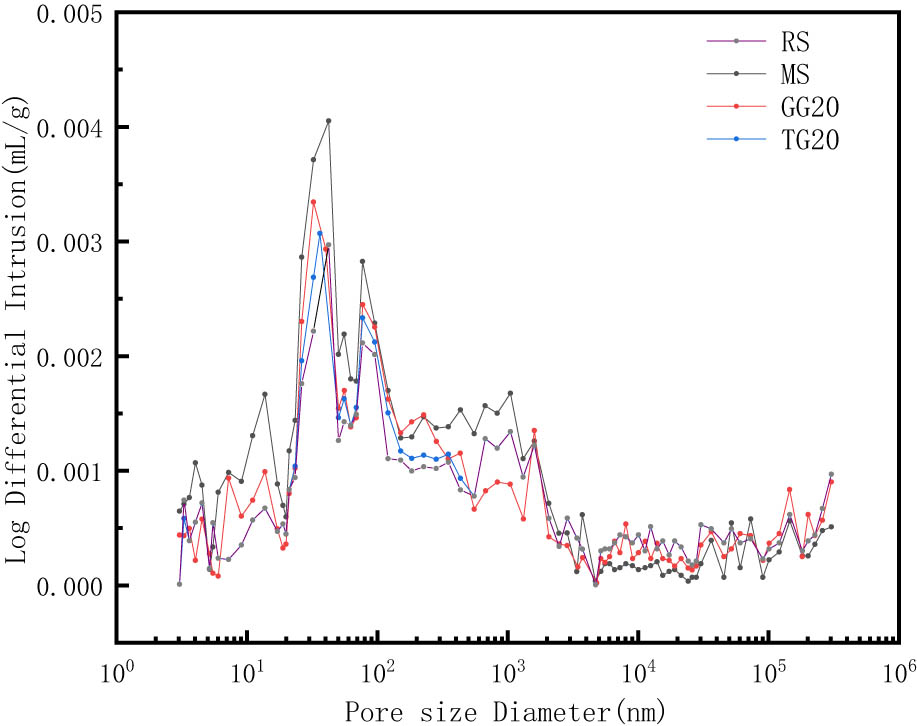
Figure 13
Differential curve of pore size distribution of different concrete.
Source: Author’s contribution.
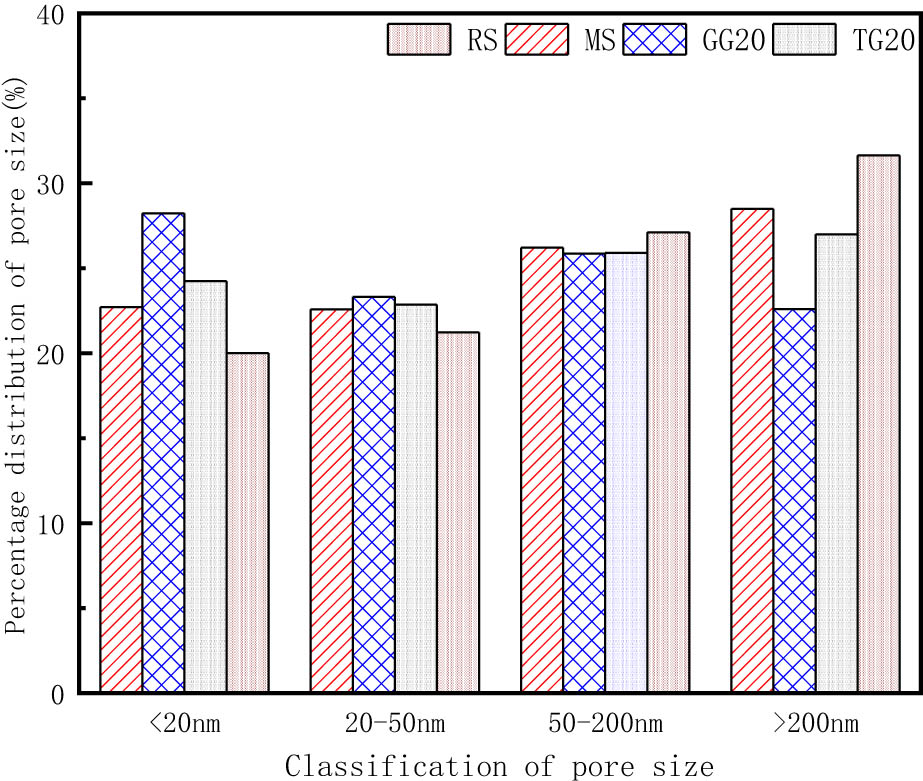
Figure 14
Pore size distribution of different concrete specimens.
Source: Author’s contribution.
3.2. Microstructural interpretation via SEM
SEM images of RS, MS, GG20, and TG20 at 3 and 28 days show the evolution of the ITZ and aggregate matrix across different aggregate systems and curing ages (Figures 15–18).
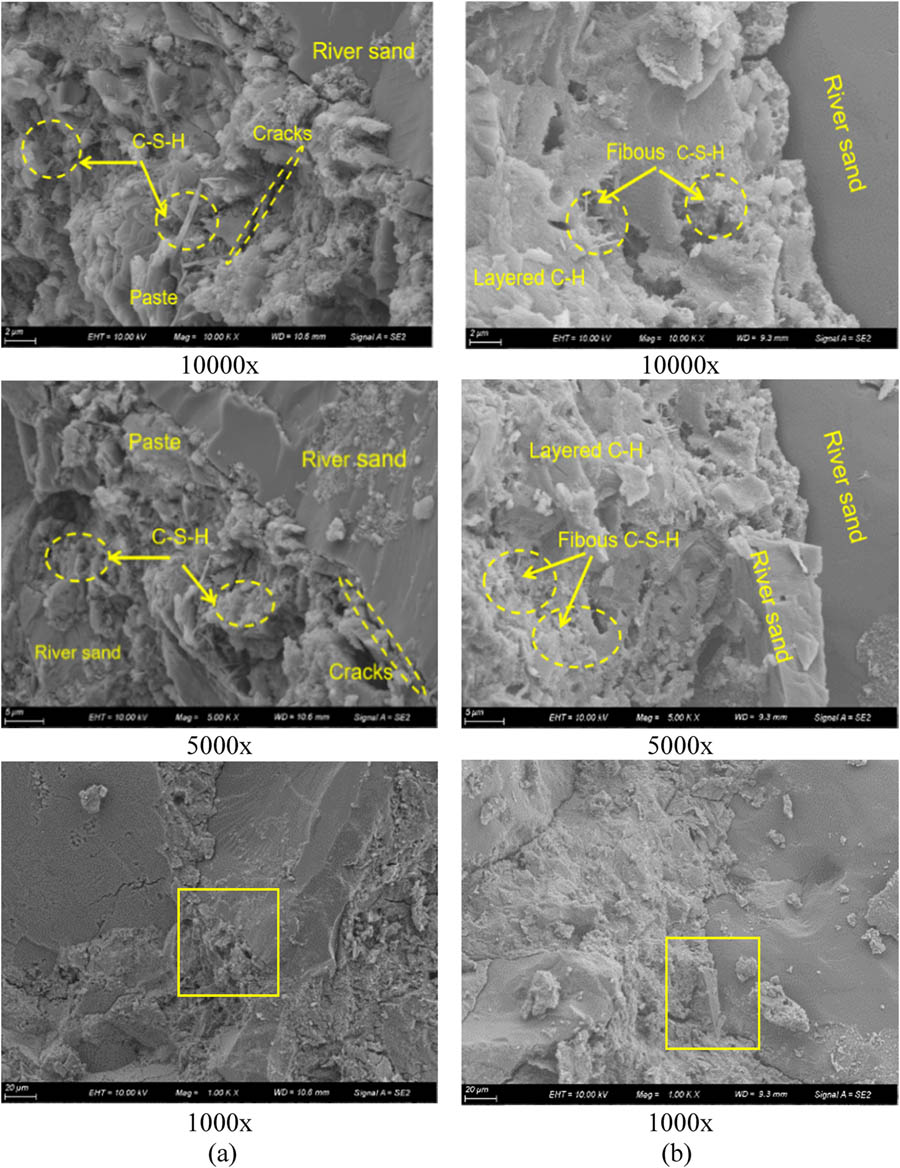
Figure 15
SEM images of RS at (a) 3 days and (b) 28 days.
Source: Author’s contribution.
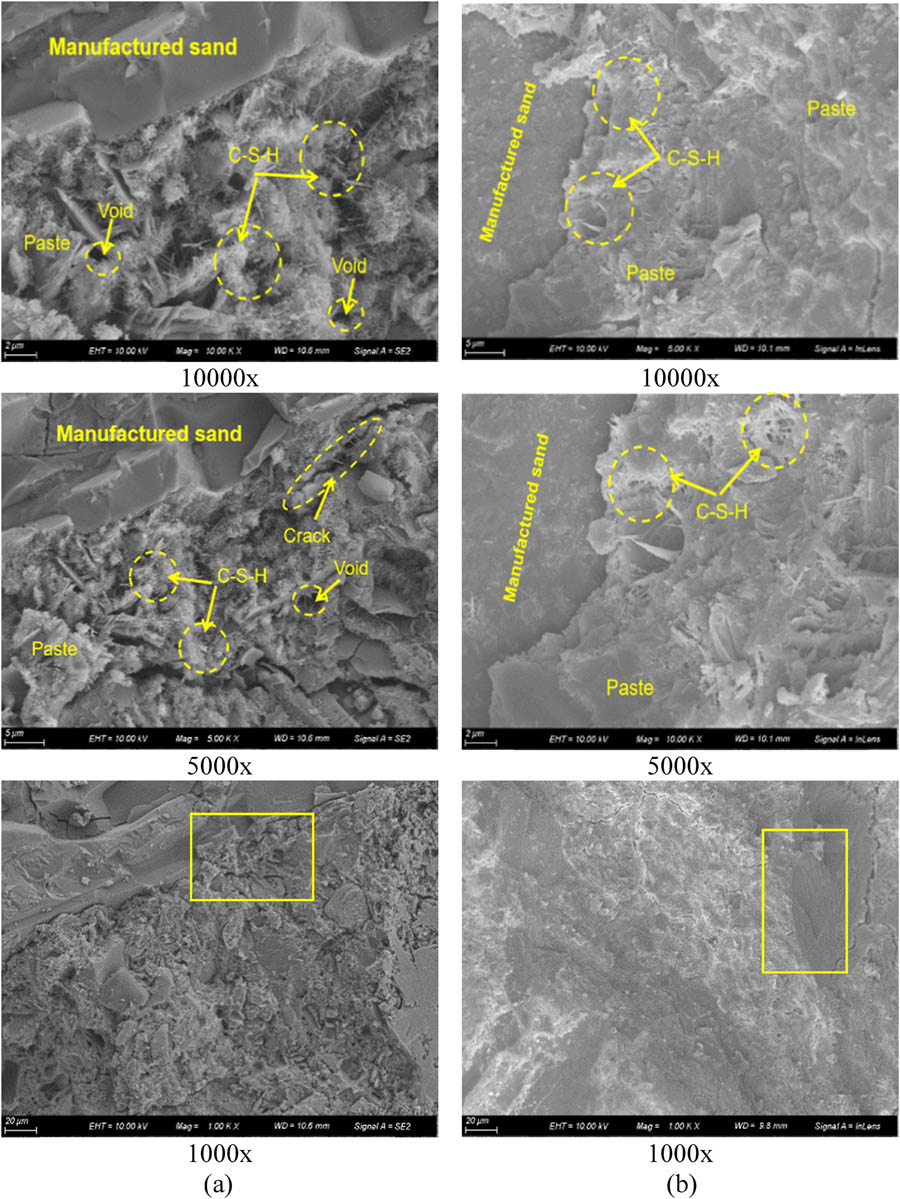
Figure 16
SEM images of MS at (a) 3 days and (b) 28 days.
Source: Author’s contribution.
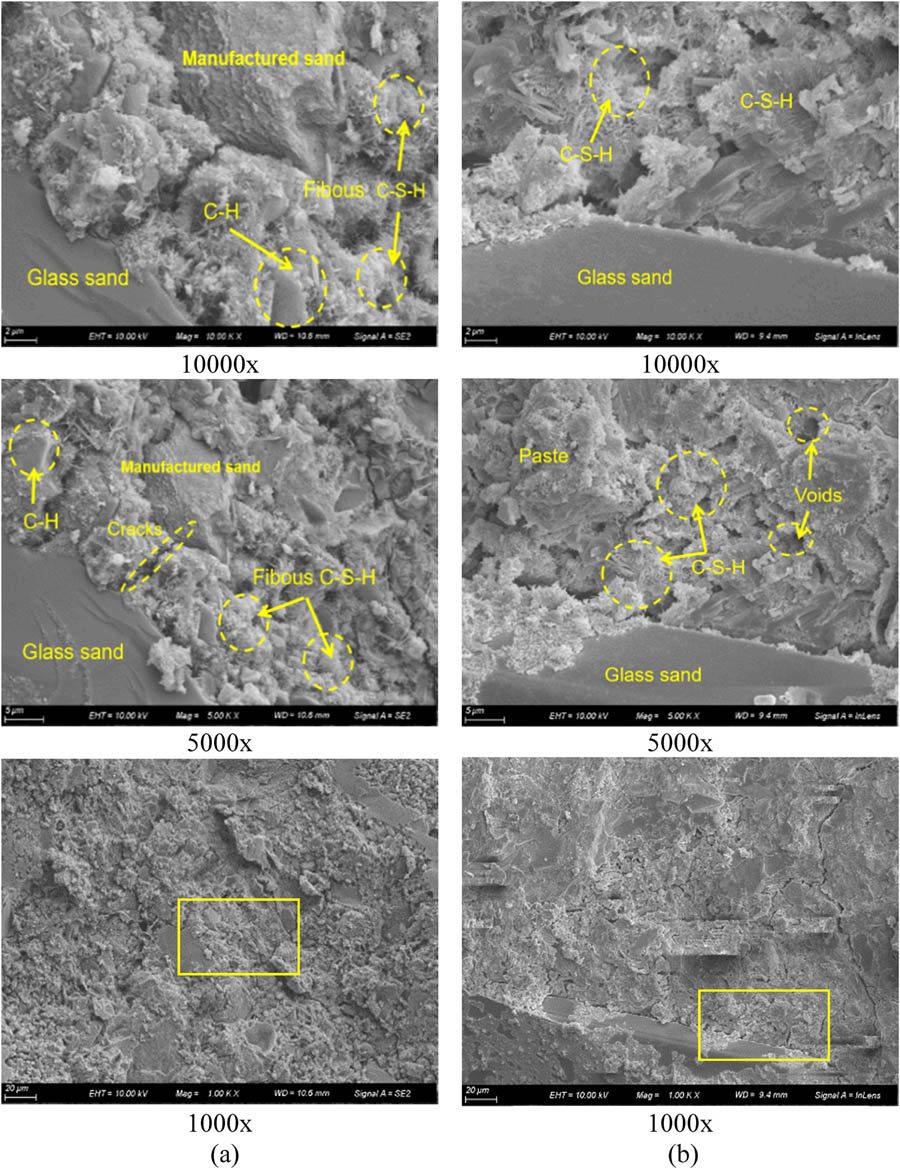
Figure 17
SEM images of GG20 at (a) 3 days and (b) 28 days.
Source: Author’s contribution.
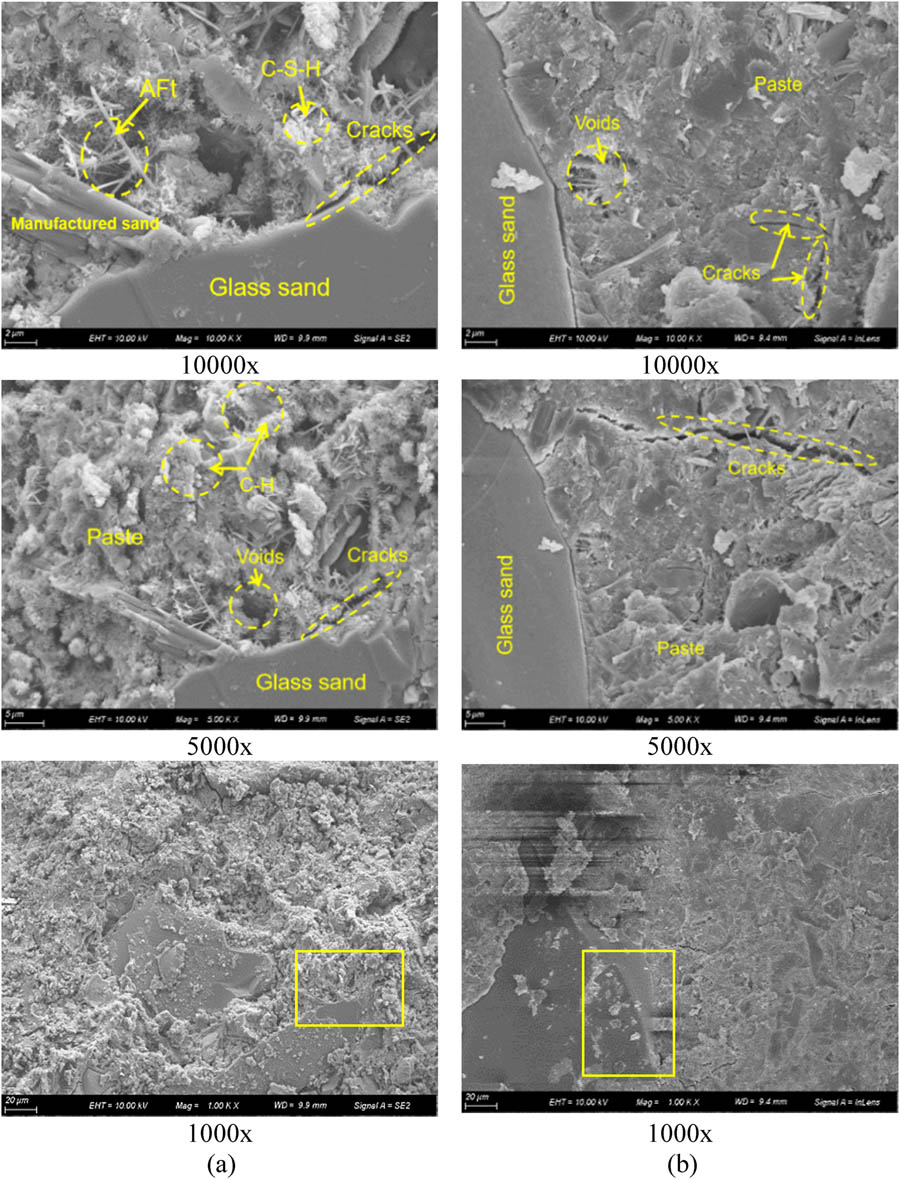
Figure 18
SEM images of TG20 at (a) 3 days and (b) 28 days.
Source: Author’s contribution.
RS (Figure 15): Figure 15(a and b) show the hydration products inside the river sand concrete. At 3 days of age, small microcracks and unreacted calcium hydroxide (C–H) crystals are visible between the hydration products. Noticeable interfacial cracks within the ITZ are observed between river sand and the cement paste at 5,000× magnification, which acts as the leading cause of strength reduction. By 28 days, at 10,000× and 5,000× magnification, the hydration products are tightly packed, resulting in a denser pore structure than at 3 days. A fibrous network of C–S–H gel appears near the ITZ, with layered C–H crystals covering the surface and significantly fewer pores.
MS Group: SEM Images of manufactured sand concrete at 3 and 28 days are shown in Figure 16(a and b), respectively. At 3 days, a large number of sheet-like C–H crystals and a small amount of flocculent C–S–H gel are generated. Many pores and visible cracks are evident near the ITZ at 5,000× magnification. By 28 days, the sheet-like C–H crystals continue to hydrate into a layered C–S–H gel, yielding a more consistent pore structure without noticeable internal pores. At 1,000× magnification, the 28-day sample shows more complete hydration than the 3-day age, with no apparent holes on the specimen surface.
GG20 (Figure 17): Figure 17(a and b) are SEM images of GG20 concrete at 3 and 28 days, showing the hydration reaction process. At 3 days of age, under 10,000× magnification, a needle-like C–S–H gel formed between the green glass sand and the manufactured sand. Layered C–H crystals were embedded in the C–S–H gel, accompanied by a small number of micro-cracks. At 28 days of age, cement hydration becomes more complete, and the needle-like C–S–H gel and sheet-like C–H crystals gradually transform into a layered C–S–H gel. No apparent cracks formed in the interfacial transition zone of the aggregate, resulting in a dense structure. At 1,000× magnification, many small pores are visible on the surface of the 3-days sample, whereas the 28D sample surface is free of small pores. Compared with MS and RS, the pore structure is denser, confirming the mechanical performance results and indicating strong pozzolanic bonding through the reaction of amorphous silica.
TG20 (Figure 18): The micro development process of TG20 concrete can be observed in Figure 18(a and b). At 3 days of age, cracks appeared between the glass aggregate and hydration products, and the flocculent C–S–H gel formed by cement slurry hydration was sparsely distributed. The sheet-like C–H crystals were stacked loosely. Compared with Figure 17(a and b), the concrete system had more pores. At 28 days of age, the hydration products in the concrete are tightly packed at 10,000× and 5,000× magnification, and the pore structure is relatively dense compared to that at 3 days of age. At 28 days, SEM reveals intrinsic micro-cracks on the LCD glass surface from crushing, as observed by Gilabert et al. [43] in interface energy studies and Keerio et al. [44] in silica fume systems. These trans-granular cracks explain the mechanical bottleneck despite a densified surrounding matrix, as the structural integrity of the aggregate itself limits the load-bearing capacity. This is also why TG20’s resilience is lower than GG20’s.
4. Conclusions
Through comprehensive experiments and multi-scale analysis, this study systematically compared the effects of replacing 20% of manufactured sand (MS) with green recycled glass sand (GG) and LCD waste glass sand (TG) on the performance of C30 concrete. The following main conclusions and engineering application recommendations are drawn based on the experimental results and in-depth discussion.
(1) Optimal Substitution: Replacing 20% manufactured sand with green glass sand (GG20) achieves the best mechanical performance, reaching a 28-day compressive strength of 51.8 MPa.
(2) Workability Improvement: Incorporating clean waste glass sand reduces stone powder content and interparticle friction, effectively improving flowability.
(3) Durability Mechanism: Glass aggregates refine pore structure, enhancing sulfate resistance and resistivity, which aligns with findings by Meng et al. [45] on green concrete.
(4) Mechanical Bottleneck: The strength of LCD concrete is limited by intrinsic micro-cracks in particles, as noted by Singh and Mohanty [46] on waste glass powder.
(5) Safety Risk: LCD glass exhibits high ASR risk (0.11% at 14 days, Figure 11), requiring chemical mitigation as suggested by Freitas et al. [47].
Funding information
Author states no funding involved.
Author contributions
Conceptualization, Methodology, Resources, Supervision, Writing–original draft, Writing-review & editing. Investigation, Data curation, Formal analysis, Visualization. Validation, Project administration.
Conflict of interest statement
Author states no conflict of interest.
Data availability statement
The data used to support the findings of this study are available from the corresponding author upon request.