Figure 1
Figure 2
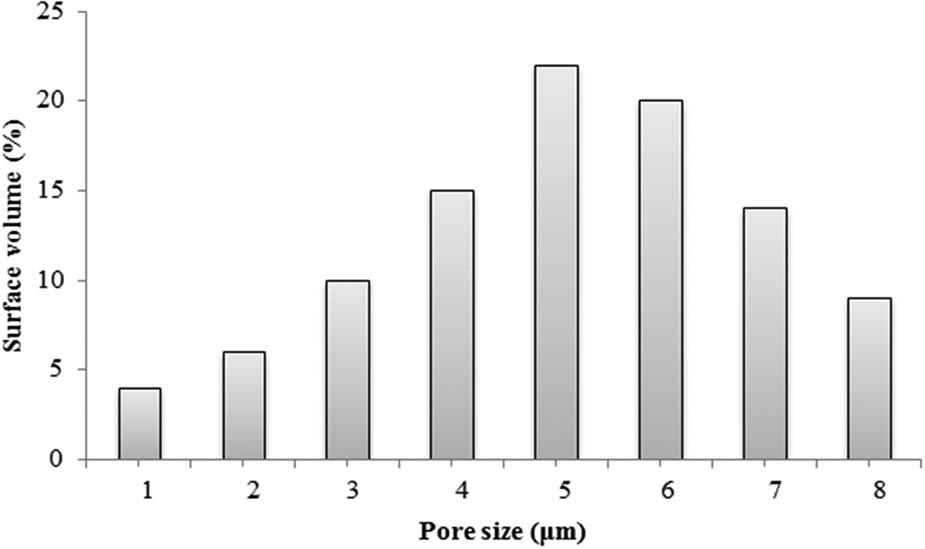
Figure 3
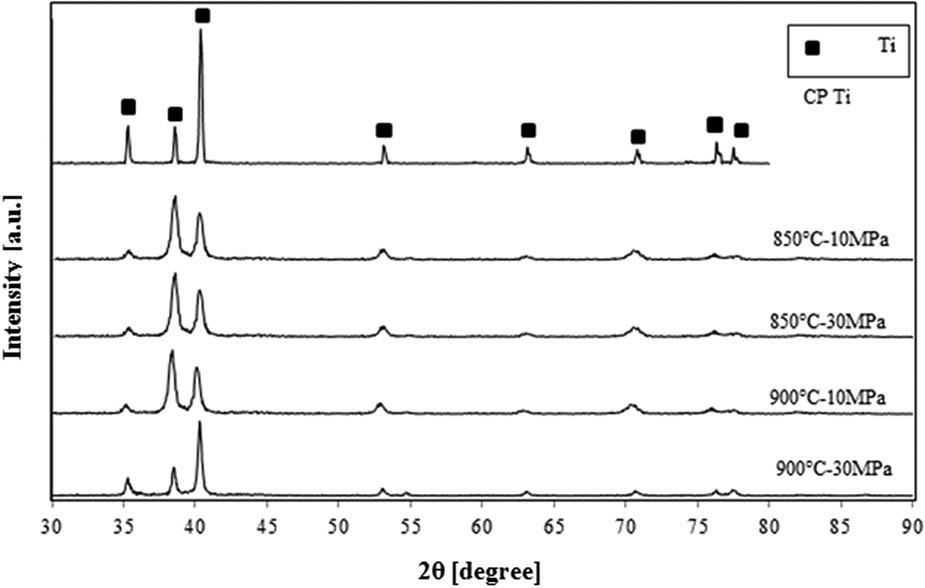
Figure 4
Figure 5
Figure 6
Figure 7
Figure 8
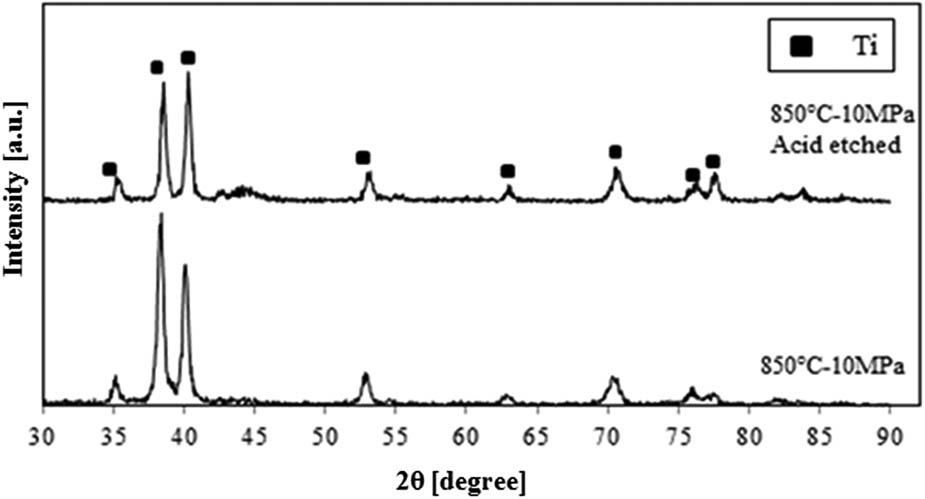
Figure 9
Figure 10
Figure 11
Figure 12
Figure 13
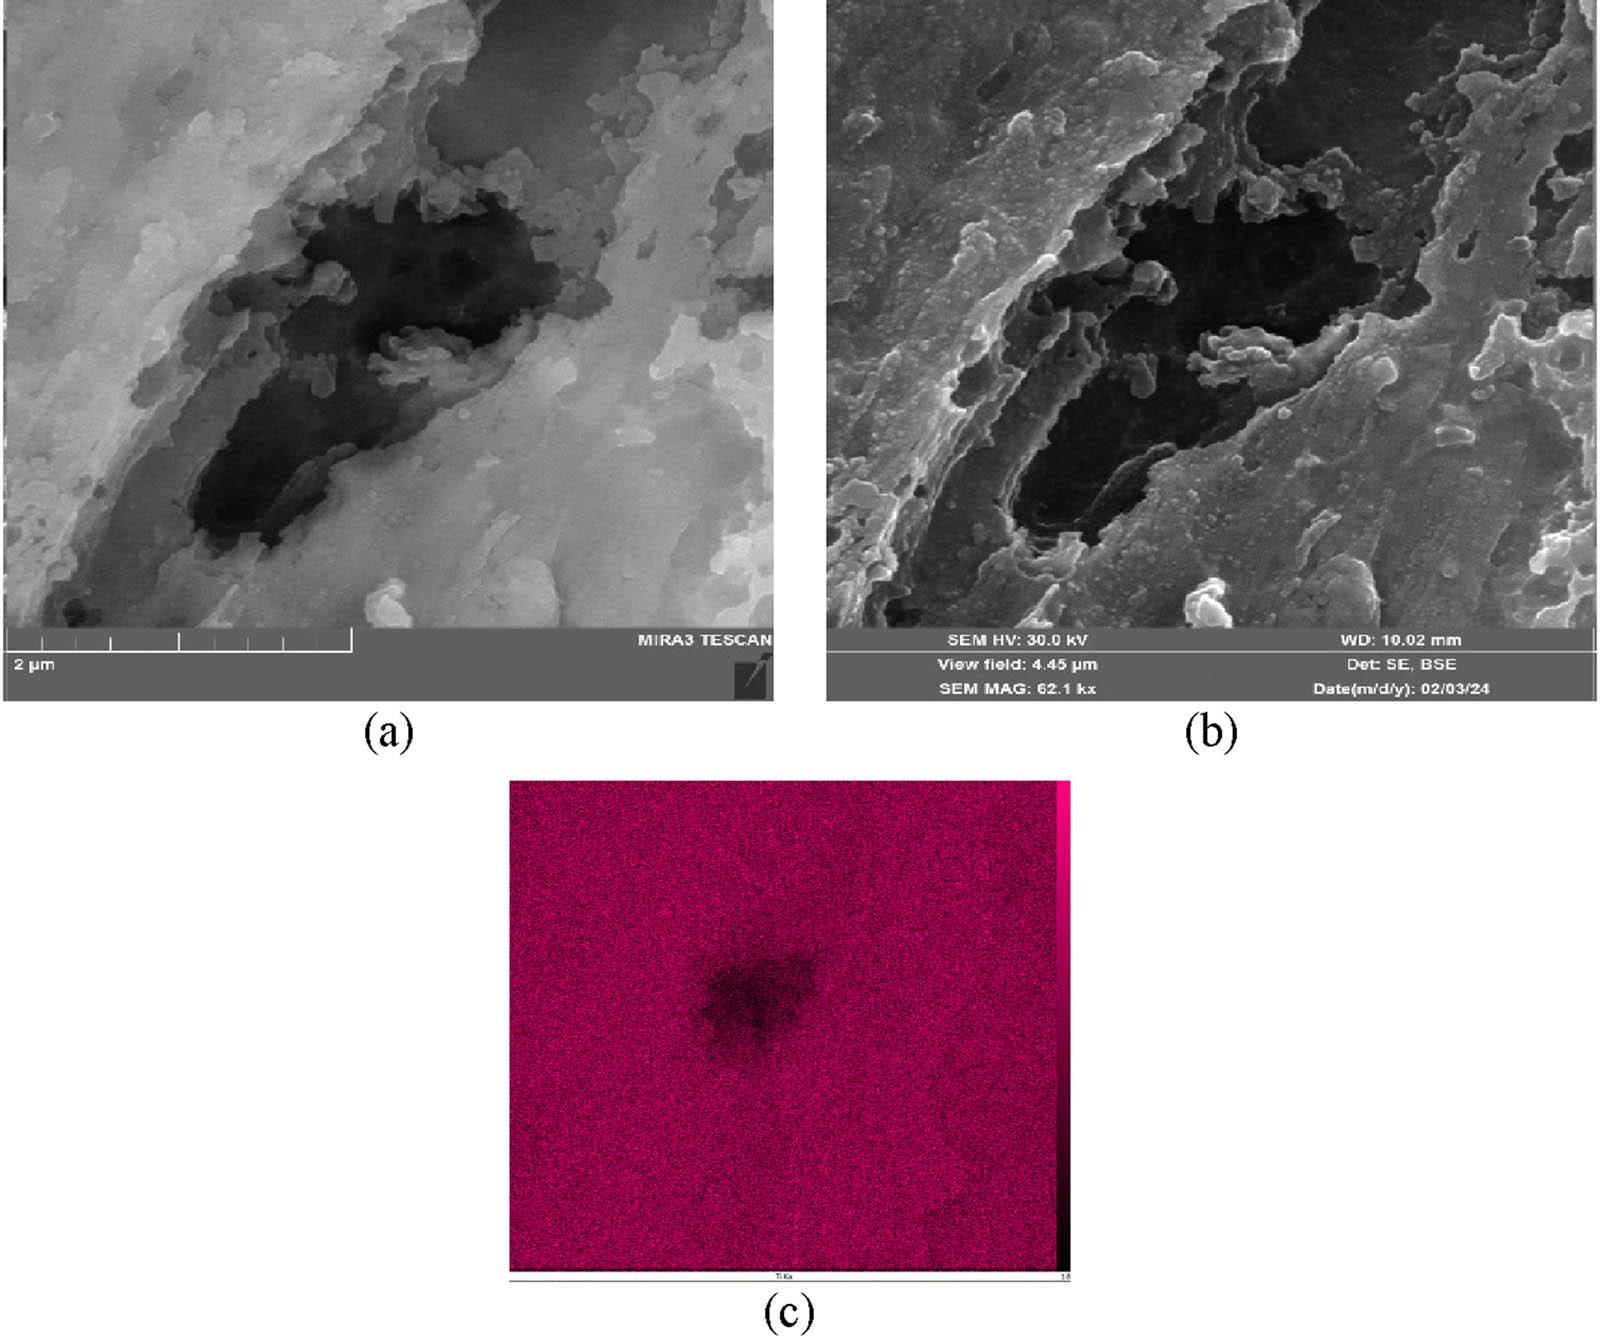
Figure 14
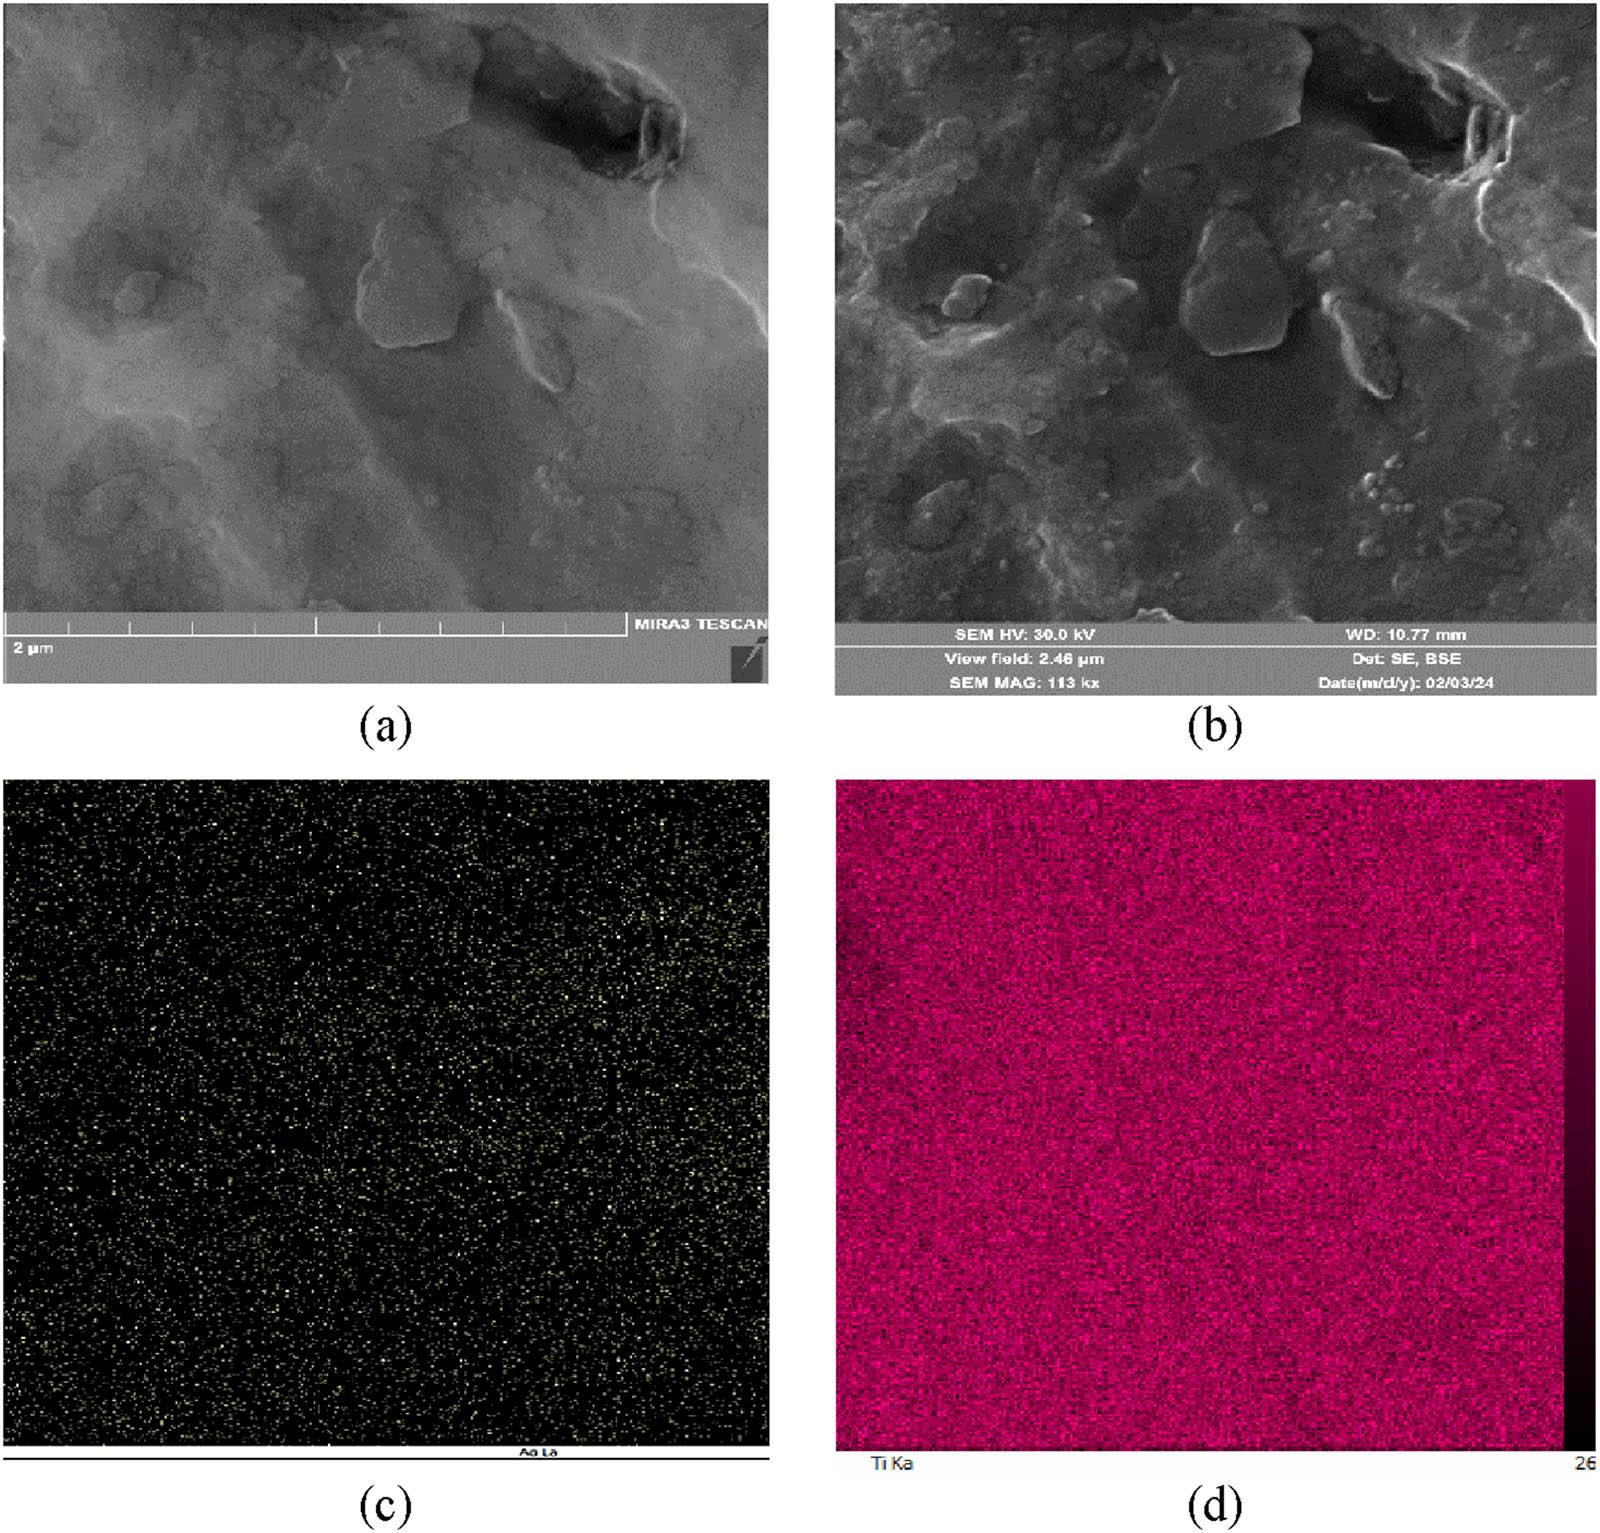
Figure 15
Figure 16
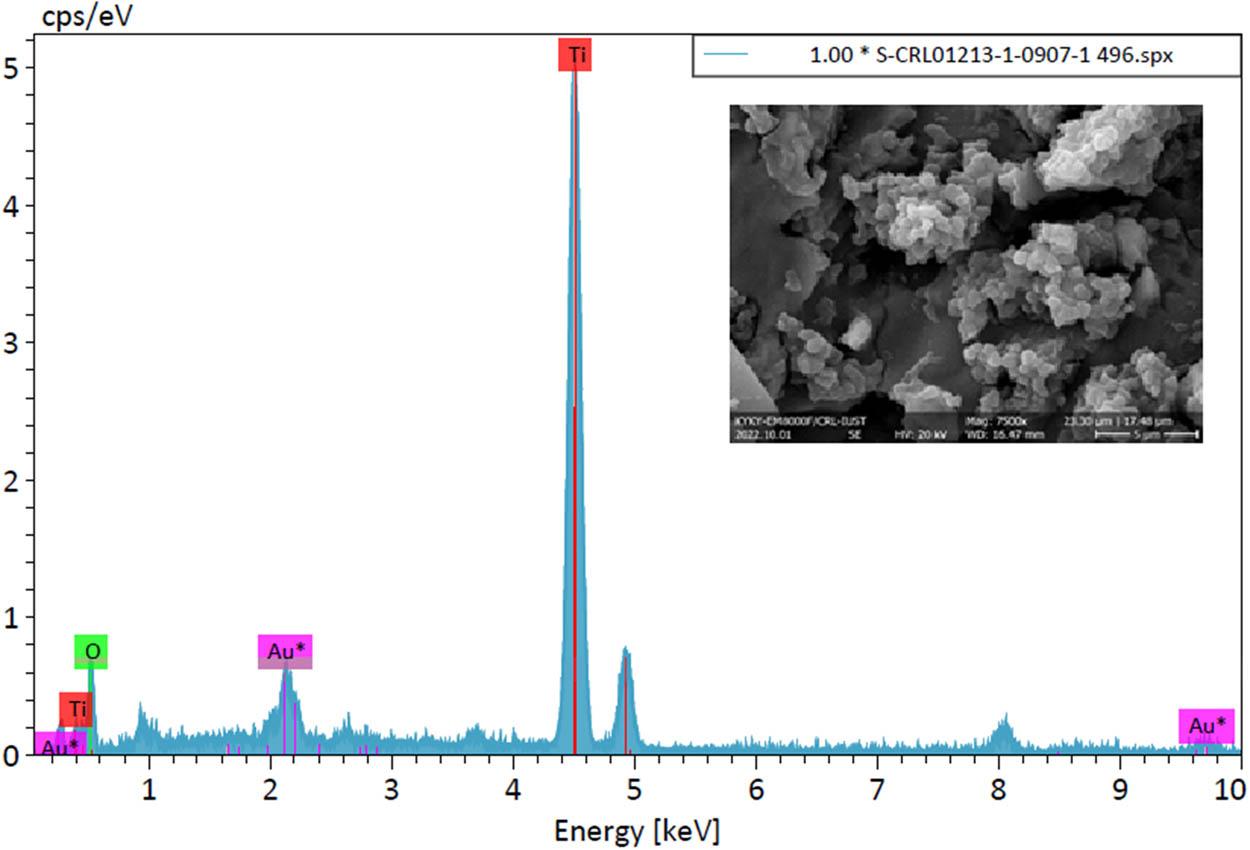
Figure 17
Figure 18
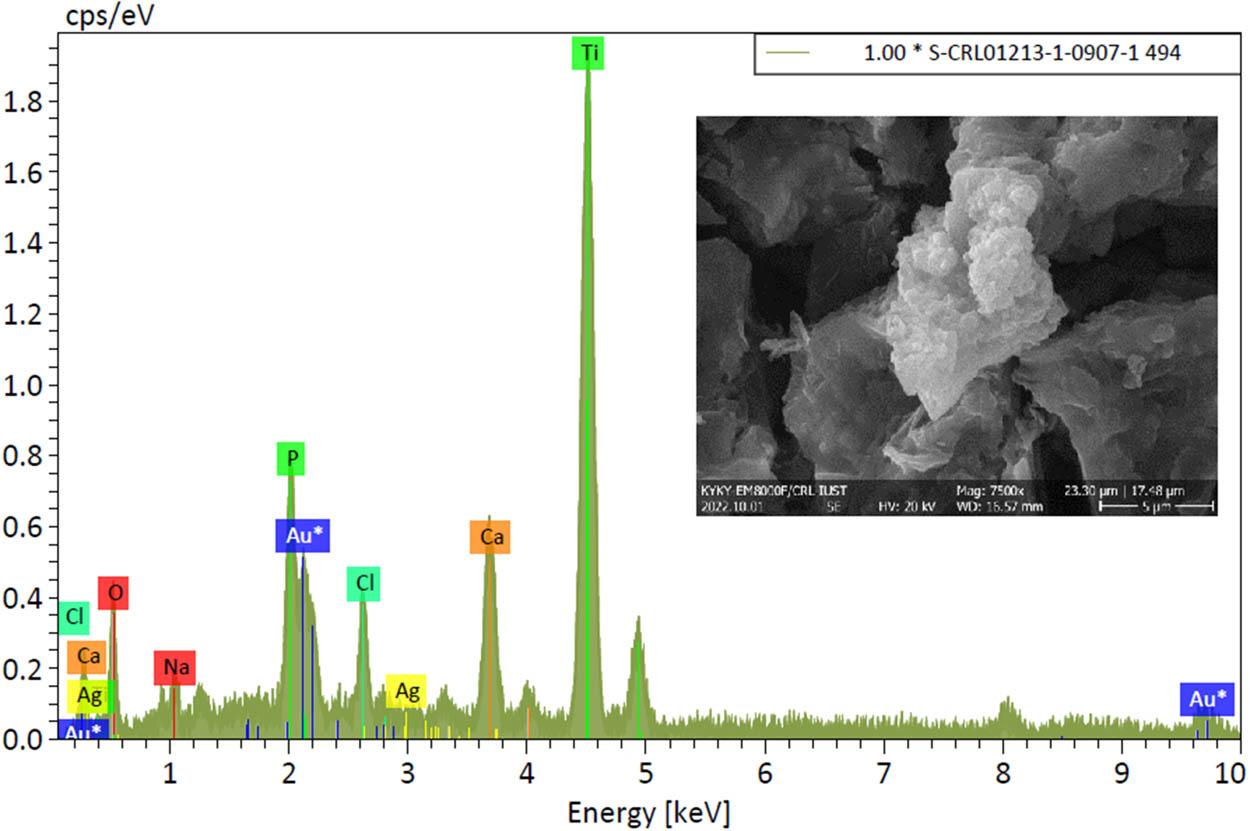
Figure 19
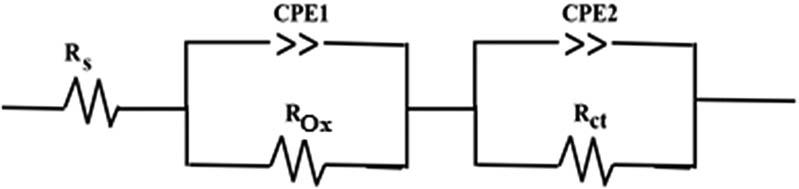
Figure 20
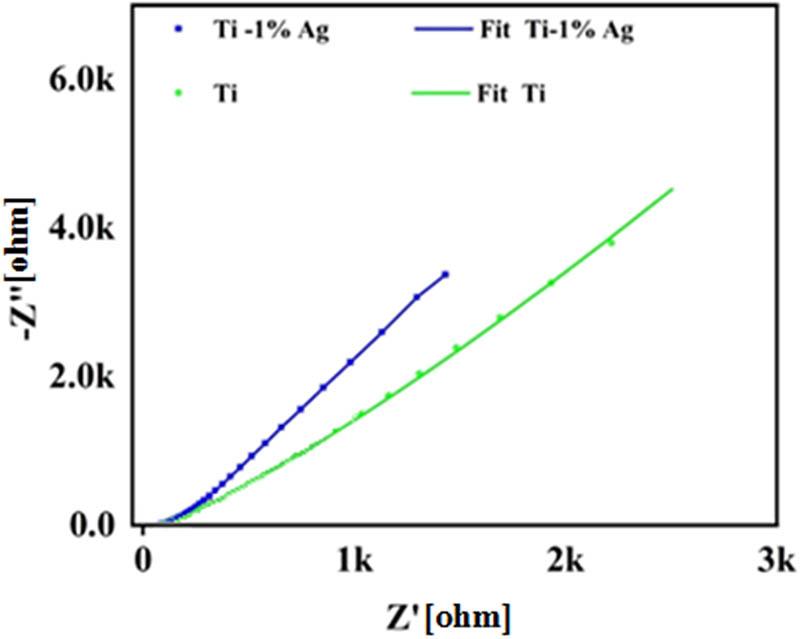
Figure 21
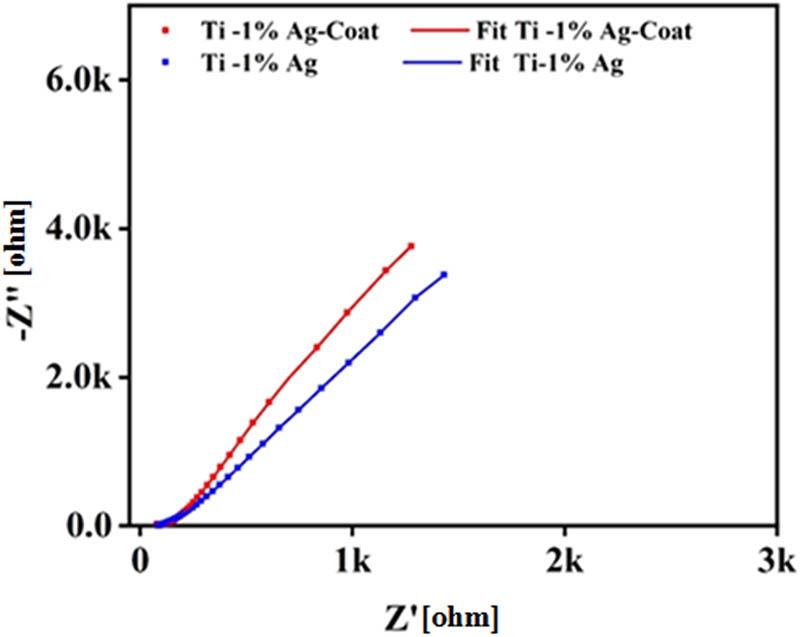
Figure 22
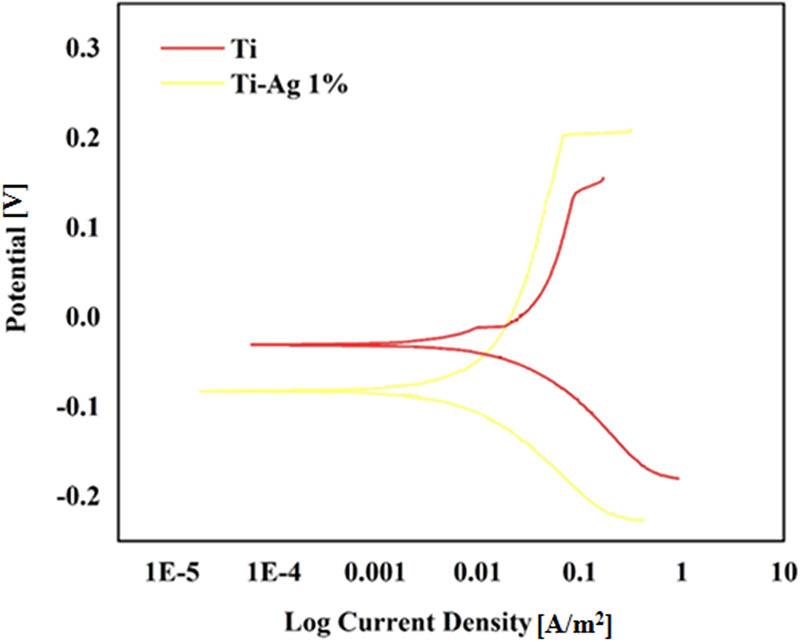
Figure 23
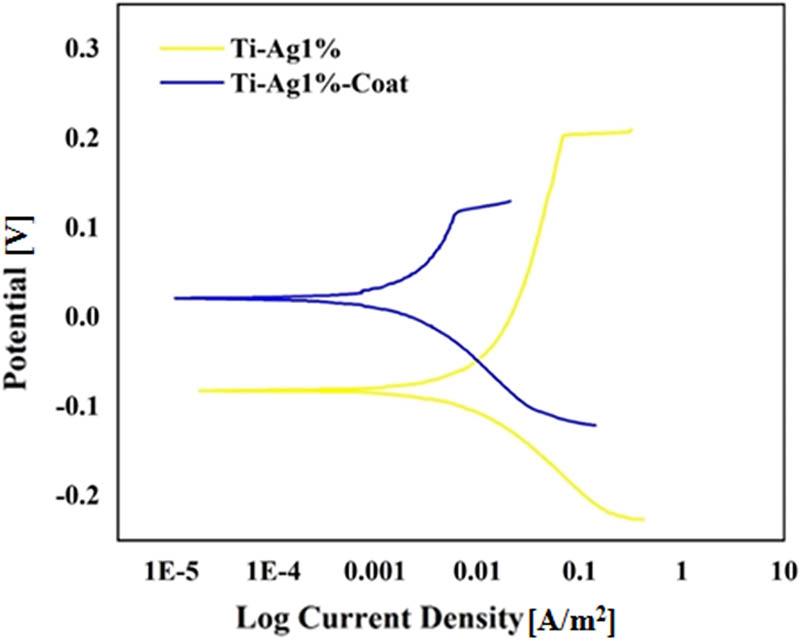
Figure 24
Elemental analysis of the coated sample before being placed in SBF_
| Element | Atomic number | Net counts | Mass (%) | Mass normalized (%) | Atom (%) | Absolute error (%) | Relative error (%) |
|---|---|---|---|---|---|---|---|
| Ti | 22 | 6,804 | 55.89 | 64.15 | 37.42 | 1.76 | 3.14 |
| O | 8 | 387 | 31.23 | 35.85 | 62.58 | 9.50 | 30.42 |
| Sum 87.12 | 100.00 | 100.00 |
Contact angles of samples prepared under different conditions_
| Pressure and temperature of SPS | Contact angle (°) |
|---|---|
| 900°C–30 MPa | 55.12 |
| 900°C–30 Mpa etched | 43.39 |
| 900°C–10 Mpa | 51.14 |
| 900°C–10 Mpa etched | 36.43 |
| 850°C–30 Mpa | 46.37 |
| 850°C–30 Mpa etched | 29.61 |
| 850°C–10 Mpa | 38.61 |
| 850°C–10 Mpa etched | 28.36 |
Parameters obtained from Nyquist plots for Ti–1 wt% Ag in coated and uncoated samples_
| R ct (Ω) | CPE (Ω) | R cox (Ω) | CPE (Ω) | R s (Ω) | |
|---|---|---|---|---|---|
| Ti–1 wt% Ag, coated | 4.177 × 10¹⁸ | 2.361 × 10⁻³ | 3.431 × 10¹⁵ | 1.222 × 10⁻³ | 115.4 |
| Ti–1 wt% Ag, uncoated | 3.32 × 10¹⁸ | 2.927 × 10⁻³ | 2.53 × 10¹⁵ | 1.123 × 10⁻³ | 111.8 |
Elemental analysis of the coated sample after being placed in SBF_
| Element | Atomic number | Net counts | Mass (%) | Mass normalized (%) | Atom (%) | Absolute error (%) | Relative error (%) |
|---|---|---|---|---|---|---|---|
| Ti | 22 | 14,838 | 30.83 | 49.08 | 28.30 | 0.93 | 3.00 |
| O | 8 | 1,194 | 21.27 | 33.85 | 58.41 | 4.61 | 21.69 |
| Ca | 20 | 3,856 | 5.89 | 9.38 | 6.64 | 0.23 | 3.90 |
| P | 15 | 2,106 | 2.28 | 3.63 | 3.24 | 0.14 | 5.93 |
| Cl | 17 | 1,612 | 1.5 | 2.38 | 1.85 | 0.09 | 6.21 |
| Na | 11 | 361 | 0.87 | 1.39 | 1.67 | 0.11 | 12.93 |
| Ag | 47 | 106 | 0.19 | 0.3 | 0.08 | 0.05 | 24.5 |
| Sum 62.82 | 100.00 | 100.00 |
Parameters obtained from potentiodynamic polarization curves for CP Ti and Ti–1 wt% Ag_
| E Corr (V) | I Corr (A/m2) | ß a (V) | ß C (V) | R p (Ω m2) | |
|---|---|---|---|---|---|
| Pure Ti | −0.030 | 0.028 | 2.56 | −0.245 | 4.37 |
| Ti–1 wt% Ag | −0.084 | 0.010 | 4.87 | −0.466 | 22.40 |
Contact angles for coated and uncoated samples_
| Pressure and temperature of SPS | Contact angle (°) |
|---|---|
| 850°C–10 MPa, non-etched | 38.61 |
| 850°C–10 MPa, etched | 28.36 |
| 850°C–10 MPa, non-etched and covered with PCL | 33.49 |
| 850°C–10 MPa, etched and covered with PCL | 24.45 |
Parameters obtained from potentiodynamic polarization curves for Ti–1 wt% Ag in coated and uncoated samples_
| Ti–1 wt% Ag | E Corr (V) | I Corr (A/m2) | ß a (V) | ß C (V) | R p (Ω m2) |
|---|---|---|---|---|---|
| Uncoated | −0.084 | 0.010 | 4.87 | −0.466 | 22.40 |
| Coated | 0.018 | 0.002 | 0.243 | −0.106 | 40.87 |
Parameters obtained from Nyquist plots_
| R ct (Ω) | CPE (Ω) | R cox (Ω) | CPE (Ω) | R s (Ω) | |
|---|---|---|---|---|---|
| Pure Ti | 1.31 × 10¹⁸ | 0.352 × 10⁻³ | 1.7 × 10¹⁵ | 0.589 × 10⁻³ | 106.2 |
| Ti–1 wt% Ag | 3.32 × 10¹⁸ | 2.927 × 10⁻³ | 2.53 × 10¹⁵ | 1.123 × 10⁻³ | 111.8 |
Porosity of the SPS samples_
| Pressure (MPa) | Temperature (°C) | Porosity (%) ±0.1 |
|---|---|---|
| 30 | 900 | 13.1 |
| 10 | 900 | 14.25 |
| 30 | 850 | 16.3 |
| 10 | 850 | 21.82 |
Number of colonies in the antibacterial test_
| Group | Number of formed colonies | Efficiency of removing bacteria | |||
|---|---|---|---|---|---|
| 1 | 2 | 3 | Average | ||
| Bacteria | 14.2 × 10⁶ | 8.6 × 10⁶ | 11.9 × 10⁶ | 11.5 × 10⁶ | — |
| Pure titanium | 7.3 × 10⁶ | 6.4 × 10⁶ | 5.9 × 10⁶ | 6.5 × 10⁶ | 43.47 |
| Uncoated Ti–1 wt% Ag | 3.63 × 10⁶ | 4.12 × 10⁶ | 2.91 × 10⁶ | 3.55 × 10⁶ | 69.13 |
| Coated Ti–1 wt% Ag | 1.67 × 10⁶ | 1.91 × 10⁶ | 2.6 × 10⁶ | 2.06 × 10⁶ | 82.08 |
| Antibiotic | 173 | 130 | 197 | 166.66 | 99.99 |
Displacement of titanium peaks in samples containing 1% silver, prepared using the SPS method at temperatures of 850 and 900°C_
| 2θ (°) | ||||
|---|---|---|---|---|
| CP Ti | Ti–1 wt% Ag 900°C – 30 MPa | Ti–1 wt% Ag 900°C – 10 MPa | Ti–1 wt% Ag 850°C – 30 MPa | Ti–1 wt% Ag 850°C – 10 MPa |
| 35.28 | 35.29 | 35.32 | 35.38 | 35.34 |
| 38.59 | 38.60 | 38.69 | 38.65 | 38.67 |
| 40.37 | 40.49 | 40.58 | 40.40 | 40.40 |
| 53.12 | 53.87 | 54.95 | 53.81 | 53.14 |
| 63.13 | 63.99 | 63.94 | 63.87 | 63.14 |
| 70.75 | 70.82 | 70.92 | 70.86 | 70.84 |
| 76.33 | 76.62 | 76.76 | 76.95 | 76.44 |
| 77.5 | 77.62 | 77.79 | 77.60 | 77.63 |