constant phase element energy-dispersive X-ray spectroscopy field emission scanning electron microscope Fourier-transform infrared (3-(4,5-dimethylthiazol-2-yl)-2,5-diphenyltetrazolium bromide poly-caprolactone resistance of an oxide layer charge transfer resistance solution resistance simulated body fluid scanning electron microscope spark plasma sintering X-ray diffraction
Currently, implants are among the most widely used parts in dentistry, which must have features such as fatigue resistance, high compressive strength, corrosion resistance, and biocompatibility. Also, dental implants must have Young’s modulus near the modulus of jawbone (17–20 GPa for cortical bone, 3–4 GPa for cancellous bone, and 110 GPa for titanium [1]) so that stress shielding does not occur and the bone does not deteriorate over time. To achieve this criterion, the porosity percentage of the implant should be similar to the jawbone’s porosity (5–13% for cortical bone and 30–90% for cancellous bone [1]). However, note that these porosities are different in each individual and between genders. Also, the percentages of bone porosities change with age. Therefore, considering the mechanical properties and application, an average percentage of porosity should be selected in such a way that the mechanical properties of the implant are not weakened, and the best value is about 20–25% [2]. If the implant has pores, not only does the Young’s modulus reduce, but it also increases the amount of bone formation and bone regeneration due to the passage of blood and nutrients [3,4].
Among the different methods of making dental implants, spark plasma sintering (SPS) is a new and fast technology. The whole process uses high speed and excellent uniformity without changing the powder characteristics [5,6]. In this method, pressure and temperature have significant roles in determining the density and grain size. Increasing the pressure leads to an increase in the micro hardness and better compaction of the sample; however, it causes the growth of grains [7]. Also, an increase in temperature causes an increase in diffusion throughout the sample and grain growth [6]. However, reducing the pressure and temperature causes higher porosity [6,7]. According to Falodun et al. [8], for the Ti6Al4V sample, made by SPS, by decreasing the sintering temperature from 1,000 to 800°C, the density decreased from 99.54 to 97.29%. Shi et al. [9] showed that, for titanium implants made by SPS, reducing the temperature from 1,000 to 800°C causes the porosity to increase from 2.25 to 22.91%.
Owing to its unique properties, titanium has been the best choice for making implants. Good corrosion resistance, biocompatibility, and high strength-to-weight ratio have made titanium the first choice for making implants [10,11]. Also, a TiO2 layer is quickly formed on the surface of a titanium implant, which prevents corrosion of the part [12]. In general, metal implants have high hardness, strength, and Young’s modulus rather than bone [3,13] (bending strength of the jawbone is 110–184 MPa, and compressive strength is 104–209 MPa [14]).
Despite desirable features of titanium implants, infection after implantation is one of the common problems that arises due to the lack of antibacterial properties of titanium [15]. As a result, dentists prescribe antibiotics, and in severe cases of infection, the implant is removed. In order to prevent the bacteria sticking to the implant surface, when the implant enters the tissue and comes into contact with the blood, it is necessary to have antibacterial properties on the implant surface. One way to achieve this property is to modify the surface, which can improve implant connection to the bone and accelerate the bone regeneration process [16,17,18,19]. One way to modify the implant surface is to coat it with polymers such as poly-caprolactone (PCL) [20,21,22,23]. Also, metallic elements, such as silver and copper, can be used to achieve this property [16]. It should be noted that the antibacterial properties of silver are stronger than copper, and even by adding 1% silver, antibacterial property is endowed to the alloy [24]. In order to achieve strong antibacterial properties in the copper–titanium alloy, at least 5 wt% of copper must be added, which leads to the formation of intermetallic Ti2Cu and affects the mechanical properties of the alloy [16,25,26]. However, silver is one of the desirable options, which reduces the possibility of infection after surgery, as well as having properties such as good machinability, good corrosion resistance, low melting temperature, and wettability between silver and titanium [27,28,29,30]. Kang et al. [31] studied the effect of sandblasting and acid etching of Ti–Ag alloy on its antibacterial properties. They used Ti-Ag alloy with 1, 2, and 4% silver. Results showed that sandblasting and acid etching increase the rate and amount of bone formation and increase mechanical adhesion between the bone and the implant. Also, they showed that the sample containing 2 wt% silver has a more antibacterial effect than 4 wt% silver. But it is not much different from the sample containing 1 wt% silver [31]. Chen et al. [32] studied the microstructure, mechanical properties, and antibacterial properties of Ti-Ag alloy. In this research, some parts were prepared with the ratios of 1, 3, and 5 wt% silver. The results of the hardness test indicated that the addition of 1 wt% silver can increase the hardness from 192 to 380 HV. However, adding more silver does not increase the hardness, even in samples containing 3 and 5 wt%, hardness decreases [32]. Shi et al. [33] investigated the effect of silver content on the antibacterial properties of Ti–Ag alloy. Results indicated that Ti–Ag alloy can have antibacterial effect even in small amounts of silver ions, and high amounts of silver can cause toxicity [33].
Based on these studies, it can be concluded that the best silver percentage to have dental implants with desirable mechanical properties is less than 3 wt%. Therefore, in the present study, titanium and silver powders were mixed in a ratio of Ti–1 wt% Ag.
The process consists of two stages. In the first stage, the precursor was pure titanium powder (99.98%; Ti-Grade 4 Merck 112379) with a size of less than 150 µm and pure silver powder (Sigma Aldrich 327093) with a size of less than 5 µm. In the second stage, in order to coat the parts, PCL in the form of granules with a molecular weight of 65,000 (Sigma Aldrich 181609), chloroform, titanium butoxide with 97% purity (Merck 244112), 99.8 wt% 1-butanol solution (BuOH), and glacial acetic acid were used. An acidic mixture of 40 wt% HF:HNO3:H2O was used for etching the parts.
In the first stage, porous parts of titanium and silver were made by the SPS at two different temperatures and pressures. Then, the porosity percentage and mechanical properties of the samples were measured. The parts were then etched and coated with PCL, and biological properties were evaluated. To make the parts, titanium and silver powders were mixed in a ratio of Ti–1 wt% Ag in a Jar mill for 3 h (100 rpm, no balls). Then, parts were made using SPS (Model: Easy fashion-SPS 20-T10) at 850 and 900°Cat pressures of 10 and 30 MPa, a heating rate of 100°C/min, and a holding time of 5 min using a graphite mold. After preparing the samples, the obtained parts were sanded, polished, and various tests (X-ray diffraction [XRD], scanning electron microscope [SEM], etc.) were performed. For each test, three or four samples were used in order to calculate the average results and compare them statistically. In the second stage, after determining the optimal temperature and pressure, the acid etching process was performed with an acidic mixture of 40 wt% HF:HNO3:H2O for 20 min at ambient temperature. After acid etching, the acid reagent was gently absorbed with cotton. Then, these samples were washed in deionized water for 10 min and dried at room temperature [16]. In order to modify the surface, the biopolymer was placed in two states (etched and not etched) by combining sol–gel and immersion methods, according to Catauro et al. [22]. Organic–inorganic hybrid materials based on TiO2/PCL were synthesized using the sol–gel method and used in the sol phase to coat the parts obtained from the first stage of the present study. To prepare the sol, first, a 5 wt% solution of PCL in chloroform was obtained by stirring at 300 rpm at 40°C for 2 h. To prepare the inorganic phase, under stirring, titanium butoxide was added to 1-butanol 99.8 wt% (BuOH), glacial acetic acid, and water. Acetic acid controls the hydrolytic activity of titanium alkoxide because it acts as a chelating agent. The molar ratios were TBT:H2O:BuOH HAc = 1:2:7.5:1.5. To obtain the hybrid system, the inorganic sol was added to a 10 wt% PCL solution in chloroform. This solution was kept at room temperature for 24 h. After the synthesis, the obtained sol was used to coat Ti–1 wt% Ag parts. It should be mentioned that, before coating, the substrates were washed with acetone in an ultrasonic bath and subjected to HNO3 65 wt%. Then, the SPS parts were placed inside this sol and removed from the sol at a speed of 100 mm/min. After dip coating, the coated samples were heat treated at 45°C for 24 h to densify the film with no polymer degradation. The flowchart diagram for research process is shown in Figure 1.

The flowchart diagram of the research process.
In order to check the properties and characteristics of the manufactured parts, such as the microstructure, morphology, strength, and hardness, various analyses were used. The analyses included phase analysis by XRD (Bruker, D8 ADVANCE, Germany) with device parameters of Cu-Kα, 1.54056 Å, and 40 kV. Also, microstructure examination using an optical microscope (OBN148 model, KERN, Germany), morphology examination, and pore size distribution using an SEM (TeScan-Mira III, Czech Republic). To evaluate the mechanical properties, the compressive strength test with the E9 ASTM-E9 standard was used along with a Universal Testing Machine (WDW-300 model, Jinan Chenda Testing Machine Manufacturing Co.) with a capacity of 30 tons. To determine the sample hardness, the Brinell hardness test was performed with ASTM-E92 standard (Rockwell & Brinell Hardness Tester, SHBRV-187.5F model, China) (HBW 2.5/187.5 (for each piece, at three points (30 s, 1,500 kg). Also, the Archimedes method was used to obtain the percentage of open pores. To investigate the bioactivity and ability to form an apatite layer, samples were immersed in a simulated body fluid (SBF) for 21 days at 37°C. To investigate the mutual effect between the components of this system, a Fourier-transform infrared (FTIR) device (SPECTRUM 100, Perkin Elmer Company, USA), with wavelength accuracy of 1 and 400–4,000 cm−1 range, was used. In order to observe the morphology of the compounds formed after placing the samples in SBF, a field emission scanning electron microscope (FE-SEM) (EM8000, KYKY Company, China) was used. Also, a contact angle measuring device was used to measure the wetting angle between the water and surface of the piece. The contact angle measurement or wettability test is used to determine the degree of hydrophilicity or hydrophobicity of a sample. If the contact angle is high, the sample is hydrophobic. Wettability is important because the degree to which one material is wetted by another is critical for the formation of secondary bonds [34]. To investigate the corrosion behavior, electrochemical tests were carried out based on the ASTM F3044 standard, related to the assessment of the galvanic corrosion potential of medical implants, and also the ASTM F2129 standard, related to titanium polarization. These tests were performed for pure titanium samples and titanium with 1% silver in two cases, with and without PCL coating. In this study, a three-electrode system, a synthetic saliva solution at ambient temperature, and an SGSTAT-204 Autolab Potentiostat/Galvanostat (made in the Netherlands) were used. Platinum foil, Ag/AgCl electrode, and fabricated alloy were used as auxiliary electrodes, reference electrode, and working electrode, respectively. The potentiodynamic polarization behavior of the samples was measured after immersion in the synthetic saliva medium, and the polarization plots were drawn with a scanning speed of 1 mV/s in the range of 0.25 to −0.25 V. Also, electrochemical impedance spectroscopy was recorded in the frequency range of 0.1 Hz to 100 kHz and in the potentiostatic signal range of 10 mV. Thereafter, the cytotoxicity of the coated parts was evaluated using the MTT method with 3T3 cells, and was reported as the percentage of cell viability under the coated and uncoated conditions. Finally, an antibacterial test was performed by using Enterococcus Faecalis 25922, and the efficiency of removing bacteria was calculated according to the following equation:
Equation (1) is used to calculate the percentage reduction of a substance, like bacteria, after a treatment process. CFU (colony-forming units) represents the number of viable microorganisms in a sample. CFU Ctrl. refers to the initial number of CFUs before the treatment process, and CFU T refers to the number of CFUs remaining after the treatment process.
The porosity of the samples was obtained by using the Archimedes method, and the results are shown in Table 1. As can be seen in this table, increasing the temperature and pressure in SPS decreased the porosity. Figure 2 depicts the pore size distribution of the parts made at 850°C and 10 MPa, and the average pore size is about 5 μm.
Porosity of the SPS samples.
| Pressure (MPa) | Temperature (°C) | Porosity (%) ±0.1 |
|---|---|---|
| 30 | 900 | 13.1 |
| 10 | 900 | 14.25 |
| 30 | 850 | 16.3 |
| 10 | 850 | 21.82 |
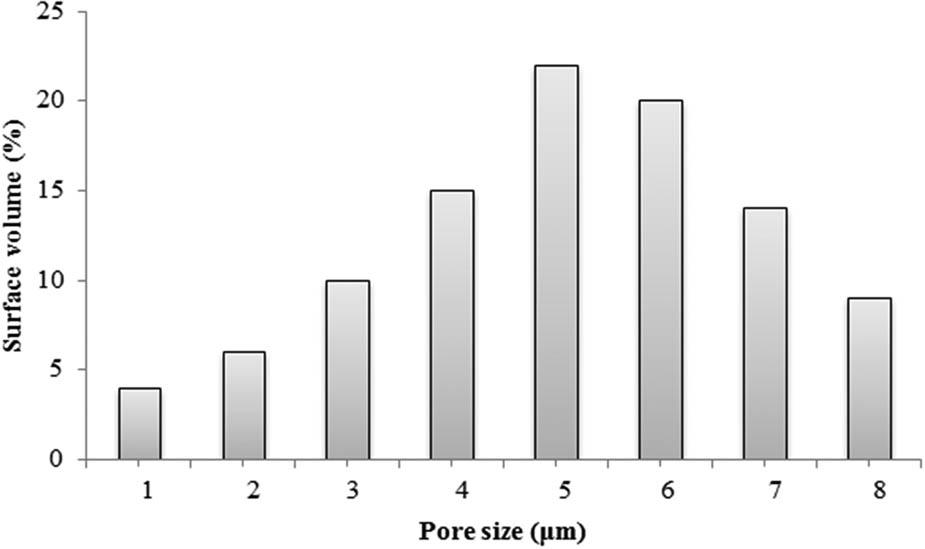
Pore size distribution histograms of the fabricated parts.
XRDs of the Ti–1 wt% Ag samples made at different SPS temperatures and pressures are comparatively shown in Figure 3. The Highscore plus X’Pert software was used to identify the phases from the XRD patterns. As shown, in the samples subjected to SPS operation, the addition of 1% silver to the titanium structure did not change the crystalline phase, and titanium with a hexagonal crystal structure and space group P63/mmc is the main phase of these samples. This indicates that silver is completely dissolved in the crystalline structure of titanium. To prove this, Table 2 shows the displacement of titanium peaks due to the dissolution of the silver. Comparison between diffraction peaks shows that the addition of silver to these samples changed the width and position of the peaks. Also, changing the pressure and temperature changed the intensity of the (002) peak.

XRD patterns of pure titanium and Ti–1 wt% Ag made by SPS at different pressures and temperatures.
Displacement of titanium peaks in samples containing 1% silver, prepared using the SPS method at temperatures of 850 and 900°C.
| 2θ (°) | ||||
|---|---|---|---|---|
| CP Ti | Ti–1 wt% Ag 900°C – 30 MPa | Ti–1 wt% Ag 900°C – 10 MPa | Ti–1 wt% Ag 850°C – 30 MPa | Ti–1 wt% Ag 850°C – 10 MPa |
| 35.28 | 35.29 | 35.32 | 35.38 | 35.34 |
| 38.59 | 38.60 | 38.69 | 38.65 | 38.67 |
| 40.37 | 40.49 | 40.58 | 40.40 | 40.40 |
| 53.12 | 53.87 | 54.95 | 53.81 | 53.14 |
| 63.13 | 63.99 | 63.94 | 63.87 | 63.14 |
| 70.75 | 70.82 | 70.92 | 70.86 | 70.84 |
| 76.33 | 76.62 | 76.76 | 76.95 | 76.44 |
| 77.5 | 77.62 | 77.79 | 77.60 | 77.63 |
Optical microscopic images of different samples are shown in Figure 4. A needle structure (two-dimensional, plate-like) of alpha-titanium with fine porosities is observed. However, the pores are so small that they cannot be seen well at this magnification.
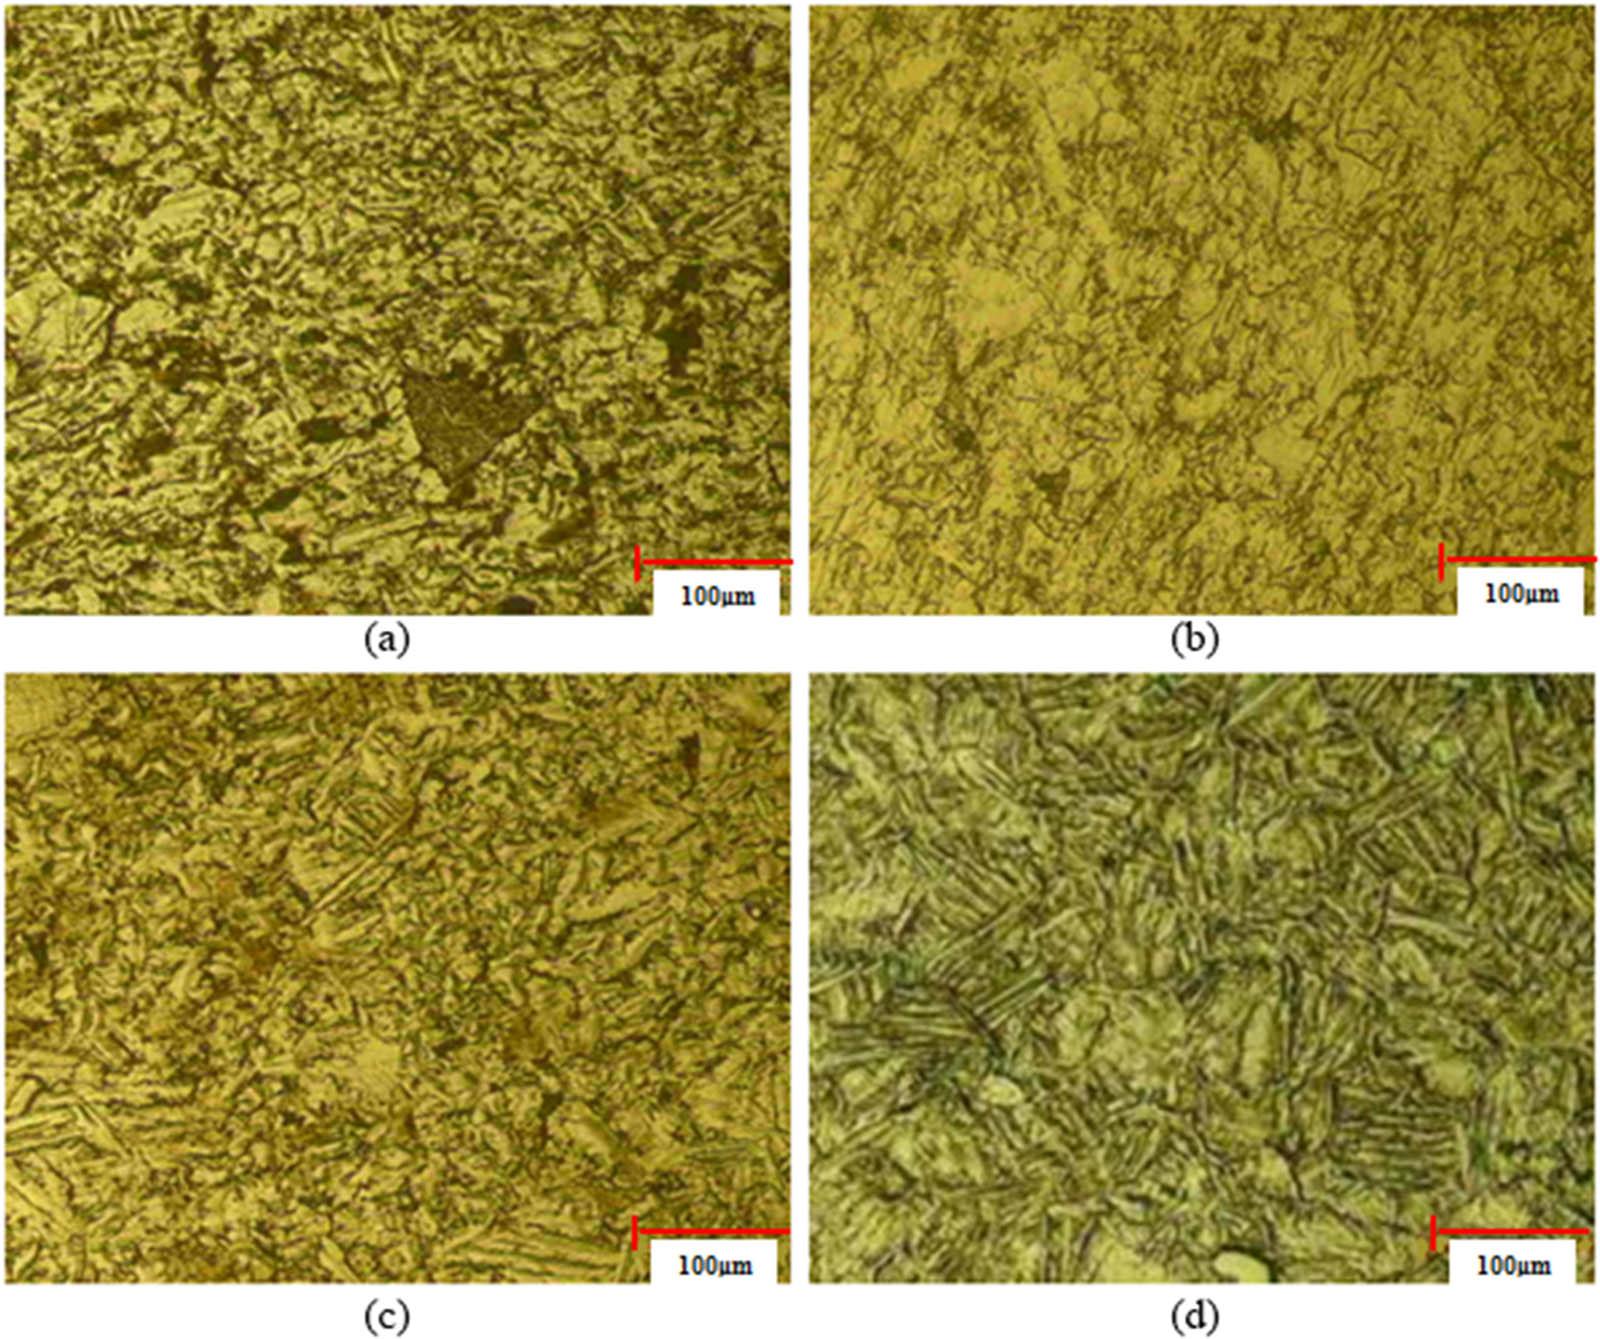
Optical microscopic images of the parts containing Ti–1 wt% Ag, prepared using SPS: (a) 850°C – 10 MPa, (b) 850°C – 30 MPa, (c) 900°C – 10 MPa, and (d) 900°C – 30 MPa.
In this section, the SEM images for SPS specimens made under different temperatures and pressures containing 1% silver (Figure 5) are discussed. As can be seen, very fine porosities (average 5 μm) with a morphology similar to that of interconnected spheres are distributed in the boundaries.

SEM images of samples containing 1% silver, prepared using SPS: (a) 850°C – 10 MPa, (b) 850°C – 30 MPa, (c) 900°C – 10 MPa, and (d) 900°C – 30 MPa.
The results of hardness tests are shown in Figure 6. By increasing the temperature and pressure in SPS, the hardness will increase due to the decrease in porosity.

Hardness of pure titanium and Ti–1 wt% Ag alloys prepared using SPS.
Since the yield point is an index of a material’s resistance to deformation, it is considered an important parameter for dental implants. Therefore, the compressive strength test was performed at ambient temperature to determine this parameter. Figure 7 shows the engineering stress–strain diagram for the samples prepared under different temperature and pressure conditions. As shown in Figure 7, the sample prepared at 900°C and 30 MPa has the highest strength, and the sample prepared at 850°C and 10 MPa has the lowest strength because this sample has the highest porosity compared to the others.
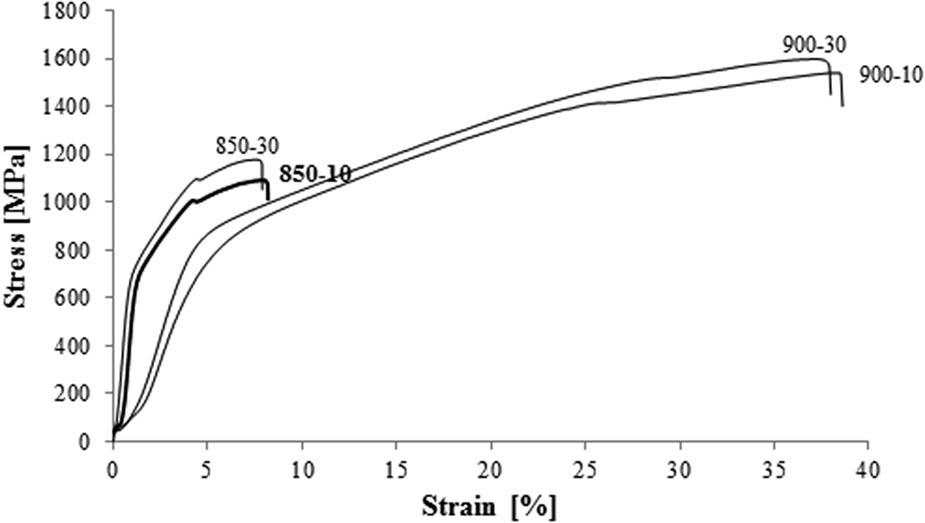
Engineering stress–strain diagram of samples containing 1% silver and prepared at different temperatures and pressures.
According to the results of the porosity, hardness, and pressure tests, it can be concluded that the optimal condition is Ti–1 wt% Ag specimen prepared at 850°C and 10 MPa. Therefore, this optimal sample was coated, and some experiments were performed.
In order to create pores on the surface and a more mechanical grip, the acid-etching process was performed on the optimal sample. The XRD image (Figure 8), the optical microscope image (Figure 9), and the SEM image of the optimal sample (Figure 10) are shown before and after etching. In all these images, it is clear that etching has no effect on the main elements and the microstructure.
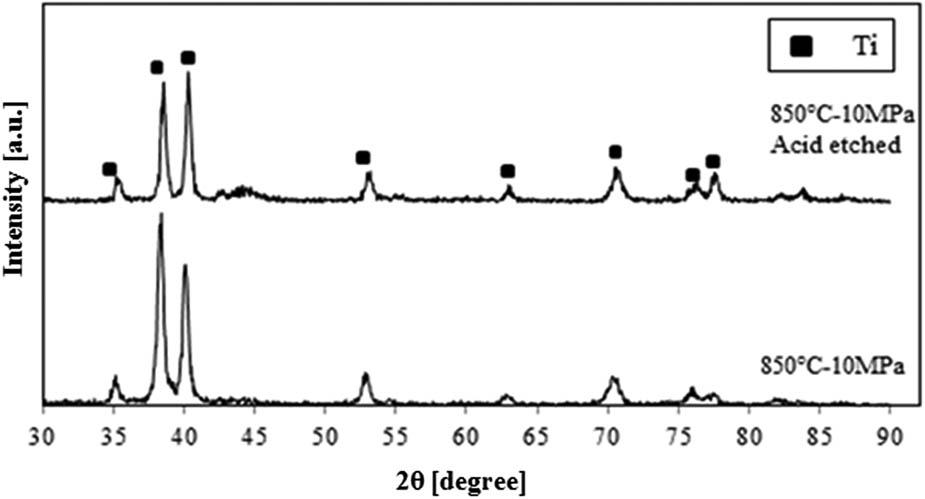
XRD image of the optimal sample in etched and non-etched states.

Optical microscopic image of the optimized sample: (a) etched and (b) non-etched states.
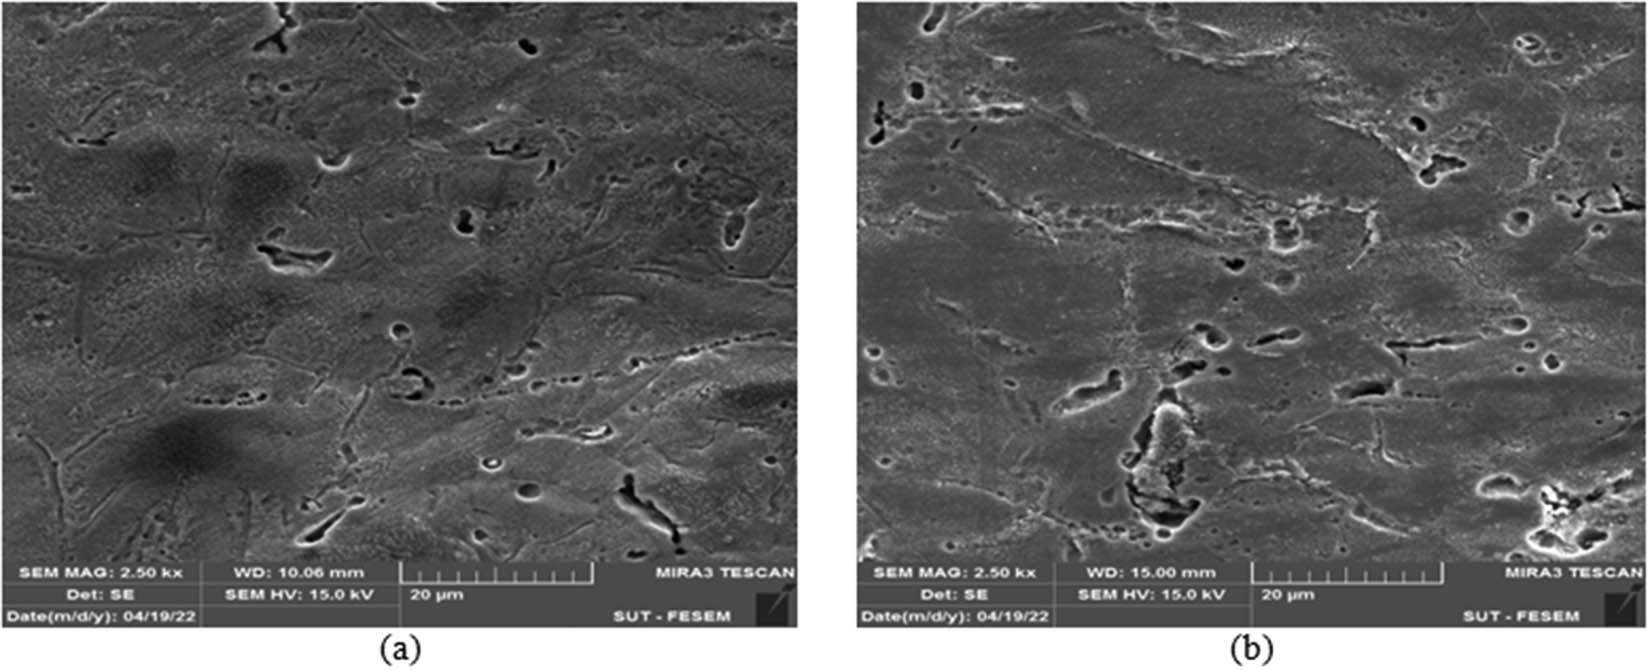
SEM images of the optimized sample: (a) etched and (b) non-etched samples.
After determining the optimal sample, the water contact angles on both etched and non-etched samples were measured (Table 3). As shown in the table, the etched sample prepared at 850°C and 10 MPa has the lowest contact angle and the highest wettability among the other samples. Then, the wettability test was performed for samples coated with PCL in both etched and non-etched conditions (Table 4). The results of this measurement showed that if the sample is not etched and then coated, the wettability is even lower than the uncoated samples. However, if the sample is etched and then coated with PCL, the wettability will reach the highest level.
Contact angles of samples prepared under different conditions.
| Pressure and temperature of SPS | Contact angle (°) |
|---|---|
| 900°C–30 MPa | 55.12 |
| 900°C–30 Mpa etched | 43.39 |
| 900°C–10 Mpa | 51.14 |
| 900°C–10 Mpa etched | 36.43 |
| 850°C–30 Mpa | 46.37 |
| 850°C–30 Mpa etched | 29.61 |
| 850°C–10 Mpa | 38.61 |
| 850°C–10 Mpa etched | 28.36 |
Contact angles for coated and uncoated samples.
| Pressure and temperature of SPS | Contact angle (°) |
|---|---|
| 850°C–10 MPa, non-etched | 38.61 |
| 850°C–10 MPa, etched | 28.36 |
| 850°C–10 MPa, non-etched and covered with PCL | 33.49 |
| 850°C–10 MPa, etched and covered with PCL | 24.45 |
The results of FTIR analysis of samples coated with PCL, before and after being placed in a SBF solution, are shown in Figures 11 and 12.
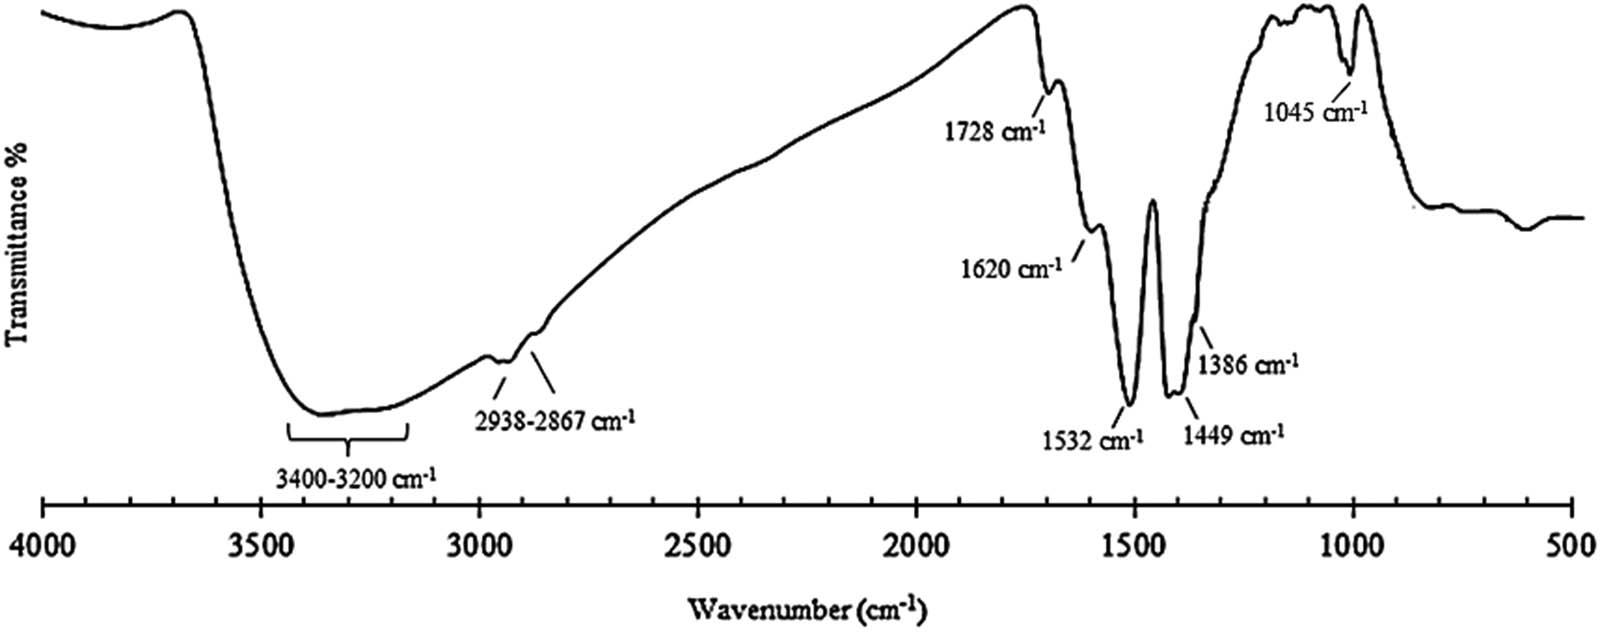
FTIR analysis results of the sample coated with PCL, before being placed in SBF.

FTIR analysis results of the sample coated with PCL, after being placed in SBF.
Before coating, FE-SEM images were obtained to investigate the distribution of elements. Figures 13(a–c) and 14(a–d) show the FE-SEM images, including backscattered, secondary, and distribution map for pure titanium and Ti–1 wt% Ag specimens.

FE-SEM images of pure titanium: (a) secondary electron, (b) backscattered, and (c) distribution of titanium.

FE-SEM images of Ti–1 wt% Ag: (a) secondary electron, (b) backscattered, (c) distribution of silver, and (d) distribution of titanium.
In addition, after coating, the FE-SEM images were obtained to investigate the coated surface before and after being placed in SBF. For this purpose, Figures 15 and 16 show the FE-SEM and energy dispersive X-ray spectroscopy (EDS) images, respectively, and Table 5 shows the elemental analysis for the coated sample before and after being placed in SBF. The morphology of the coating and the elemental analysis of the coating, which includes titanium oxide, are shown in Figures 15 and 16 and Table 5, respectively.

FE-SEM images of the coated sample before being placed in SBF: (a) 1000* and (b) 7500*.
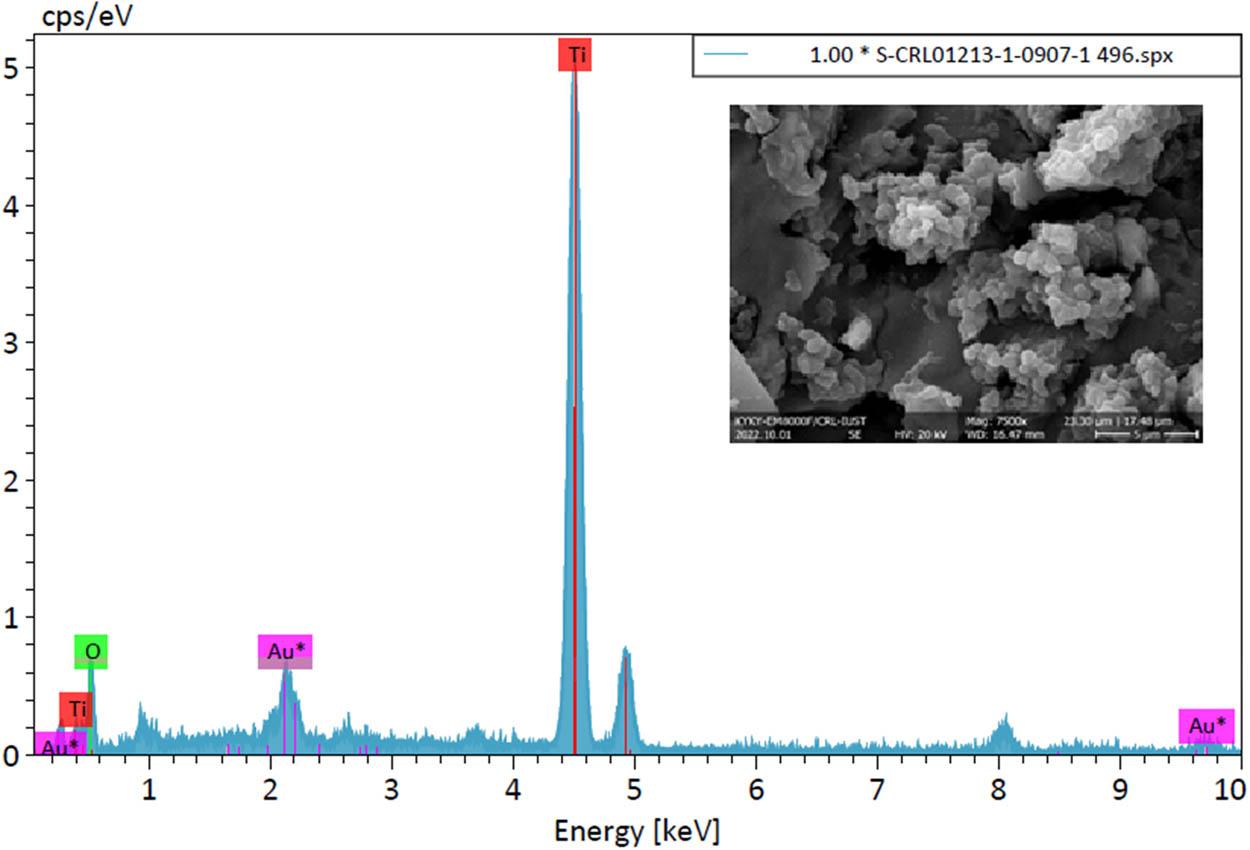
EDS analysis of the coated sample before being placed in SBF.
Elemental analysis of the coated sample before being placed in SBF.
| Element | Atomic number | Net counts | Mass (%) | Mass normalized (%) | Atom (%) | Absolute error (%) | Relative error (%) |
|---|---|---|---|---|---|---|---|
| Ti | 22 | 6,804 | 55.89 | 64.15 | 37.42 | 1.76 | 3.14 |
| O | 8 | 387 | 31.23 | 35.85 | 62.58 | 9.50 | 30.42 |
| Sum 87.12 | 100.00 | 100.00 |
Figures 17 and 18 show the FE-SEM and EDS images, respectively, and Table 6 shows the elemental analysis for the coated sample after being placed in SBF. As shown in Figure 17, after placing the samples in SBF, the fine particles of calcium phosphate compounds with spherical morphology appeared on the coated surface. Figure 18 and Table 6 confirm the presence of calcium and phosphorus.
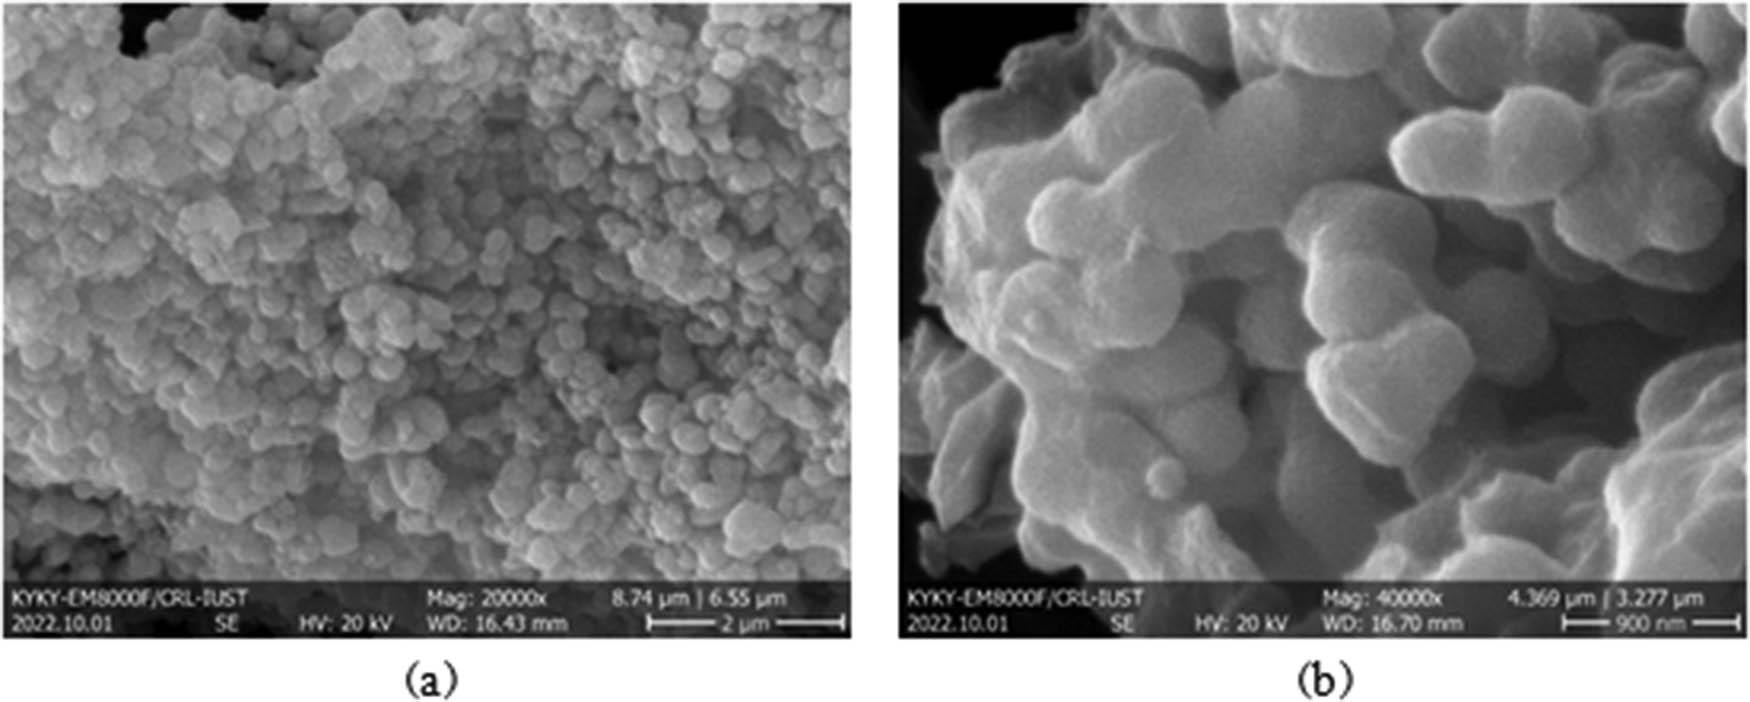
FE-SEM image of the coated sample after being placed in SBF: (a) 20000* and (b) 40000*.
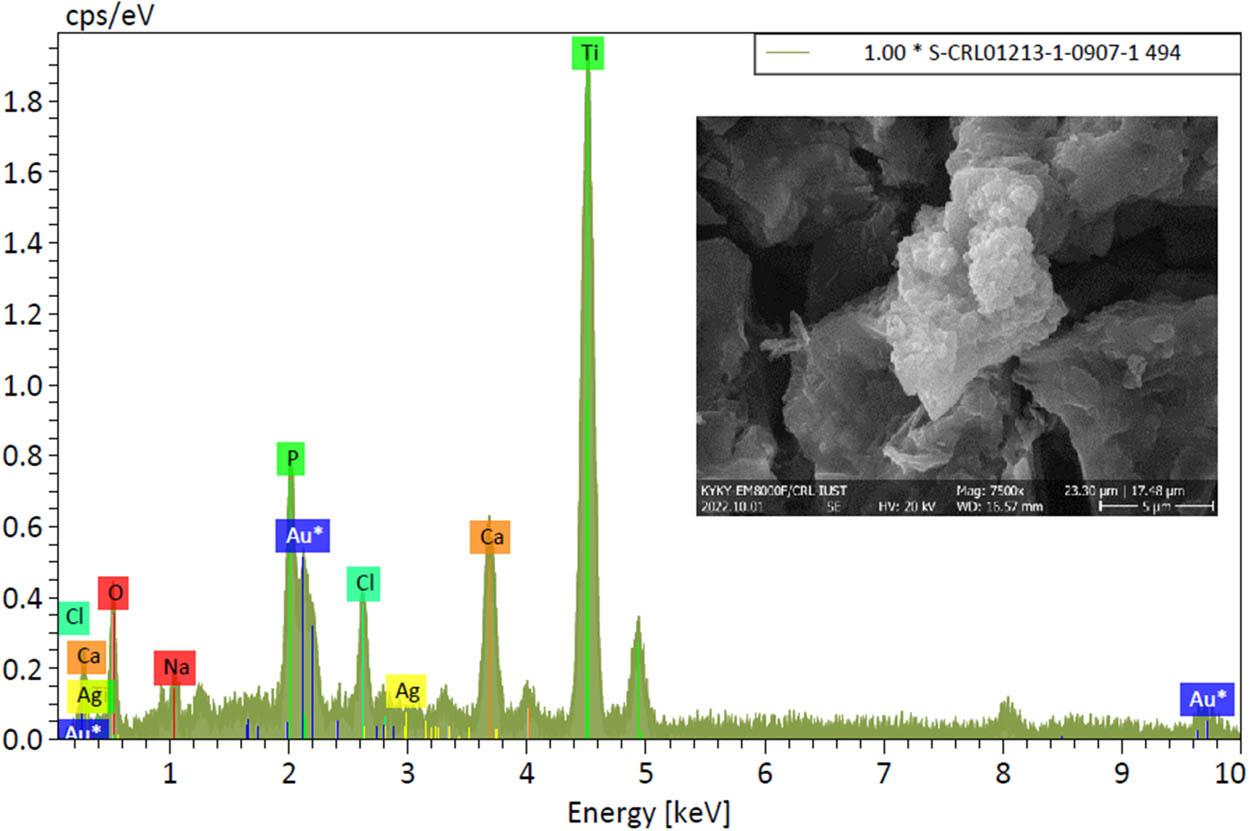
EDS analysis of the coated sample after being placed in SBF.
Elemental analysis of the coated sample after being placed in SBF.
| Element | Atomic number | Net counts | Mass (%) | Mass normalized (%) | Atom (%) | Absolute error (%) | Relative error (%) |
|---|---|---|---|---|---|---|---|
| Ti | 22 | 14,838 | 30.83 | 49.08 | 28.30 | 0.93 | 3.00 |
| O | 8 | 1,194 | 21.27 | 33.85 | 58.41 | 4.61 | 21.69 |
| Ca | 20 | 3,856 | 5.89 | 9.38 | 6.64 | 0.23 | 3.90 |
| P | 15 | 2,106 | 2.28 | 3.63 | 3.24 | 0.14 | 5.93 |
| Cl | 17 | 1,612 | 1.5 | 2.38 | 1.85 | 0.09 | 6.21 |
| Na | 11 | 361 | 0.87 | 1.39 | 1.67 | 0.11 | 12.93 |
| Ag | 47 | 106 | 0.19 | 0.3 | 0.08 | 0.05 | 24.5 |
| Sum 62.82 | 100.00 | 100.00 |
In Figure 19, an equivalent circuit, corresponding to the Nyquist plots of the prepared alloy, is presented. Also, the fitting results obtained for pure titanium and Ti–1 wt% Ag, by the proposed equivalent circuit, are summarized in Table 7 and Figure 20. The R S, R COX, and R ct values obtained for Ti–1 wt% Ag (111.8 Ω, 2.53 × 10¹⁵ Ω, and 3.32 × 10¹⁸ Ω) are higher than those for pure titanium (106.2 Ω, 1.7 × 10¹⁵ Ω, 1.31 × 10¹⁸ Ω), which indicates the positive effect of silver addition.
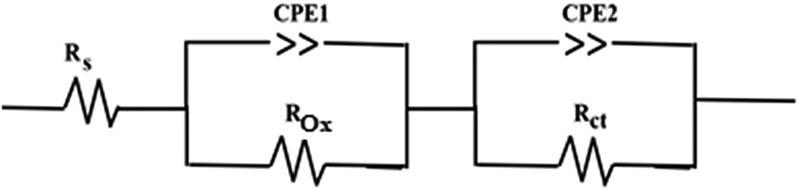
Equivalent circuit.
Parameters obtained from Nyquist plots.
| R ct (Ω) | CPE (Ω) | R cox (Ω) | CPE (Ω) | R s (Ω) | |
|---|---|---|---|---|---|
| Pure Ti | 1.31 × 10¹⁸ | 0.352 × 10⁻³ | 1.7 × 10¹⁵ | 0.589 × 10⁻³ | 106.2 |
| Ti–1 wt% Ag | 3.32 × 10¹⁸ | 2.927 × 10⁻³ | 2.53 × 10¹⁵ | 1.123 × 10⁻³ | 111.8 |

Nyquist plots for pure titanium and Ti–1 wt% Ag.
In addition, the comparison of corrosion behavior for Ti–1 wt% Ag for the two cases (coated and uncoated) is presented in Figure 21 and Table 8. It can be seen clearly that the presence of the coating has led to improvement of corrosion behavior, and the values increased from 111.8 Ω, 2.53 × 10¹⁵ Ω, and 3.32 × 10¹⁸ Ω for uncoated parts to 115.4 Ω, 3.431 × 10¹⁵ Ω, and 4.177 × 10¹⁸ Ω for the coated samples.

Nyquist plots for Ti–1 wt% Ag in coated and uncoated samples.
Parameters obtained from Nyquist plots for Ti–1 wt% Ag in coated and uncoated samples.
| R ct (Ω) | CPE (Ω) | R cox (Ω) | CPE (Ω) | R s (Ω) | |
|---|---|---|---|---|---|
| Ti–1 wt% Ag, coated | 4.177 × 10¹⁸ | 2.361 × 10⁻³ | 3.431 × 10¹⁵ | 1.222 × 10⁻³ | 115.4 |
| Ti–1 wt% Ag, uncoated | 3.32 × 10¹⁸ | 2.927 × 10⁻³ | 2.53 × 10¹⁵ | 1.123 × 10⁻³ | 111.8 |
In order to determine the current density, the extrapolation method was used (Figure 22). This figure shows the polarization curves of pure titanium and Ti–1 wt% Ag in the synthetic saliva medium, which was investigated by corrosion resistance tests. The results of these tests are shown in Table 9.

Potentiodynamic polarization curves for pure titanium and Ti–1 wt% Ag.
Parameters obtained from potentiodynamic polarization curves for CP Ti and Ti–1 wt% Ag.
| E Corr (V) | I Corr (A/m2) | ß a (V) | ß C (V) | R p (Ω m2) | |
|---|---|---|---|---|---|
| Pure Ti | −0.030 | 0.028 | 2.56 | −0.245 | 4.37 |
| Ti–1 wt% Ag | −0.084 | 0.010 | 4.87 | −0.466 | 22.40 |
Figure 23 and Table 10 show the results of polarization curves for Ti–1 wt% Ag, with and without coating. As shown in the figure, the corrosion potential of the coated sample (0.018 mV) is higher than the corrosion potential for the uncoated specimen (−0.084 mV).

Potentiodynamic polarization curves for Ti–1 wt% Ag in coated and uncoated samples.
Parameters obtained from potentiodynamic polarization curves for Ti–1 wt% Ag in coated and uncoated samples.
| Ti–1 wt% Ag | E Corr (V) | I Corr (A/m2) | ß a (V) | ß C (V) | R p (Ω m2) |
|---|---|---|---|---|---|
| Uncoated | −0.084 | 0.010 | 4.87 | −0.466 | 22.40 |
| Coated | 0.018 | 0.002 | 0.243 | −0.106 | 40.87 |
The MTT test results as the percentage of cell viability are shown in Figure 24. Based on the results, the survival percentage of cells in the coated samples is higher than in the uncoated samples.

Cell viability in coated and uncoated samples.
Investigation of the antibacterial effect included five groups: (1) control (including bacteria), (2) pure titanium, (3) uncoated Ti–1 wt% Ag, (4) coated Ti–1 wt% Ag, and (5) witness group (antibiotic only). The number of formed colonies was calculated (Table 11), and according to equation (1), the efficiency of removing bacteria was 82.08% for the coated sample. As shown in Table 11, by placing the metal sample next to the bacteria for 24 h, the number of bacterial colonies decreased, which indicates the antibacterial properties of the sample.
Number of colonies in the antibacterial test.
| Group | Number of formed colonies | Efficiency of removing bacteria | |||
|---|---|---|---|---|---|
| 1 | 2 | 3 | Average | ||
| Bacteria | 14.2 × 10⁶ | 8.6 × 10⁶ | 11.9 × 10⁶ | 11.5 × 10⁶ | — |
| Pure titanium | 7.3 × 10⁶ | 6.4 × 10⁶ | 5.9 × 10⁶ | 6.5 × 10⁶ | 43.47 |
| Uncoated Ti–1 wt% Ag | 3.63 × 10⁶ | 4.12 × 10⁶ | 2.91 × 10⁶ | 3.55 × 10⁶ | 69.13 |
| Coated Ti–1 wt% Ag | 1.67 × 10⁶ | 1.91 × 10⁶ | 2.6 × 10⁶ | 2.06 × 10⁶ | 82.08 |
| Antibiotic | 173 | 130 | 197 | 166.66 | 99.99 |
Various studies have been conducted on titanium–silver alloy [16,30,31,32,33]. According to the literature results and comparing them with present research, it can be concluded that one of the advantages of the present study is that the percentage of silver has been selected in a way that intermetallic compounds such as AgTi2 were not formed because intermetallic compounds may reduce corrosion resistance [35,36]. Also, in the presence of a second phase, the effect of the particle size and dispersion on the properties of the part is discussed. In this study, the simultaneous effect of the biopolymer and antibacterial properties of silver was used to achieve the biological properties on the surface of dental implants. Moreover, silver is usually used to add antibacterial properties. However, in this study, by adding only 1% of silver, the antibacterial properties were obtained, and the sintering temperature was greatly reduced compared to the sintering temperature of pure titanium. Since the sintering temperature range of titanium (1,100–1,200°C) is much higher than the melting temperature of silver (961°C), during the sintering, molten silver wets the titanium particles and bonds them together. As a result, diffusion of silver atoms to form a solid solution with titanium causes Ti–Ag and Ti–Ti bonding. In fact, silver melt can create bonds in addition to the necking of titanium particles themselves; therefore, titanium was sintered at a lower temperature. Therefore, it can be concluded that by adding silver, the sintering temperature of titanium can be reduced and sintering can be facilitated.
The Archimedes test results have shown that the samples prepared using the SPS method at 850°C and 10 MPa have 20–25% porosity with an average size of 5 μm, which is the target of this research. Open pores in implants cause the migration of osteogenic cells to the surface of the part and ultimately cause bone growth and repair. Also, micro-porosities with dimensions of 0.1–5 μm increase the surface area and increase protein absorption [37].
XRD indicates that titanium is the main constituent phase (JCPDS No. 00-044-1294), comprising a hexagonal crystal structure and P63/mmc space group. According to Lei et al. [16], in samples with less than 5% silver, the AgTi2 phase does not form or is too low and cannot be detected by XRD. Also, according to the Hume–Rothery law, due to the similarity of atomic radii (silver: r =1.44 Å and titanium: r =1.47 Å, difference of <15%), along with their similar electronegativity and valence, mixing titanium and silver leads to the formation of a substitutional solid solution [38].
In SPS, the sparks (caused by the electric discharge) created between the powder particles rapidly increase the temperature of the sample and lead to instantaneous mass transfer (diffusion). When the spark occurs at the joint or in the gap between the powder particles, local heat causes an instant increase in the temperature to more than 1,000°C. The heat can cause evaporation of impurities and the surface of the powder particles. Immediately after this evaporation, the surface melting zone is created. These surface melting areas are pulled together through the flow of electrons plus vacuum and form the necking zone. Continuous increase in radiant heat and pressure causes the necking to gradually grow and expand. These radiations also cause plastic deformation on the surface of the powder particles. In fact, with the increase in temperature, the yield strength decreases, and plastic deformation of the particles causes the sample to become denser and reach high densities [39].
In SPS, there are two mechanisms for densification. First, it is assumed that the sparks between the powder particles can clean and activate the surfaces of powder particles, thereby increasing the mass transfer for sintering. In the second mechanism, plastic deformation of the particles causes the sample to become denser because the yield strength of the powder particles decreases significantly with the increase in temperature. Therefore, due to the low yield strength of titanium particles and the applied pressure, deformation is easy at temperatures above 400°C, and the role of electrical discharge in causing compaction (even if it occurs for conductive metal powders, including titanium) may be negligible [34,35,36,37,38,39].
The needle structure of alpha-titanium is shown in the optical microscopic images (Figure 4), which is the same structure as the goal of this study. However, it should be noted that in parts made at 850°C, this structure is thinner, smaller, and has higher pores. Also, it can be seen in the SEM images (Figure 5) that when the SPS pressure is increased from 10 to 30 MPa and the temperature from 850 to 900°C, the pores become much smaller and fewer. However, since the aim of this study is to have a dental implant with porosity of 20–25%, considering the mechanical properties, it can be concluded that samples made at 850°C and 10 MPa are more suitable.
The results of the hardness tests showed that the hardness of the titanium–silver alloy is slightly higher than pure titanium. Mixing titanium and silver leads to the formation of a substitutional solid solution, which increases the hardness and strength [32]. By increasing the temperature and pressure in SPS, the hardness did not change much, which is due to the porosity of the samples.
Considering the results of pressure and hardness tests and porosity measurements, it can be concluded that the sample made at 850°C and 10 MPa, without weakening the mechanical properties, has the closest compressive strength to the jawbone, and it is the optimal sample. Also, as shown in Figures 13 and 14, by comparing the secondary electron and backscattered images, it is clear that silver particles are not agglomerated, not deposited in the grain boundaries, spread throughout the sample, and form a solid solution.
As shown in Figures 8–10, etching does not affect the main elements or microstructure, and it was done only to create roughness on the sample surface. In fact, surface treatment is needed for a strong and durable connection between different surfaces because surface tension, surface roughness, and surface chemistry are affected by surface treatments [40]. As the surface roughness increases, the surface area also increases, and the material that is supposed to adhere to the substrate is trapped on the surface and creates a mechanical bond. Also, changing the surface chemistry leads to chemical bonding between the polymer and the metal oxide surface. Etching with acid also creates voids, decreases the wetting angle, increases the surface tension, and, as a result, increases the connection strength [41].
In this research, a wettability test was used to determine the degree of hydrophilicity or hydrophobicity. The results of this test showed that etching reduces the contact angle and, as a result, increases the hydrophilicity. Also, results of the wettability test on the samples coated with PCL showed that, if the sample is etched and then coated with PCL, the wettability will reach the highest level among all the samples.
In the case of PCL coating on a substrate, there are three general growth modes, based on the relative interactions between the particles and the substrate: Volmer–Weber, Stranski–Krastanov, and Frank–van der Merwe [42]. In the Volmer–Weber mode, also known as the island or rough mode, the interaction between the particles is stronger than the interaction between the particles and the substrate; therefore, instead of forming a continuous layer, the layer initially grows as islands or grains on the substrate [42,43,44]. As shown in Figure 15, the bonding of TiO2/PCL to the titanium substrate is Volmer–Weber. This growth mode is due to the increase in surface roughness and indicates a strong mechanical connection of the implant with the surroundings, which causes the adhesion of osteogenic cells and, as a result, increases the formation of new bone on the implant surface [31].
It may be assumed that by applying a coating, the surface porosity and the resulting properties are eliminated. Since the coating may not be durable and considering the mode the coating grows on the substrate (Volmer–Weber), the coating is not uniform (Figure 15). After placing the implant in the body, micropores open the way toward the substrate where the pores are present. In fact, the capillary tubes of the substrate pores can suck the water absorbed by the substrate and open the way down.
Figure 11 shows the FTIR results for the coated sample before being placed in SBF. In this figure, the −OH vibrations appear as a broad band in the 3,200–3,400 cm−1 region. The position and shape of that band suggest the presence of water (H2O) and OH groups attached to the Ti atoms. The peak at 1,620 cm−1 assigned to H–O–H bending confirmed the presence of water. The bands at 2,938 and 2,867 cm−1 are due to the asymmetric and symmetric stretching vibrations of the CH2 group in PCL, and the peak at 1,386 cm−1 is due to the C–H. Moreover, the stretching vibration related to the carbonyl group (C═O), which also belongs to PCL, is seen at 1,728 cm−1. The peaks at 1,530 and 1,449 cm−1 are related to the asymmetric and symmetric stretching vibrations of the carboxylic group. Also, in the spectra, 1,045 cm−1 is ascribed to O–C vibrations. At the end, the weak bands at wave numbers below 800 cm−1 are related to the Ti–O–Ti vibrations in the lattice [22,45,46].
Figure 12 shows the results for the coated sample after being placed in SBF for 21 days. In the FTIR spectrum of this sample, the broad band in the range of 3,200–3,400 cm−1 is related to the stretching vibration of –OH of the absorbed surface water. Also the water in the lattice structure of the sample and the bending vibration related to this bond is located at 1,620 cm−1. Moreover, the peaks placed in 2,938 and 2,857 cm−1 are related to the asymmetric and symmetric stretching vibrations of the C–H bonds in PCL. The peak located at 1,728 cm−1 is related to the stretching vibration of the C═O bonds in the structure of this polymer, and the peaks located at 1,530 and 1,450 cm−1 are related to the stretching vibration of the carboxylic groups. The peaks located at 1,385 and 1,350 cm−1 can also be related to the bending vibration of the C–H bonds of PCL. The stretching vibration of the C–O–C bonds in the PCL structure and the stretching vibration of the P–O bonds in the calcium phosphate structure deposited by SBF on the surface of the sample showed absorption peaks at 1,092 and 1,046 cm−1. Also, the peaks located at 960, 602, and 569 cm−1 are related to the stretching vibration of the P–OH bonds and the bending vibration of the P–O bonds of the deposited calcium phosphate [40,45,46]. It can be concluded from the FTIR test that after placing the samples in SBF for 21 days, calcium phosphate compounds were deposited on the surface of the samples. This was investigated by FE-SEM, and the fine particles of calcium phosphate compounds with spherical morphology were observed on the coated surface.
The nucleation of calcium phosphate compounds on the surface can be explained by the presence of Ti–OH groups on the surface. These groups, together with the Ca2+ ion, present in the fluid, increase the positive charges on the surface. Then, Ca2+ ions combine with the negative charge of phosphate ions and form non-stoichiometric calcium phosphate compounds [22].
The results of electrochemical research show that samples with high porosity are more susceptible to corrosion attack than samples with lower porosity [47]. The results in Table 7 and Figure 20 showed that the values of R S, RcOx, and Rct obtained for Ti–1 wt% Ag alloy were the highest resistance values compared to pure titanium, which is proof of the improvement of corrosion resistance with the presence of silver. In fact, in the Nyquist diagrams, the higher the slope, the greater the resistance to the corrosion phenomenon. As shown in Figure 20, the slope of the Ti–1 wt% Ag diagram is higher than that of pure titanium. This trend indicates that with the addition of only 1% silver, the corrosion resistance increases, and it performs better than pure titanium. As shown in Figure 22, Ti–1 wt% Ag has a lower corrosion current density than pure titanium, which is another proof of the good resistance of this material in the saliva medium due to the presence of silver.
Figure 21 shows that the addition of TiO2/PCL to the sample surface increases the corrosion resistance. Also, according to Figure 23, the presence of coating has led to a significant reduction in the corrosion current density and improved corrosion potential [48,49]. It is worth mentioning that titanium and its alloys are able to spontaneously create a dense and stable surface layer of titanium oxide, which is a barrier between the implant and the surrounding environment. The removal of this protective oxide layer due to wear can reduce the corrosion resistance [23].
Research has shown that titanium oxide with an anatase structure and TiO2/PCL coating layer can largely prevent the adhesion of bacteria without having negative effects on cells and can also stimulate apatite deposition [19].
As can be seen in MTT test results (Figure 24), the survival percentage of cells in the coated samples is higher than the uncoated ones. Also, by comparing the results of this test with those of Catauro et al. [22], it can be concluded that even the cell viability rate in the uncoated sample is favorable, and this characteristic has been improved by coating the sample.
Table 11 shows the number of formed colonies in the antibacterial test. It appears that the addition of silver creates an antibacterial effect, and the coating increases the percentage of bacteria removal efficiency. According to Shi et al. [33], the results of microstructural studies and XPS analysis showed that the antibacterial activity of the Ti–Ag alloy is controlled by the contact sterilization mechanism, and metal ion sterilization is not the main mechanism. Also, the Ti–Ag alloy, even in low amounts of silver, can show an antibacterial effect. In the mechanism of contact sterilization, when bacteria are in contact with silver on the surface of metals, silver ions can directly affect the protein membrane of bacterial cells and cause destruction of this membrane. As a result, through the ion channels, a small number of silver ions enter the bacteria and disrupt the normal physiological metabolism of the bacteria, eventually leading to bacteria death [33]. Also, in the case of PCL, the mechanism of action is that the TiO2/PCL particles can easily pass through the bacterial cell wall and destroy the structure of the cell membranes, affecting DNA and protein, leading to bacterial cell death [21]. Thus, both the parts produced from Ti–1 wt% Ag and the coating used in this study exhibit antibacterial properties.
-
In the parts produced by the SPS, no undesirable oxide phase was observed, and compared to the conventional titanium sintering methods, manufacturing temperature and duration were significantly reduced due to the presence of silver and the use of SPS.
-
Due to the similarity of silver and titanium atomic radii, and also considering the similarity of electronegativity and capacity of these two elements, mixing titanium and silver leads to a substitutional solid solution and, as a result, increases the hardness and strength of the sample.
-
Porosity and compressive strength of the sample made at 850°C and 10 MPa are closer to the porosity percentage and strength of the jawbone, which was the goal of this research.
-
Etching the parts creates voids on the surface and increases the wettability.
-
FTIR, FE-SEM, and EDAX tests showed that placing the samples in SBF for 21 days after coating caused precipitation of calcium phosphate compounds on the sample surface.
-
The corrosion resistance of Ti–1 wt% Ag is higher than that of pure titanium, and the presence of the coating led to a significant reduction in the corrosion current density.
-
Even in the uncoated state, the manufactured parts have cell viability, and in the coated state, this characteristic also improved.
-
The coated samples have antibacterial properties and were able to destroy 82.08% of surrounding bacteria within 24 h.
The limitation of the present study was the lack of a dynamic fatigue test because the fatigue test requires a sample with longer dimensions, and this sample model was not achievable with our SPS device.
For future studies, it is suggested to use other metals along with silver and titanium. Along with considering the silver and titanium particle sizes, in vivo testing can also be investigated.
Authors state no funding involved.
Study concept and design: Jafar Javadpour, Bijan Eftekhari Yekta, Golsa Mousavi; Acquisition of data: Golsa Mousavi; Analysis and interpretation of data: Golsa Mousavi, Jafar Javadpour, Hassan Saghafian; Drafting of the manuscript: Golsa Mousavi; Statistical analysis: Golsa Mousavi; Study supervision: Jafar Javadpour, Bijan Eftekhari Yekta, Hassan Saghafian.
Authors state no conflict of interest.
The data that support the finding of this study are available from the corresponding author upon reasonable request.