
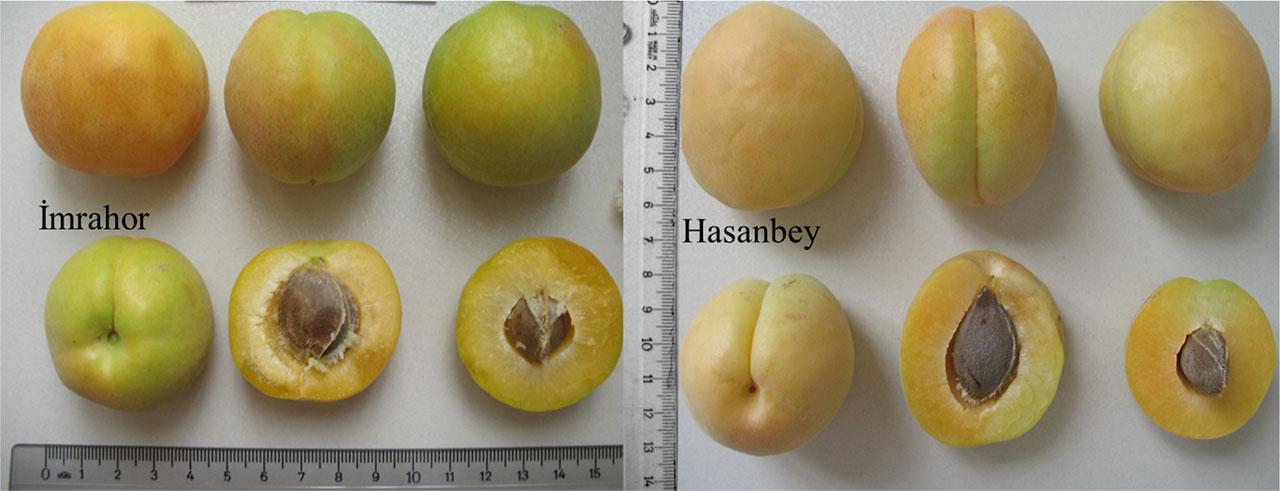
Fig. 1:
Fruit morphology of apricot cultivars ‘İmrahor’ and ‘Hasanbey’ showing whole fruits and longitudinal sections with pit characteristics.
Tab. 1:
Genetic parameters and heterosis analysis of total phenolic content and antioxidant activity in F1 apricot populations derived from reciprocal crosses between ‘İmrahor’ and ‘Hasanbey’.
| Combination | Trait | F1 | S | MP % | CV% | MPH % | HH% | LH% | n |
|---|---|---|---|---|---|---|---|---|---|
| İmrahor × Hasanbey | Phenolics | 805.13 | 95.23 | 1007.09 | 11.83 | −20.05 | 0.0 | 100.0 | 26 |
| Hasanbey × İmrahor | Phenolics | 762.22 | 138.12 | 1007.09 | 18.12 | −24.31 | 3.85 | 96.15 | 26 |
| İmrahor × Hasanbey | Antioxidant | 927.27 | 109.05 | 1074.38 | 11.76 | −13.69 | 3.85 | 80.77 | 26 |
| Hasanbey × İmrahor | Antioxidant | 723.94 | 105.28 | 1074.38 | 14.54 | −32.62 | 0.0 | 96.15 | 26 |
[i] F1 Mean: mean value of F1 generation; S: standard deviation; MP: mid-parent value; CV: coefficient of variation; Ta: genetic transmission ability; MPH: mid-parent heterosis rate; HH: over-high parent heterosis rate; LH: inferior-low parent heterosis rate; n: number of F1 individuals. Phenolics expressed as mg GAE·100g−1 FW; Antioxidant activity expressed as μmol TE·100g−1 FW.
Tab. 2:
Reciprocal cross effects on total phenolic content and antioxidant activity in F1 apricot populations.
| Pair | Trait | Mean (A×B) | Mean (B×A) | Δ(A×B−B×A) | p-value | cohen d | n(A×B) | n(B×A) |
|---|---|---|---|---|---|---|---|---|
| İmrahor↔Hasanbey | Phenolics | 805.1296 | 762.2215 | 42.9081 | 0.1989 | 0.3617 | 26 | 26 |
| İmrahor↔Hasanbey | Antioxidant | 927.2735 | 723.9404 | 203.3331 | 0.0 | 1.8971 | 26 | 26 |
Tab. 3:
Principal component analysis results for İmrahor × Hasanbey F1 population including parental cultivars.
| Component | Eigenvalue | Variance (%) | Cumulative Variance (%) | Variable | PC1 Loading | PC2 Loading |
|---|---|---|---|---|---|---|
| PC1 | 1.886 | 94.3 | 94.3 | Total Phenolic Content | 0.707 | 0.707 |
| PC2 | 0.114 | 5.7 | 100.0 | Antioxidant Activity | 0.707 | −0.707 |
Tab. 4:
Ranking of F1 individuals and parental cultivars based on composite scores from principal component analysis for İmrahor × Hasanbey cross combination.
| Germplasm No. | PC1 Score | PC2 Score | Composite Score | General Rank |
|---|---|---|---|---|
| A13 | 2.9557 | 0.4456 | 2.8127 | 1 |
| A15 | 2.1519 | 0.0377 | 2.0315 | 2 |
| A25 | 2.0432 | −0.0206 | 1.9256 | 3 |
| A19 | 1.9555 | 0.4006 | 1.8670 | 4 |
| A16 | 1.8089 | 0.0110 | 1.7065 | 5 |
| A12 | 1.3097 | −0.1847 | 1.2246 | 6 |
| A1 | 0.8789 | −0.1507 | 0.8202 | 7 |
| A2 | 0.6598 | −0.0444 | 0.6197 | 8 |
| A14 | 0.5781 | −0.0830 | 0.5404 | 9 |
| A23 | 0.5418 | −0.1714 | 0.5012 | 10 |
| A3 | 0.3787 | −0.0844 | 0.3523 | 11 |
| A5 | 0.3502 | 0.1175 | 0.3370 | 12 |
| A10 | 0.2125 | −0.2878 | 0.1840 | 13 |
| A7 | 0.0440 | −0.0062 | 0.0411 | 14 |
| A22 | −0.0567 | −0.3890 | −0.0756 | 15 |
| A21 | −0.2805 | −0.3733 | −0.2858 | 16 |
| A4 | −0.5104 | −0.2283 | −0.4943 | 17 |
| A26 | −0.5307 | −0.2630 | −0.5154 | 18 |
| A6 | −0.5546 | −0.2792 | −0.5389 | 19 |
| A24 | −1.1177 | 0.4253 | −1.0298 | 20 |
| A18 | −1.1401 | 0.6061 | −1.0406 | 21 |
| A9 | −1.1258 | −0.3510 | −1.0817 | 22 |
| A8 | −1.1864 | −0.0606 | −1.1223 | 23 |
| A17 | −1.4691 | 0.5805 | −1.3523 | 24 |
| A20 | −1.5967 | 0.4701 | −1.4790 | 25 |
| İmrahor | −1.8358 | −0.6429 | −1.7678 | 26 |
| A11 | −1.9991 | 0.6848 | −1.8462 | 27 |
| Hasanbey | −2.4655 | −0.1587 | −2.3341 | 28 |
Tab. 5:
Principal component analysis results for Hasanbey × İmrahor F1 population including parental cultivars.
| Component | Eigenvalue | Variance (%) | Cumulative Variance (%) | Variable | PC1 Loading | PC2 Loading |
|---|---|---|---|---|---|---|
| PC1 | 1.856 | 92.8 | 92.8 | Total Phenolic Content | 0.707 | 0.707 |
| PC2 | 0.144 | 7.2 | 100.0 | Antioxidant Activity | 0.707 | −0.707 |
Tab. 6:
Ranking of F1 individuals and parental cultivars based on composite scores from principal component analysis for Hasanbey × İmrahor cross combination.
| Germplasm No. | PC1 Score | PC2 Score | Composite Score | General Rank |
|---|---|---|---|---|
| Hasanbey | 3.0700 | 0.7995 | 2.91 | 1 |
| Imrahor | 2.5618 | 0.3956 | 2.41 | 2 |
| C21 | 2.4383 | 0.7978 | 2.32 | 3 |
| C19 | 1.6011 | −0.6838 | 1.44 | 4 |
| C25 | 1.1850 | −0.5548 | 1.06 | 5 |
| C15 | 1.0859 | −0.4054 | 0.98 | 6 |
| C26 | 0.9769 | −0.6281 | 0.86 | 7 |
| C12 | 0.9094 | −0.1008 | 0.84 | 8 |
| C18 | 0.7983 | −0.0175 | 0.74 | 9 |
| C24 | 0.5781 | −0.2296 | 0.52 | 10 |
| C10 | 0.3541 | −0.4773 | 0.29 | 11 |
| C13 | 0.1572 | −0.2589 | 0.13 | 12 |
| C16 | 0.1198 | −0.1498 | 0.10 | 13 |
| C6 | −0.0194 | 0.5163 | 0.02 | 14 |
| C14 | −0.2259 | −0.1204 | −0.22 | 15 |
| C22 | −0.5156 | 0.0026 | −0.48 | 16 |
| C3 | −0.6550 | 0.0167 | −0.61 | 17 |
| C2 | −0.6391 | −0.2524 | −0.61 | 18 |
| C17 | −0.7036 | −0.0701 | −0.66 | 19 |
| C23 | −0.8227 | −0.0886 | −0.77 | 20 |
| C8 | −1.1476 | 0.0981 | −1.06 | 21 |
| C20 | −1.1716 | 0.2047 | −1.07 | 22 |
| C11 | −1.3477 | 0.2690 | −1.23 | 23 |
| C1 | −1.4223 | 0.4341 | −1.29 | 24 |
| C5 | −1.5268 | −0.1465 | −1.43 | 25 |
| C7 | −1.5756 | 0.0775 | −1.46 | 26 |
| C9 | −1.8990 | 0.1497 | −1.75 | 27 |
| C4 | −2.1637 | 0.4225 | −1.98 | 28 |
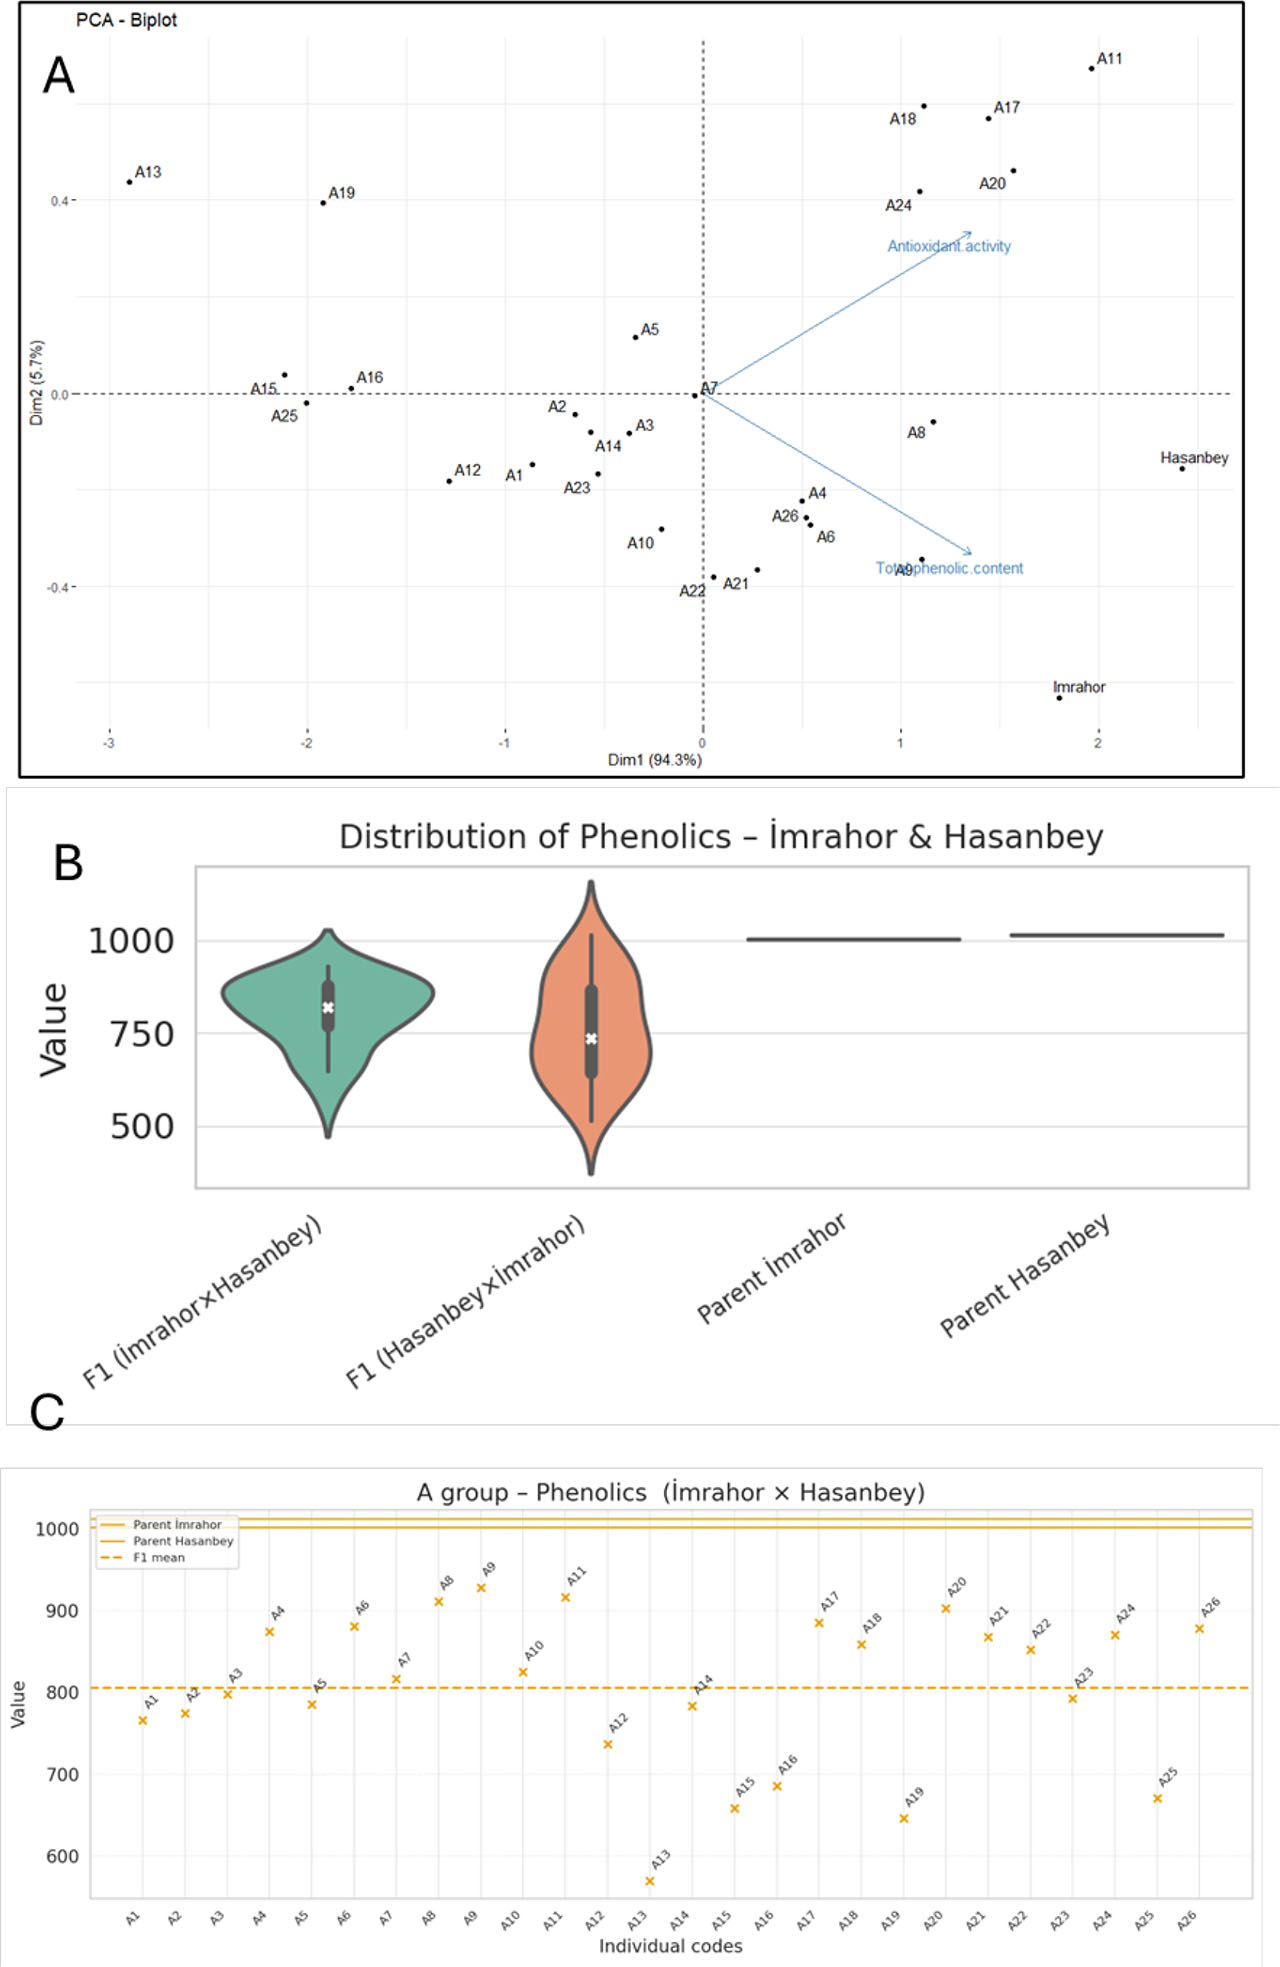
Fig. 2:
Distribution and comparative analysis of F1 individuals and parental cultivars for İmrahor × Hasanbey cross combination. (A) PCA biplot showing the distribution of genotypes in PC1-PC2 space. The parental cultivars ‘İmrahor’ and ‘Hasanbey’ are positioned in the lower right quadrant with negative composite scores. (B) Violin plots showing the distribution of total phenolic content in F1 (İmrahor×Hasanbey) and F1 (Hasanbey×İmrahor) populations compared to the two parental cultivars. (C) Individual ranking of all F1 genotypes and parents based on total phenolic content.
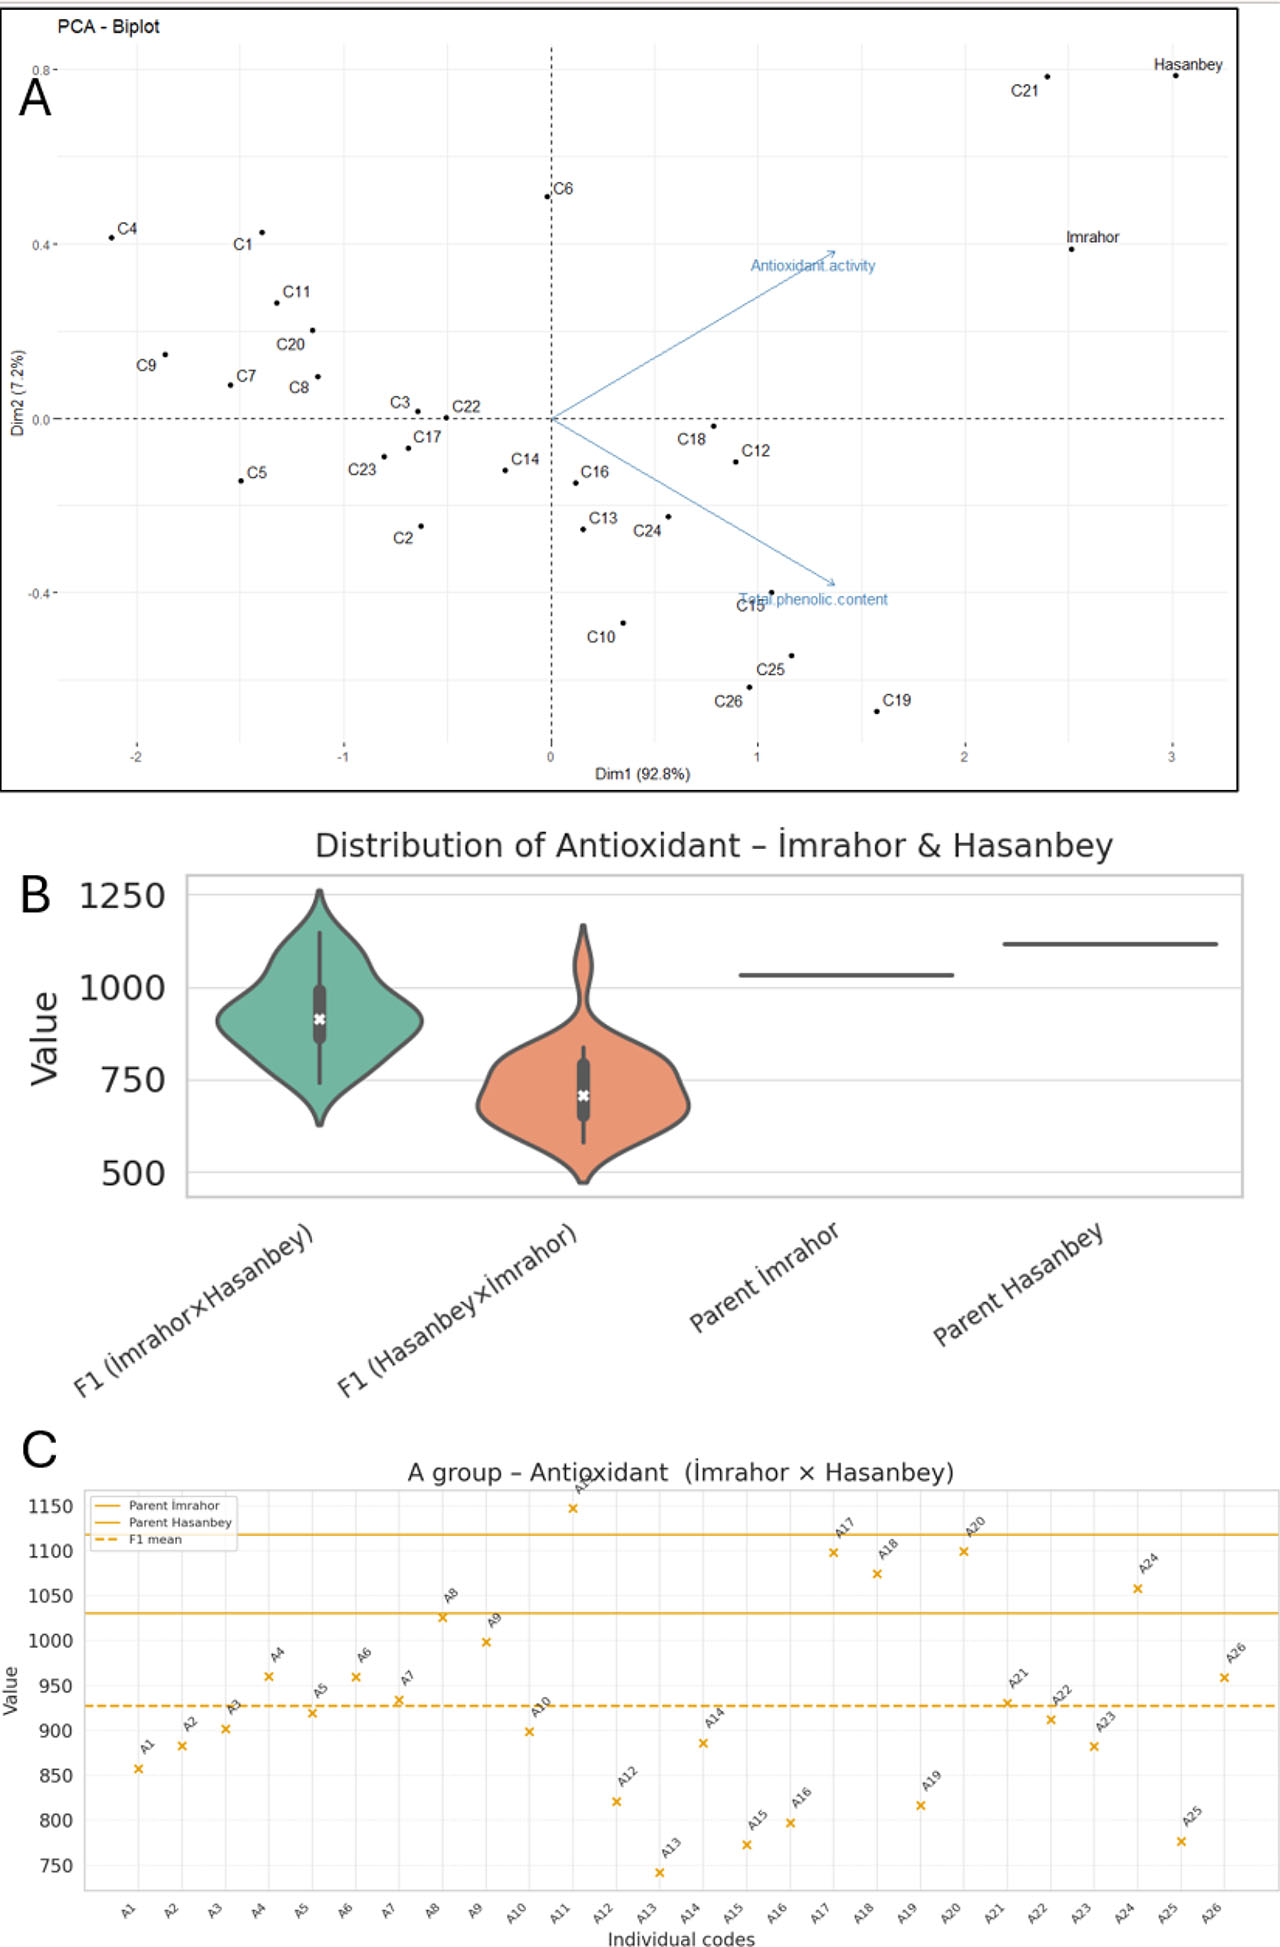
Fig. 3:
Distribution and comparative analysis of antioxidant activity in F1 individuals and parental cultivars for İmrahor × Hasanbey and Hasanbey × İmrahor reciprocal crosses. (A) PCA biplot showing the distribution of genotypes in PC1-PC2 space for Hasanbey × İmrahor cross. (B) Violin plots showing the distribution of antioxidant activity in both reciprocal F1 populations compared to the two parental cultivars. (C) Individual ranking of all F1 genotypes and parents based on antioxidant activity for İmrahor × Hasanbey cross.
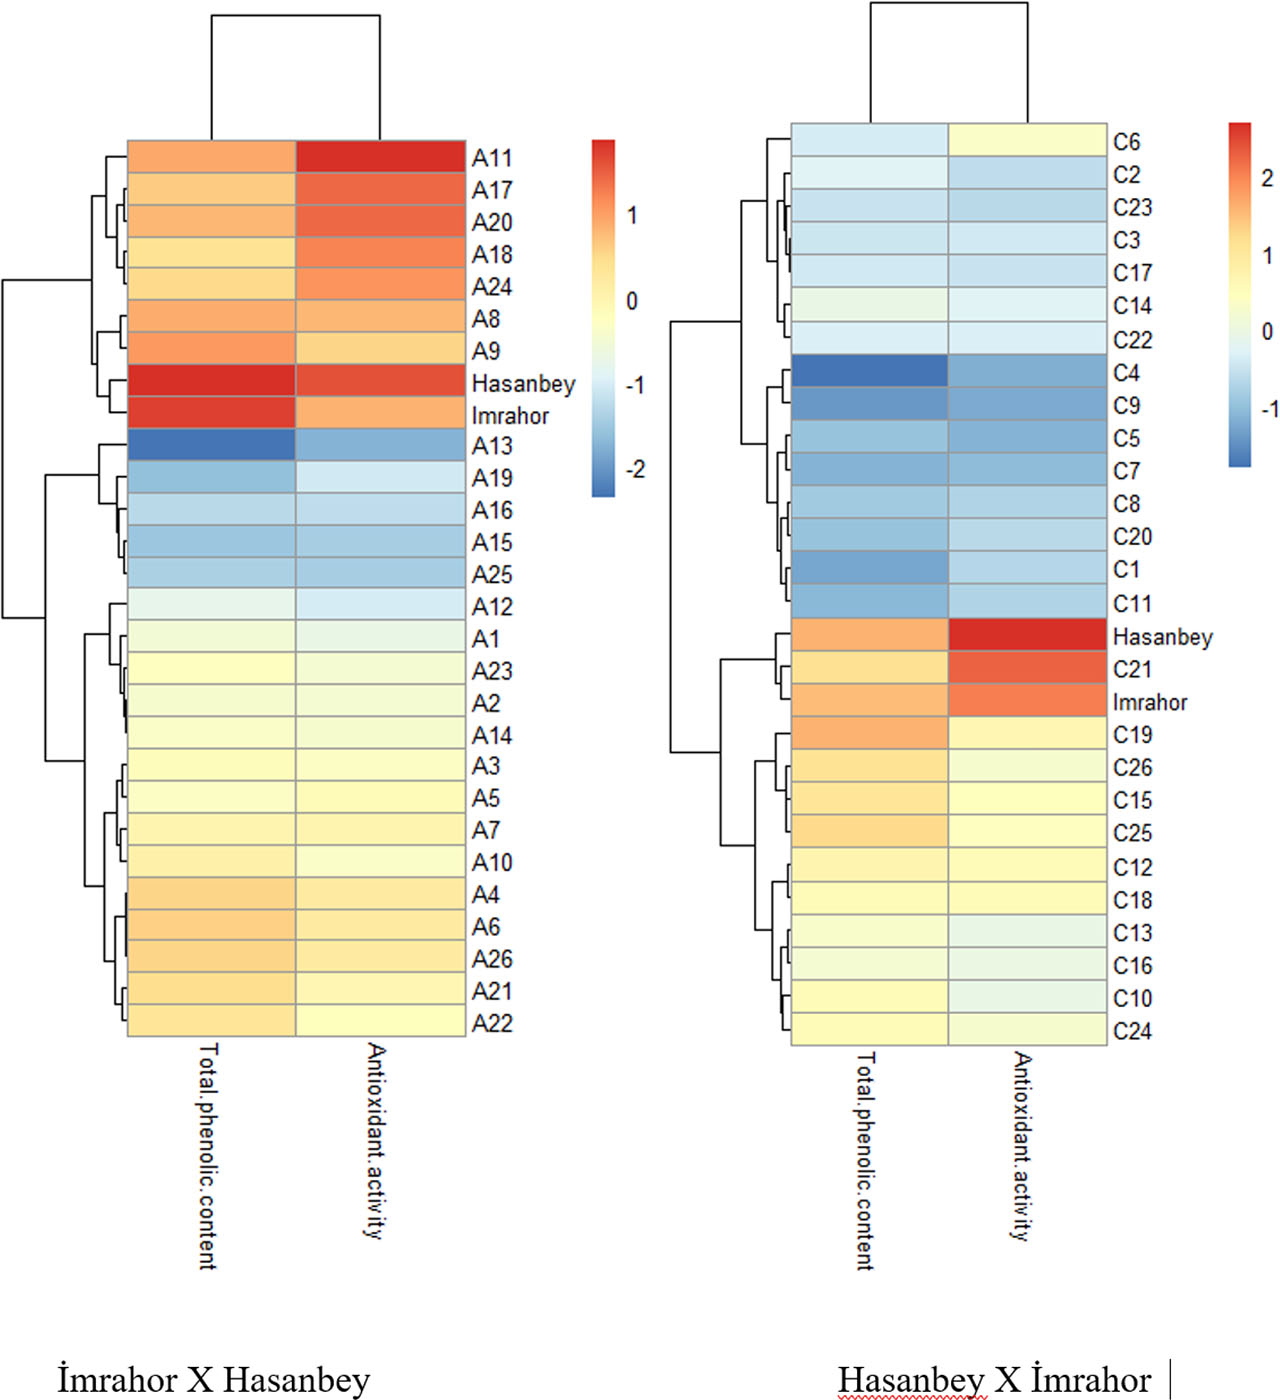
Fig. 4:
Hierarchical cluster heatmaps showing the standardized values of total phenolic content and antioxidant activity for F1 individuals and parental cultivars in both reciprocal crosses. Left panel: İmrahor × Hasanbey cross combination. Right panel: Hasanbey × İmrahor cross combination. Color intensity represents standardized Z-scores, with red indicating high values (positive Z-scores), yellow indicating intermediate values (near-zero Z-scores), and blue indicating low values (negative Z-scores).