
Fig. 1
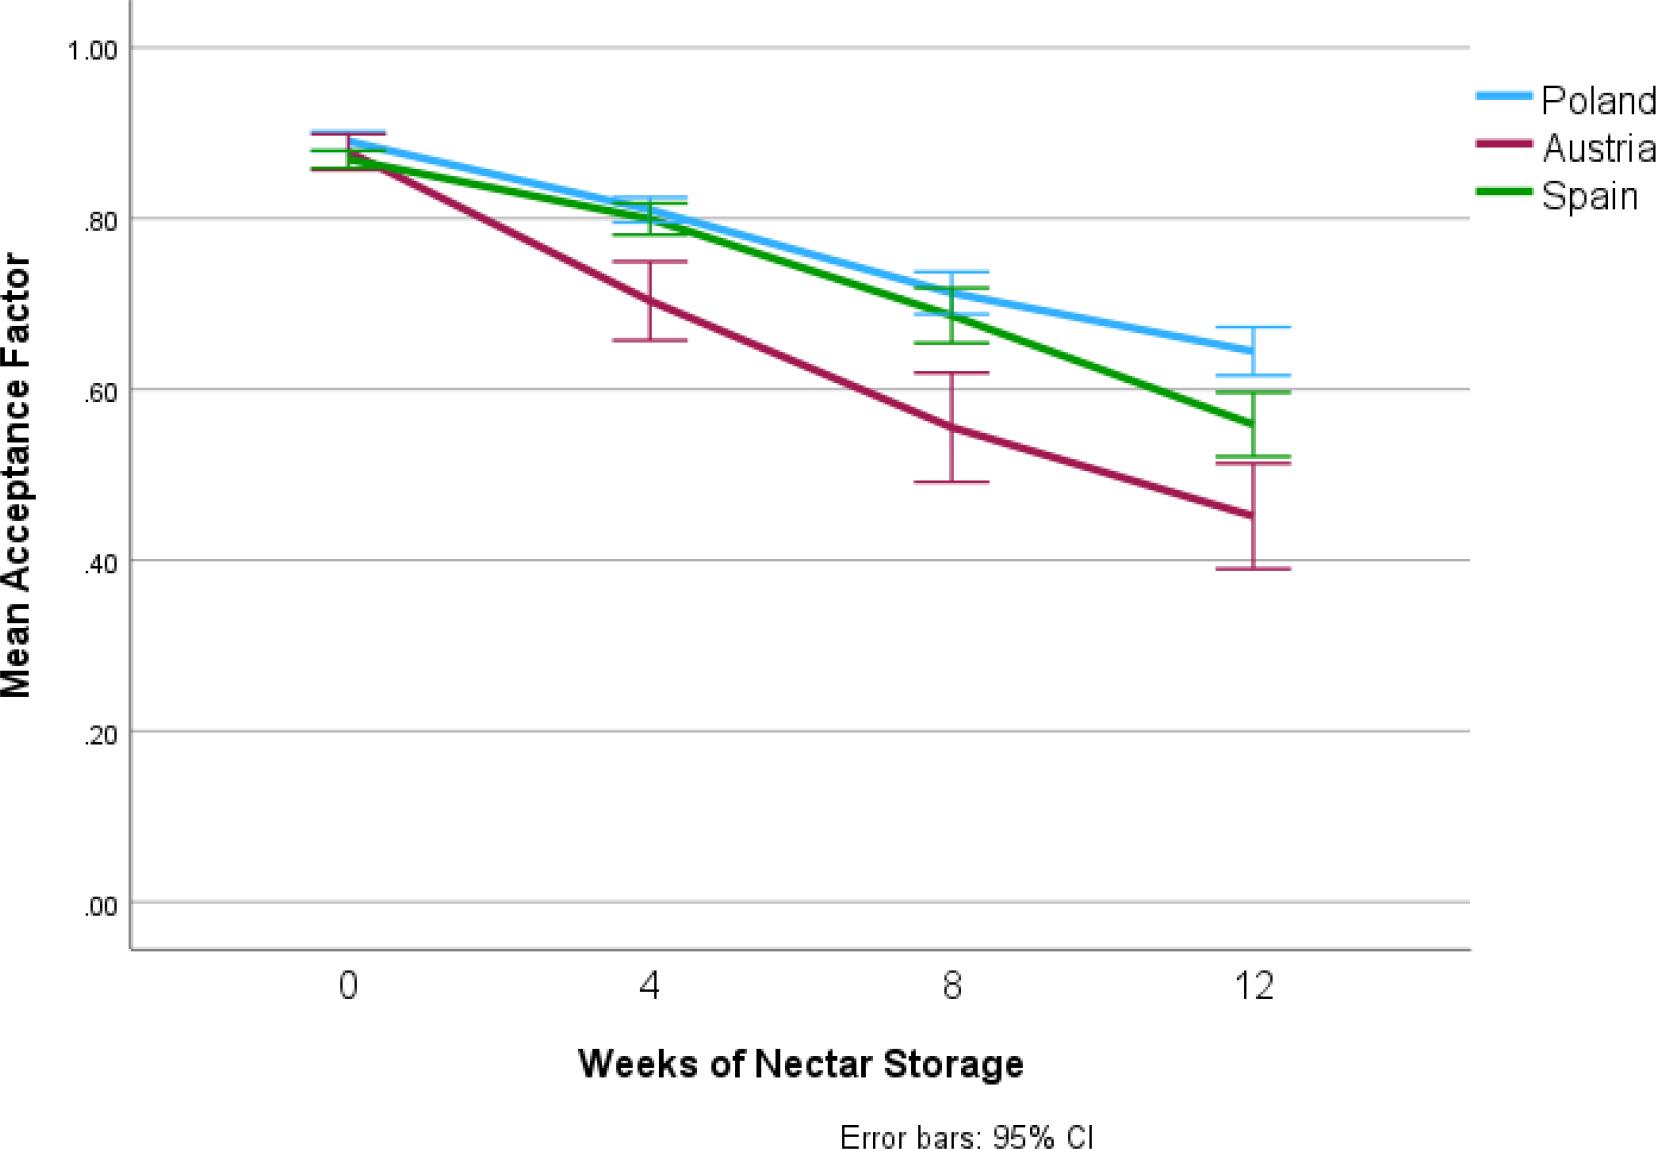
The mean and standard deviation of the Acceptance Factor (AF) on day of production and after 4, 8 and 12 weeks (AF0, AF4, AF8 and AF12 respectively) and the difference between AF0 and the Acceptance Factor at these points in time (D4, D8 and D12) of nectars produced from strawberries from different countries, and the mean and standard deviation of the total monomeric anthocyanin content expressed in pelargonidin-3-O-glucoside of these nectars_ Lower case letters denote significant differences (p < 0_05)_
| Country of Origin | AF0 | AF4 | AF8 | AF12 | D4 | D8 | D12 | Total Monomeric Anthocyanin Content [mg/kg pg-3-O-glu eqv] |
|---|---|---|---|---|---|---|---|---|
| Spain | 0.869 ± 0.030 a | 0.799 ± 0.054 b | 0.686 ± 0.095 b | 0.559 ± 0.111 b | 0.070 ± 0.045 a | 0.183 ± 0.090 a | 0.310 ± 0.107 a | 147.8 ± 41.2 a |
| Austria | 0.878 ± 0.050 a | 0.703 ± 0.109 a | 0.555 ± 0.151 a | 0.451 ± 0.146 a | 0.174 ± 0.100 b | 0.322 ± 0.151 b | 0.426 ± 0.086 b | 159.2 ± 54.8 a |
| Poland | 0.890 ± 0.032 a | 0.810 ± 0.041 b | 0.713 ± 0.068 b | 0.645 ± 0.079 c | 0.080 ± 0.038 a | 0.178 ± 0.072 a | 0.246 ± 0.086 a | 207.5 ± 32.4 b |
Mean and standard deviation of the Total Soluble Solids (in °Brix), Titratable Acidity (in g/L) and sugar/acid ratio of strawberries from different countries of origin_ Lower case letters denote significant differences (p < 0_05)_
| Country of Origin | Total Soluble Solids [°Brix] | Titratable Acidity [g/L] | Sugar/Acid Ratio |
|---|---|---|---|
| Spain | 7.7 ± 0.8 a | 8.0 ± 1.0 a | 9.7 ± 1.2 b |
| Austria | 8.4 ± 1.2 b | 8.1 ± 1.1 a | 10.5 ± 2.2 b |
| Poland | 7.2 ± 0.8 a | 9.1 ± 1.5 b | 8.1 ± 2.0 a |
Mean and standard deviation of the width, length and weight of strawberries from different countries of origin_ Lower case letters denote significant differences (p < 0_05)_
| Origin | Width [mm] | Length [mm] | Weight [g] |
|---|---|---|---|
| Spain | 31.50 ± 5.87 a | 39.69 ± 10.84 c | 16.84 ± 8.29 a |
| Austria | 32.49 ± 5.04 a | 32.87 ± 5.62 b | 15.93 ± 6.53 a |
| Poland | 32.66 ± 5.95 a | 30.31 ± 5.82 a | 15.23 ± 7.46 a |
Mean and standard deviation of the firmness and drip loss of strawberries from different countries of origin_ Lower case letters denote significant differences (p < 0_05)_
| Country of Origin | Firmness [Durofel Units] | Drip Loss [%] |
|---|---|---|
| Spain | 65.4 ± 15.2 b | 51.1 ± 5.9 a |
| Austria | 65.4 ± 11.4 b | 55.5 ± 6.0 b |
| Poland | 47.8 ± 17.5 a | 56.2 ± 5.9 b |