
Strawberry nectar is a popular beverage in many European countries, produced from strawberry puree blended with water, sugar and acid (Anon, 2014). When freshly manufactured, strawberry nectars have a bright red colour that is highly appealing to consumers. However, this initial colour is unstable and tends to degrade rapidly to brown, which consumers consider undesirable (Gössinger et al., 2009a; Buvé et al., 2018). This degradation results from the breakdown of anthocyanin compounds (Verbeyst et al., 2010; Martinez and Whitaker, 1995; Aguiló-Aguayo et al., 2009), particularly pelargonidin-3-o-glucoside, which is the predominant anthocyanin in strawberries (da Silva et al., 2007; Simkova et al., 2023b). Although processing conditions during nectar production strongly influence colour stability (Gössinger, et al., 2009b; Gössinger et al., 2009c; Howard et al., 2014; Lacey et al., 2023), the strawberry raw material plays a decisive role in determining the colour stability of nectars (Gössinger et al., 2010; Gössinger et al., 2009d) and other strawberry products (Diamanti et al, 2015; Teribia et al., 2021; Teleszko et al., 2016; Golaszewski et al., 1998).
Key factors such as cultivar, ripeness, harvest timing, and country of origin have been shown to impact the resulting nectars’ colour stability (Gössinger et al., 2010; Murray et al., 2024a). In particular, overripe strawberries harvested at the end of the season tend to yield nectars with the superior colour stability (Gössinger et al., 2010; Gössinger et al., 2009b).
Consequently, nectar producers would ideally source overripe strawberries of stable cultivars harvested late in the season. However, this is not feasible due to commercial constraints, which result in industrial processors typically having very little control over the strawberries they purchase. In many countries, such as Spain and Austria, strawberries are cultivated almost exclusively for sale in the fresh market. Those destined for processing into products, such as purees and nectars, are typically fruit rejected for fresh sale, due to imperfections in size, shape and colour (Anon, 2017). The high labour costs associated with hand-picking (for example, €1.22/kg in Austria (Wunderlich, 2025)) make strawberry cultivation specifically for processing prohibitively expensive. As a result, the cultivars grown in these regions are selected for their suitability for fresh consumption rather than processing. Moreover, strawberries intended for the fresh market are typically harvested at an earlier ripeness stage rather than at the optimal stage for processing to minimise transport damage and extend shelf-life (Murray et al., 2024a). As a result, processors in these countries have no control over, and limited knowledge of, the raw materials they receive. In contrast, in countries such as Poland, strawberries are also grown specifically for processing and are harvested at a riper stage. Processors in these regions often exert greater influence over cultivar selection and harvest timing, although this influence does not equate to full control over the cultivation process.
Previous research has found that the origin of strawberries has an effect on their colour stability (Gössinger et al., 2014) colour, and phenolic content (Krüger et al., 2009; Krüger et al., 2012). While the former study found that strawberries grown further south produced more colour stable nectars (Gössinger et al., 2014), and were more red (Krüger et al., 2012). The latter studies found that seasonal weather effects were more significant that latitude (Krüger et al., 2012), with different cultivars responding differently (Krüger et al., 2009). Additionally, different cultivation systems are favoured in different countries, with Hill plasticulture, which produces higher anthocyanin content (Wang et al., 2002), more prevalent in warmer climates.
Most scientific studies assessing nectar colour stability use strawberries of defined cultivars and ripeness stages (Gössinger et al., 2010; Murray et al., 2024a; Rincon et al., 2025). However, since industrial producers are unable to select the strawberries used for nectar production, these studies may not accurately represent the fruit used in industrial processing. Therefore, the current study aimed to investigate the characteristics of strawberries received by industrial processors in three European countries—Spain, Austria, and Poland—to assess inter-country differences in fruit quality and their impact on the colour stability of nectars. Multiple incoming strawberry batches were sampled at each location, analysed for physical attributes, and processed into nectar to evaluate differences in colour degradation during storage.
Strawberries were collected from industrial processing facilities in three European countries: Spain, Austria and Poland. In Spain (Almonte, Andalusia), nine 2 kg samples were taken from randomly selected incoming batches over three days (17–19 April 2023), during the peak of the Spanish strawberry season. All cultivars were unknown. Temperatures ranged from 12-30 °C, with no precipitation. The strawberries were analysed fresh, then frozen at -18 °C and were transported to Klosterneuburg. In Poland (Tomaszów Lubelski), eight 2 kg samples were collected from randomly selected batches delivered 19-21 June 2023. All cultivars were unknown, but from areas that predominately cultivate Honeoye. During this period, temperatures ranged from 10-27 °C, with 18 mm of precipitation. Strawberries were analysed fresh, frozen at -18 °C, and were shipped to Klosterneuburg on dry ice. In Austria, six batches were collected from an industrial nectar producer (Rögner) in Lower Austria 15-16 June 2023. All cultivars were unknown. Temperatures ranged from 10-25 °C, with no precipitation. These strawberries were delivered fresh to Klosterneuburg, analysed, and then frozen at -18 °C. All strawberries were kept frozen at -18 °C for < 3 months.
Frozen strawberries were defrosted for 24 hours at 20 °C, and then processed into puree by a rotor mill with 1mm sieve (Feuma, Gößnitz, Germany).
As described by Murray et al., (2023), purees were blended with water, citric acid and sugar to produce nectar with the following composition: 40% puree, 15 °Brix, 7.0 g/L Titratable Acidity. The mixture was homogenised using a hand blender (Philips, Drachten, Netherlands). A total of 140g ± 1g of nectar was filled into glass jars (212ml), sealed with screw lids, and pasteurised at 85 °C for 20 min in a water bath (Royal Catering, Berlin, Germany). Nectars were stored at 20 °C ± 3 °C in the dark.
Soluble solids (°Brix) was measured using a handheld refractometer (N-20, Brix 0~20%, ATAGO, Tokyo, Japan). pH-values were determined using a pH meter (MultilineP4, WTW, Weilheim, Germany) with a pH-electrode (SenTix 41-3, WTW, Weilheim, Germany). Titratable Acidity (TA) was determined by titration to an endpoint of pH 7.0 (0.1N NaOH Titrisol ®, Merck KGaA, Darmstadt, Germany) and expressed as g/L tartaric acid (conversion factor: 0.75). Sugar/Acid ratio was calculated by dividing the sugar content in °Brix by the acidity percentage (g/L acidity divided by 10) as described in Simkova et al. (2024). Firmness was measured by a Durofel DFT100 (Agrosta, Serqueux, France) penetrometer. From each batch, 30 fresh strawberries were measured on two sides of each fruit (60 measurements total). Values were expressed in Durofel Units, ranging from 0 (very soft) to 100 (very firm). Weight measurements were obtained by weighing 30 strawberries per batch on a balance (EW 4200-2NM, Kern & Sohn GmbH, Balingen, Germany). Size measurements were taken on 10 strawberries per variant, recording width at the widest point and length from step to tip using a digital calliper (Tchibo, Hamburg, Germany). Drip loss was calculated by placing a known weight of strawberries (frozen at -18 °C) into a funnel above a measuring cylinder. The strawberries were left at ambient temperature (20-25 °C) for 24 hours to allow liquid to drain into the cylinder. The weight of the collected drip was calculated, and drip loss expressed as a percentage (weight of drip/initial weight of strawberries * 100). Drip loss experiments were carried out in duplicate.
CIELAB colour components L* (lightness), a* (red-green), and b* (yellow-blue) were measured by a Minolta CM-5 spectrophotometer (spectrophotometric method, D65, 30mm 10°, reflection measurement, gloss excluded, Minolta, Osaka, Japan). C* (Chroma) and h° (hue angle) were calculated as described by Kammerer et al. (2007). Acceptance Factor (AF) was calculated as AF = a*/h° as described by Gössinger et al. (2009a). All nectars were measured after pasteurisation on the day of production. Each sample was measured in duplicate. Colour stability was quantified using different indicators of colour stability: AF4, AF8, AF12 represent the AF at 4, 8 and 12 weeks, respectively. D4, D8 and D12 are the difference in AF between the day of production and 4, 8 and 12 weeks, respectively, as described in Murray et al. (2023).
Total monomeric anthocyanin (TMA) content was determined using the pH differential method, as outlined in Lee et al., (2005). Absorbance was measured at 496 nm and 700 nm in two buffer systems: pH 1.0 (0.025 M KCl) and pH 4.5 (0.4M CH3CO2Na.3H2O) (Giusti & Wrolstad, 2001), using a spectrophotometer (Hach Lange DR 3900, Hach Lange, Düsseldorf, Germany). Results were expressed as mg of pelargonidin-3-O-glucoside equivalents per litre (mg/L) using the formula:
Statistical analysis was carried out using IBM SPSS 29 (Statistical Package for the Social Sciences). Significant differences (p < 0.05) between different countries for AF0, AF4, AF8, AF12, D4, D8, D12, Total Monomeric Anthocyanin content, Total Soluble Solids, Titratable Acidity, sugar/acid ratio, width, length, weight, firmness and drip loss, were performed by Analysis of Variance (ANOVA) followed by Tukey-HSD. Pearson correlations were determined between colour parameters AF0, AF12, D12 and anthocyanin content, sugar/acid ratio, firmness and drip loss to determine if these parameters were significantly (p < 0.05) correlated with colour and colour stability. r values of -0.49 – 0.49 were considered weak, and above 0.5 and below -0.5 were considered strong. Pearson correlations were also determined between size parameters and anthocyanin content to determine if there was any relationship between these parameters.
Fig. 1 illustrates the degradation of nectar colour for different countries of origin during storage, as measured by the Acceptance Factor (AF). Tab. 1 presents the AF values at specific time points, and the corresponding colour stability, calculated as the difference between AF0 and the AF at these time points (D4, D8 and D12). There was no significant difference in initial AF (AF0) between nectars produced from strawberries from different countries of origin, indicating that all countries produced nectars with comparable initial acceptance. However, after 12 weeks, differences in stability resulted in significantly different Acceptance Factors (AF12). Nectars produced from Austrian strawberries had the lowest AF12, followed by those produced from Spanish strawberries, while nectars made from Polish strawberries had the highest mean AF12. Thus, Polish strawberries produced nectars that proved most acceptable after storage, and consequently had the longest shelf-lives. The difference between AF0 and AF12 (D12) serves as a measure of colour stability. Nectars produced from Austrian strawberries were the least stable, having a significantly higher D12. In contrast nectars produced from Polish strawberries had the lowest D12, with no significant difference between these nectars and those produced from Spanish strawberries. Therefore, strawberries grown in Poland were the most suitable for production of colour stable nectars. This was in contrast to previous studies, that had found that strawberries grown further south were more colour stable (Gössinger et al., 2014), suggesting that the latitude of where fruits are grown is not the most important factor for colour stability.
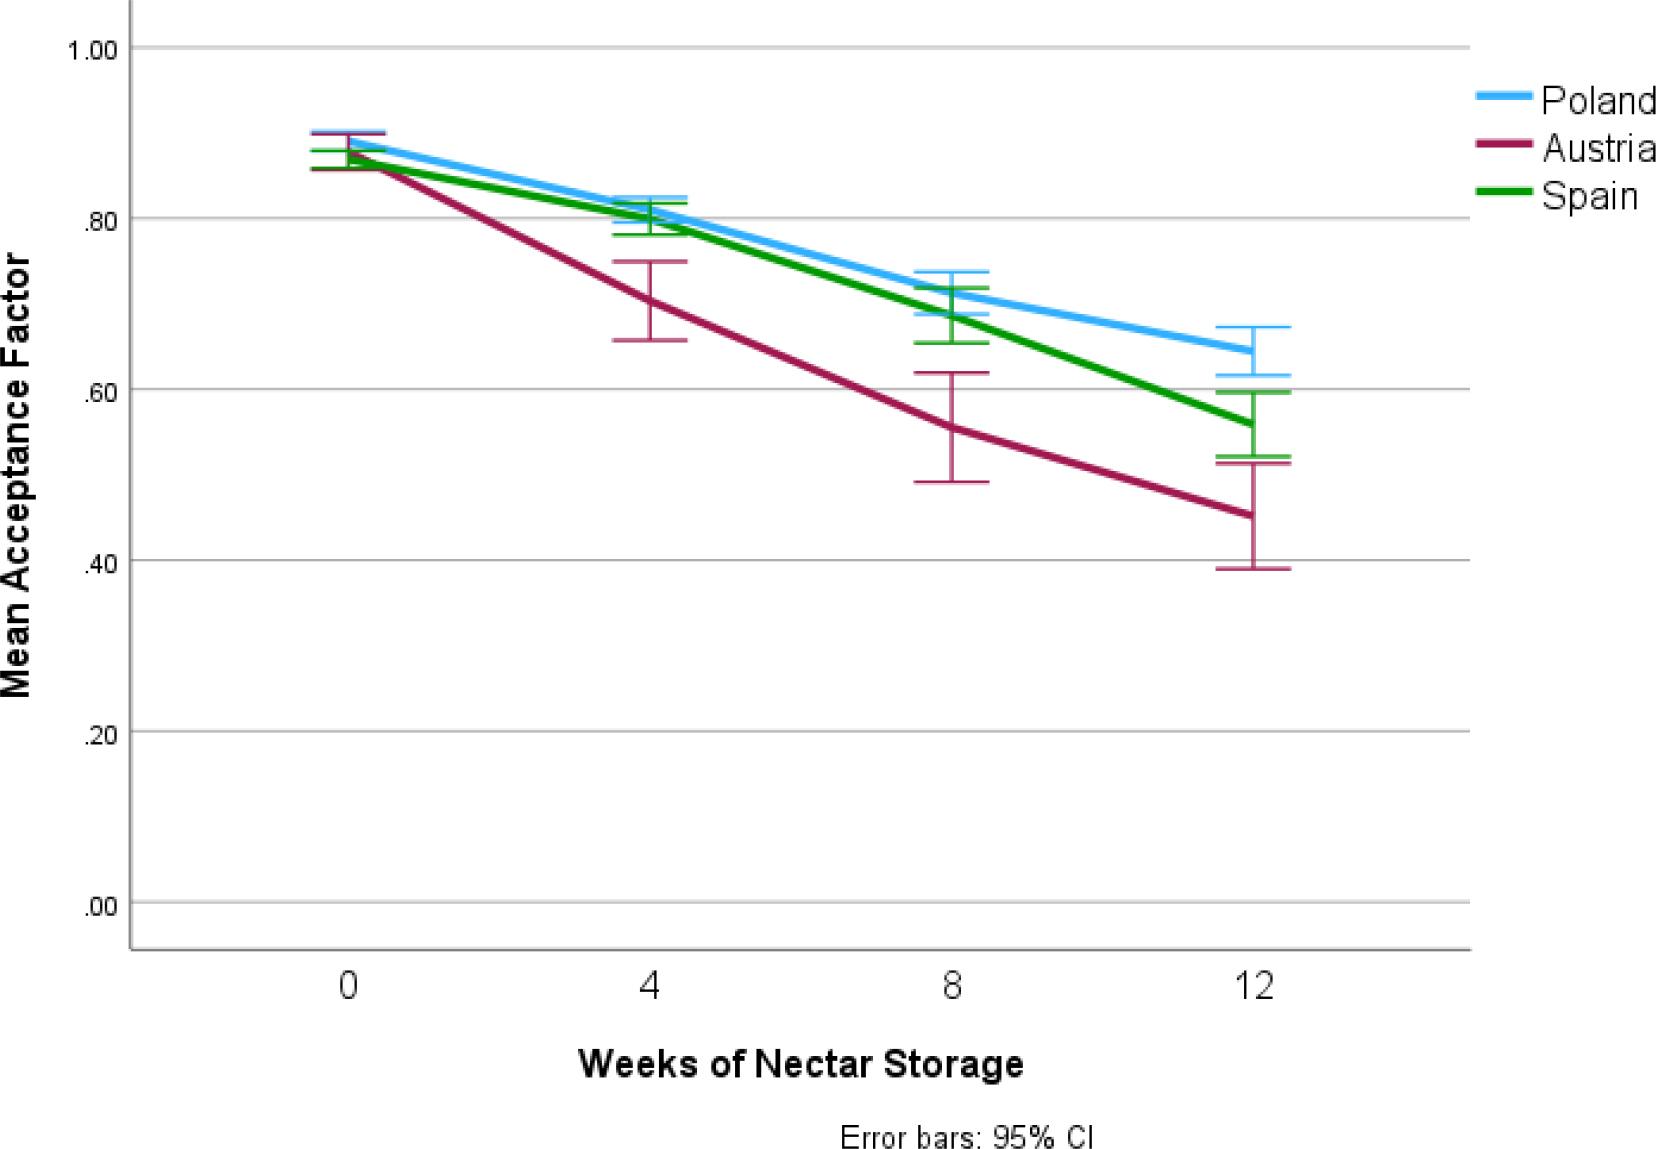
Degradation in Acceptance Factor (AF) during storage at 20 °C for 12 weeks for nectars produced from strawberries from different countries.
The mean and standard deviation of the Acceptance Factor (AF) on day of production and after 4, 8 and 12 weeks (AF0, AF4, AF8 and AF12 respectively) and the difference between AF0 and the Acceptance Factor at these points in time (D4, D8 and D12) of nectars produced from strawberries from different countries, and the mean and standard deviation of the total monomeric anthocyanin content expressed in pelargonidin-3-O-glucoside of these nectars. Lower case letters denote significant differences (p < 0.05).
| Country of Origin | AF0 | AF4 | AF8 | AF12 | D4 | D8 | D12 | Total Monomeric Anthocyanin Content [mg/kg pg-3-O-glu eqv] |
|---|---|---|---|---|---|---|---|---|
| Spain | 0.869 ± 0.030 a | 0.799 ± 0.054 b | 0.686 ± 0.095 b | 0.559 ± 0.111 b | 0.070 ± 0.045 a | 0.183 ± 0.090 a | 0.310 ± 0.107 a | 147.8 ± 41.2 a |
| Austria | 0.878 ± 0.050 a | 0.703 ± 0.109 a | 0.555 ± 0.151 a | 0.451 ± 0.146 a | 0.174 ± 0.100 b | 0.322 ± 0.151 b | 0.426 ± 0.086 b | 159.2 ± 54.8 a |
| Poland | 0.890 ± 0.032 a | 0.810 ± 0.041 b | 0.713 ± 0.068 b | 0.645 ± 0.079 c | 0.080 ± 0.038 a | 0.178 ± 0.072 a | 0.246 ± 0.086 a | 207.5 ± 32.4 b |
As shown in Tab. 1, total monomeric anthocyanin concentrations did not differ significantly between nectars produced from Austrian and Spanish strawberries, but nectars produced from Polish strawberries had significantly higher levels. This is likely due to Polish strawberries being harvested at a riper stage, allowing anthocyanins to develop to higher concentrations compared to strawberries picked at the typical ripeness for fresh sale, as is common in Austria and Spain (Murray, et al., 2024a). This supports previous research that found that the latitude was not an important factor in the phenolic content of strawberries (Krüger et al., 2012), with strawberries from areas further north having higher phenolic content that those further south, dependent on the local climate. Both anthocyanin content and profile are highly dependent of cultivar (Kosar et al., 2004; Fredericks et al., 2012), and so the differences in anthocyanin could also be due to the different cultivars prevalent in each region. Anthocyanin concentration was strongly positively correlated with AF12 (r = 0.804, p < 0.001) and negatively with D12 (r = -0.706, p < 0.001), supporting previous findings that anthocyanin content, as determined by the pH differential method, could be used as a predictor of nectar colour stability (Murray et al., 2024a), providing an alternative to costly and laborious HPLC methods.
The average TSS, TA values and the sugar/acid ratio are shown in Tab. 2. Strawberries from Austria had significantly higher TSS than strawberries from the other origins, while strawberries from Poland had significantly higher acid content and lower sugar/acid ratio. This is notable because sugar/acid ratio is known to increase during ripening (Kosar et al., 2004; Pineli et al., 2011). However, Polish strawberries – despite being riper (confirmed by the lower firmness values presented in section 3.4.2, a known indicator of ripeness (Azodanlou et al., 2004; Montero et al., 1996)) – had the lowest ratio. This discrepancy likely results from the fact that different cultivars dominate in different countries, because different genotypes grow better in different environments due to micro-climatic effects (Martínez-Ferri et al., 2014), and have different inherent sugar/acid ratios (Kosar et al., 2004; Pineli et al., 2011). This makes sugar/acid ratio an unfeasible approach to draw ripeness comparisons between different countries of origin, supported by the fact that AF12 was not significantly correlated with sugar/acid ratio (p = 0.057) and D12 was weakly positively correlated (r = 0.252, p = 0.015). This would suggest that strawberries with high sugar/acid ratios were less stable, which is the opposite of the results expected from strawberries of the same cultivar, where the most stable strawberries should have the highest ratio.
Mean and standard deviation of the Total Soluble Solids (in °Brix), Titratable Acidity (in g/L) and sugar/acid ratio of strawberries from different countries of origin. Lower case letters denote significant differences (p < 0.05).
| Country of Origin | Total Soluble Solids [°Brix] | Titratable Acidity [g/L] | Sugar/Acid Ratio |
|---|---|---|---|
| Spain | 7.7 ± 0.8 a | 8.0 ± 1.0 a | 9.7 ± 1.2 b |
| Austria | 8.4 ± 1.2 b | 8.1 ± 1.1 a | 10.5 ± 2.2 b |
| Poland | 7.2 ± 0.8 a | 9.1 ± 1.5 b | 8.1 ± 2.0 a |
As shown in Tab. 3, there were no significant differences in strawberry width or weight between countries, but Spanish strawberries were significantly longer and Polish strawberries were significantly shorter.
Mean and standard deviation of the width, length and weight of strawberries from different countries of origin. Lower case letters denote significant differences (p < 0.05).
| Origin | Width [mm] | Length [mm] | Weight [g] |
|---|---|---|---|
| Spain | 31.50 ± 5.87 a | 39.69 ± 10.84 c | 16.84 ± 8.29 a |
| Austria | 32.49 ± 5.04 a | 32.87 ± 5.62 b | 15.93 ± 6.53 a |
| Poland | 32.66 ± 5.95 a | 30.31 ± 5.82 a | 15.23 ± 7.46 a |
No significant correlations (p > 0.05) were observed between anthocyanin content and any of these size parameters, despite prior research indicating that smaller fruits tend to have higher anthocyanin concentrations (Simkova et al., 2023a). A possible explanation is that in that study strawberries were selected at the same ripeness stage, whereas, in general, smaller strawberries tend to be less ripe (Murray et al., 2024a). Less ripe strawberries are known to be less colourstable (Gössinger et al., 2010; Murray et al., 2024a). In addition, different cultivars grow to different sizes (Cheng and Breen, 1992), while the previous study examined differences within cultivars. Different cultivars could have differing phenols and sizes, and would require further study of a wide range of known cultivars.
There were weak but significant negative correlations between AF0 and fruit weight (r =-0.437, p < 0.001), width (r = -0.208, p = 0.046) and length (r = -0.297, p = 0.004) suggesting that smaller fruits produced nectars with better initial colour. However, no significant relationship (p > 0.05) was found between these parameters and AF12 or D12, suggesting no impact on longterm colour stability.
As shown in Tab. 4, Polish strawberries were significantly less firm than those from Spain or Austria. This was consistent with expectations, as strawberries in Poland are harvested at a riper stage than those intended for retail (Wunderlich, 2025) (i.e. strawberries used in industrial processing in Austria and Spain). Strawberry firmness is a known indicator of ripening (Azodanlou et al., 2004; Montero et al., 1996), with strawberries becoming less firm as they ripen (Murray et al., 2024a). Firmness was significantly negatively correlated with AF12 (r = -0.608, p < 0.001) and positively with D12 (r = 0.569, p <0.001), but not with AF0 (p = 0.052). This aligns with previous studies demonstrating that softer, riper strawberries yield nectars with better colour stability (Murray et al., 2024b). The firmness method used in this study is considered less destructive than traditional pendrometer methods, due to the applied force being so low that it does not break the skin of the strawberry, leading to some studies describing it as nondestructive (Døving et al., 2005), although internal damage from the pressure is possible. The less destructive method, combined with the portability of the meter, means the readings can be taken while strawberries are still on the plant. Therefore, it could serve as a practical method to determine the optimal harvest time for maximizing colour stability in subsequent nectar production.
Mean and standard deviation of the firmness and drip loss of strawberries from different countries of origin. Lower case letters denote significant differences (p < 0.05).
| Country of Origin | Firmness [Durofel Units] | Drip Loss [%] |
|---|---|---|
| Spain | 65.4 ± 15.2 b | 51.1 ± 5.9 a |
| Austria | 65.4 ± 11.4 b | 55.5 ± 6.0 b |
| Poland | 47.8 ± 17.5 a | 56.2 ± 5.9 b |
Tab. 4 also shows that Spanish strawberries had significantly lower drip loss than those from Austria or Poland. Drip typically increases with ripeness (Montero et al., 1996), and a significant negative correlation was observed between firmness and drip loss (r = -0.468, p < 0.001). This may explain why Spanish strawberries had the lowest drip loss, as these fruits were the most firm (Moore, 1999). However, despite similar firmness, Austrian strawberries yielded significantly higher drip loss, possibly due to varietal or structural differences. Drip loss also had a weak, but significant, negative correlation with D12 (r = -0.227, p = 0.03), suggesting higher drip loss was mildly associated with better colour stability, though no other significant (p > 0.05) correlations were found with any of the indicators of colour stability.
This study demonstrated that the quality of strawberries received by industrial processors varies significantly between different countries of origin, with measurable effects on nectar colour and colour stability of nectars produced from these fruits. Austrian strawberries had the highest mean Total Soluble Solids, while Polish strawberries had a greater mean Titratable Acidity, a lower sugar/acid ratio, and significantly lower firmness, and Spanish strawberries had the lowest percentage of drip loss. These differences in fruit characteristics translated into differences in the quality of nectars produced from the strawberries from the different countries of origin. In particular, Polish strawberries produced nectars that were more colour stable, retained superior colour after storage, and had significantly higher anthocyanin content than those from Spain or Austria. The enhanced colour stability observed in nectars from Polish strawberries is likely linked to fruit ripeness at harvest. In Poland, strawberries are primarily cultivated for processing, allowing for later harvest, which allows for greater anthocyanin development. Conversely, in Spain and Austria, strawberries destined for processing are often rejected freshmarket fruit harvested before the ideal stage of ripeness for processing. Moreover, processors in Poland exert more influence over cultivation practices, potentially promoting varieties and harvest strategies optimised for processing quality. Nonetheless, within each country, different batches of strawberries had considerable variability in shape, size and colour stability, highlighting the challenge of producing a uniform product when processors have limited control over raw material quality. These findings highlight the difficulties faced by industrial processors, due to the importance of raw material quality in the production of nectars of an ideal quality.