The wine defect mousiness or mousy off-flavor has grown in intensity in recent years, presumably through increasing pH values and consequently more microbial spoilage. It is also linked to a significant decrease in free sulfur dioxide and the use of microbiota present in the vineyard for spontaneous fermentations rather than using specific commercially available yeasts (Massini and Vuchot, 2015). Several compounds have been associated with this off-flavor, namely 2-acetyltetra-hydro-pyridine (ATHP), ethyl-tetra-hydropyridine (ETHP), and 2-acetyl-1-pyrroline (APY) (Strauss and Heresztyn, 1984; Craig and Heresztyn, 1984; Herderich et al., 1995; Moulis et al., 2023).
The mousy off-flavor has been described as a particularly unpleasant defect, reminiscent of rodent urine, and grilled foods, such as popcorn, rice, crackers, and bread crust (Strauss and Heresztyn, 1984; Herderich et al., 1995; Tucknott, 1977; Buttery et al., 1983, Bartowsky, 2009). The off-flavor is only perceived, when the wine gets into contact with saliva and may persist as long as ten minutes after swallowing or spitting. Actually, all three compounds are not volatile at wine pH, which is around 3.0 to 4.0. Saliva pH is near 7.0 and favors the imino form, which is much more volatile than the protonated amino form (Bartowsky and Henschke, 1995; Grbin et al., 1996).
Generally, these compounds are formed from the amino acids lysine or ornithine and acetaldehyde by Brettanomyces yeast or Lactobacillus or Oenococcus oeni species (Grbin and Henschke, 2008; Costello and Henschke, 2002; Romano et al., 2008; Moulis et al., 2023). More recently, we proposed a pure chemical pathway, where ATHP is formed from the amino acid proline and methylglyoxal (Künzler and Pour Nikfardjam, 2013). We could also show that ATHP is not stable and oxidizes over time to 2-acetyl pyridine (AP). The proposed mechanism is depicted in Fig. 1.
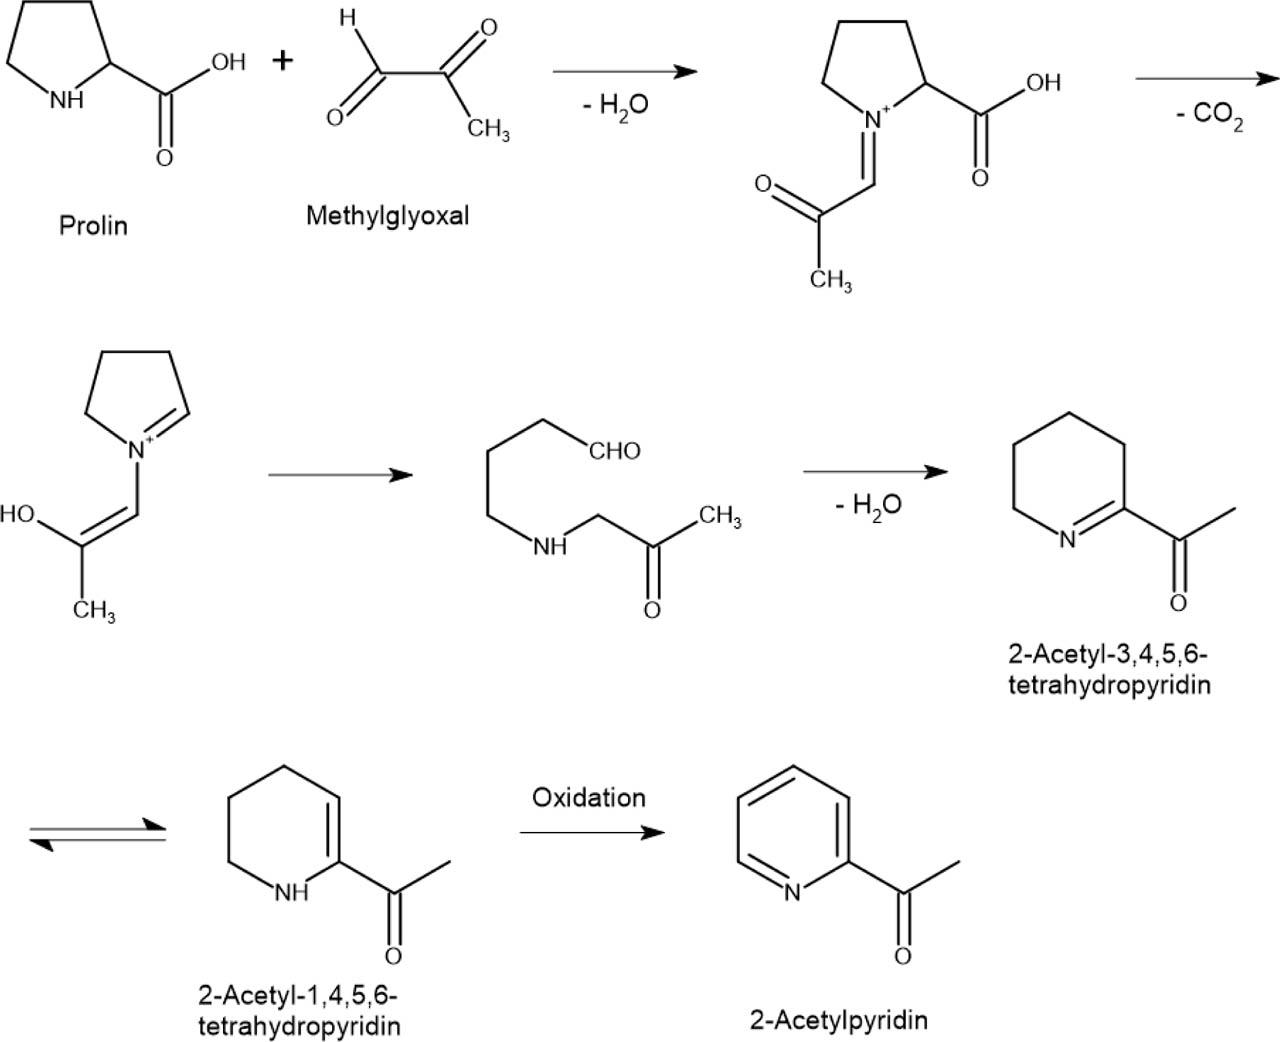
Proposed formation of 2-Acetyl-3,4,5,6-tetrahydropyridine and 2-Acetyl pyridine from proline and methylglyoxal
AP shows an odor detection threshold of 19 μg/L, which is about tenfold higher than ATHP and, thus, a conversion from ATHP to AP will significantly alter the perceived off-flavor (Belitz et al., 2008). We also proposed that an intermediate is formed, 2-acetyl-dihydro-pyridine (ADHP), and that its formation is pH dependent as two protons would have to be released into the wine from ATHP (Pour Nikfardjam and Kunz, 2021). This supports also work by other authors (Weerawatanakorn et al., 2015; Schieberle, 1995). Other authors have stated that some wines only express mousiness after oxidation, which would oppose the aforementioned results (Grbin et al., 1996).
Furthermore, we could show that ATHP converts to AP especially at higher temperatures around 30 °C, which would reduce the experienced off-flavor (Pour Nikfardjam and Kunsági-Máté, 2022). Therefore, winemakers could lower the perceived off-flavor by bringing the wine to higher temperatures for a short period. However, if an off-flavor is not yet present, the winemakers should consequently keep the wine at low temperatures to avoid a formation of ATHP and AP from proline and methylglyoxal or due to better microbial growth (Margalit, 2012; Künzler and Pour Nikfardjam, 2013).
In our most recent work, we could also identify the pH value as one crucial determining factor for the formation of mousiness and AP (Pour Nikfardjam and Kunsági-Máté, 2022). Based on the dissociation constants for ATHP, ADHP, and AP we could conclude that at pH 3.0 the constant is at a maximum for ATHP and decreases constantly to pH 4.0. For the other two compounds it is exactly the opposite: they show the lowest dissociation constants at pH 3.0 and the highest at 4.0.
From this perspective, we wanted to analyze the impact of various temperatures and pH levels on the formation of AP. Since the last step in the reaction scheme depicted in Fig. 1 is an oxidation, we also analyzed the influence of SO2 and ascorbic acid as antioxidants on the formation of AP. We chose a design of experiments (DoE) setup for the selected parameters (Tab. 1). The pH levels represent the typical values in wines between pH 3 and pH 4. For SO2 we chose 25 and 50 mg/L as typical levels. Ascorbic acid levels were set to 50% and 100%, respectively, of the legal limit of 250 mg/L. To keep the model system as simple as possible and to avoid competitive reactions, we did not use ethanol in the model solutions.
Parameters analyzed within the scope of the study
| pH | SO2 [mg/L] | Ascorbic acid [mg/L] | Temperature [°C] |
|---|---|---|---|
| 3,0 | 25 | 125 | 14 |
| 4,0 | 50 | 250 | 25 |
Model solutions were prepared using milli-Q water. (S)-(-)-Proline, methylglyoxal, and 2-acetyl pyridine were from Sigma-Aldrich/Merck KGaA (Darmstadt, Germany). Tartaric and ascorbic acid were from VWR International (Leuven, Belgium). The pH was adjusted using NaOH (Supelco/Merck, Darmstadt, Germany). SO2 (as K2S2O5), Na2CO3, and ascorbic acid were provided by VWR International (Leuven, Belgium).
The design of experiments (DoE) setup was based on four parameters at various levels and resulted in a setup given in Tab. 2. The DoE setup and statistical evaluation (response surface methodology) of the results were calculated using XLSTAT Premium (Version 2023.1.1, Addinsoft, Paris, France). Model solutions were prepared in 100 mL Erlenmeyer flasks, sealed with glass stoppers, and stored at the specified temperatures as given in Tab. 2.
Experimental design (central composite design) calculated by XLSTAT based on Tab. 1
| Observations | pH | SO2 [mg/L] | Ascorbic acid [mg/L] | Temperature [°C] |
|---|---|---|---|---|
| Obs1 | 3.0 | 25.0 | 125.0 | 14.0 |
| Obs2 | 4.0 | 25.0 | 125.0 | 14.0 |
| Obs3 | 3.0 | 50.0 | 125.0 | 14.0 |
| Obs4 | 4.0 | 50.0 | 125.0 | 14.0 |
| Obs5 | 3.0 | 25.0 | 250.0 | 14.0 |
| Obs6 | 4.0 | 25.0 | 250.0 | 14.0 |
| Obs7 | 3.0 | 50.0 | 250.0 | 14.0 |
| Obs8 | 4.0 | 50.0 | 250.0 | 14.0 |
| Obs9 | 3.0 | 25.0 | 125.0 | 25.0 |
| Obs10 | 4.0 | 25.0 | 125.0 | 25.0 |
| Obs11 | 3.0 | 50.0 | 125.0 | 25.0 |
| Obs12 | 4.0 | 50.0 | 125.0 | 25.0 |
| Obs13 | 3.0 | 25.0 | 250.0 | 25.0 |
| Obs14 | 4.0 | 25.0 | 250.0 | 25.0 |
| Obs15 | 3.0 | 50.0 | 250.0 | 25.0 |
| Obs16 | 4.0 | 50.0 | 250.0 | 25.0 |
| Obs17 | 2.5 | 37.5 | 187.5 | 19.5 |
| Obs18 | 4.5 | 37.5 | 187.5 | 19.5 |
| Obs19 | 3.5 | 12.5 | 187.5 | 19.5 |
| Obs20 | 3.5 | 62.5 | 187.5 | 19.5 |
| Obs21 | 3.5 | 37.5 | 62.5 | 19.5 |
| Obs22 | 3.5 | 37.5 | 312.5 | 19.5 |
| Obs23 | 3.5 | 37.5 | 187.5 | 8.5 |
| Obs24 | 3.5 | 37.5 | 187.5 | 30.5 |
| Obs25 | 3.5 | 37.5 | 187.5 | 19.5 |
For SPME-HS-GC-MS analysis 5 mL sample were pipetted into a 20 mL headspace vial (Gerstel GmbH & Co. KG, Mülheim an der Ruhr, Germany) already containing 350 mg Na2CO3. The vial was sealed with a magnetic crimp cap (Gerstel GmbH & Co. KG, Mülheim an der Ruhr, Germany), thoroughly mixed on a vortexer (Neolab Migge GmbH, Heidelberg, Germany), and then stored at 22 °C overnight. The vial was then placed into a SPME-HS-GC-MS system (TurboMatrix MultiPrep+ head-space sampler, Clarus 690 gas chromatograph, Clarus SQ 8 T mass spectrometer, PerkinElmer, Dreieich, Germany). The GC parameters are given in Tab. 3. Separation of the compounds was achieved using an Elite-5MS (30 m, 0.25 mm ID, 0.25 μm film thickness) column (PerkinElmer, Dreieich, Germany).
SPME-HS-GC-MS parameters
| SPME | |
|---|---|
| Fiber | Carbon WR/PDMS - 95/10 |
| Conditioning Temperature | 250 °C |
| Pre-Injection Conditioning Time | 10.00 min |
| Post-Injection Conditioning Time | 1.00 min |
| Needle Purge flow | 0.8 bar |
| Sample Incubation | 5.00 min, 50 °C |
| Headspace Sampling | 45.00 min, 50 °C |
| Agitator on | 5 s |
| Agitator off | 2 s |
| Sample Vial Depth | 35 mm |
| Sample Desorption | 10.00 min, 280 °C |
| GC | |
| Column flow | 1 mL/min |
| Carrier gas | Helium |
| Injector | 280 °C |
| Liner | Quartz Liner for splitless Operation ID 1 mm |
| Split | 50 ml/min @1.00 min |
| Gas Saver | 20 ml/min @14.00 min |
| Oven Temperature Program | 40 °C/0.00 min – 3 °C/min/80 °C/0.00 min – 6 °C/min/150 °C/0.00 min – 10 °C/min/240 °C/5.00 min |
| MS | |
| Electron energy | 70 eV |
| Transferline | 280 °C |
| Ion source | 220 °C |
| Solvent Delay | 1.00 min |
| Scan Mode | 1.10 – 39.00 min |
| Scan m/z | 38–250 amu |
| Scan Time | 0.2 s |
| Inter-Scan Delay | 0.025 s |
| SIR Mode (2-AP) | 12.00–15.00 min |
| m/z | 52, 78, 79, 93, 121 |
| Inter-Channel Delay | 0.01 s |
| Data evaluation | sum 79+93+121 |
Samples were analyzed at six different time points over a period of 167 days. Identification of AP took place using the MS spectrum (NIST 2020 database), retention time, Kovats index, and comparing data to a reference standard, respectively. For better comparability, the contents on AP were not expressed as μg/L, but as area units. Due to the complexity of the setup and the high number of samples, every sample was only analyzed once without replication to ensure measurement of all 25 samples within 24 hours.
Detailed results of the GC-MS analysis are given in Tab. 4. When statistically evaluating the influence of the four analyzed parameters on AP formation, we obtained the results depicted in Fig. 2. According to the results in Fig. 2, temperature has a very strong promoting effect on the formation of AP. Moreover, temperature is the strongest of all four factors analyzed. The pH shows a slightly hindering effect, while SO2 and ascorbic acid do not seem to have any distinct effect at all.
Results of the GC/MS measurements on AP in model solutions after 106 days (AP: acetyl pyridine)
| Observations | pH | SO2 [mg/L] | Ascorbic acid [mg/L] | Temperature[°C] | AP [area units] |
|---|---|---|---|---|---|
| Obs1 | 3.0 | 25.0 | 125.0 | 14.0 | 291 |
| Obs2 | 4.0 | 25.0 | 125.0 | 14.0 | 279 |
| Obs3 | 3.0 | 50.0 | 125.0 | 14.0 | 0 |
| Obs4 | 4.0 | 50.0 | 125.0 | 14.0 | 238 |
| Obs5 | 3.0 | 25.0 | 250.0 | 14.0 | 185 |
| Obs6 | 4.0 | 25.0 | 250.0 | 14.0 | 209 |
| Obs7 | 3.0 | 50.0 | 250.0 | 14.0 | 298 |
| Obs8 | 4.0 | 50.0 | 250.0 | 14.0 | 318 |
| Obs9 | 3.0 | 25.0 | 125.0 | 25.0 | 1536 |
| Obs10 | 4.0 | 25.0 | 125.0 | 25.0 | 1485 |
| Obs11 | 3.0 | 50.0 | 125.0 | 25.0 | 964 |
| Obs12 | 4.0 | 50.0 | 125.0 | 25.0 | 1195 |
| Obs13 | 3.0 | 25.0 | 250.0 | 25.0 | 1304 |
| Obs14 | 4.0 | 25.0 | 250.0 | 25.0 | 657 |
| Obs15 | 3.0 | 50.0 | 250.0 | 25.0 | 1148 |
| Obs16 | 4.0 | 50.0 | 250.0 | 25.0 | 1170 |
| Obs17 | 2.5 | 37.5 | 187.5 | 19.5 | 343 |
| Obs18 | 4.5 | 37.5 | 187.5 | 19.5 | 137 |
| Obs19 | 3.5 | 12.5 | 187.5 | 19.5 | 267 |
| Obs20 | 3.5 | 62.5 | 187.5 | 19.5 | 65 |
| Obs21 | 3.5 | 37.5 | 62.5 | 19.5 | 34 |
| Obs22 | 3.5 | 37.5 | 312.5 | 19.5 | 301 |
| Obs23 | 3.5 | 37.5 | 187.5 | 8.5 | 31 |
| Obs24 | 3.5 | 37.5 | 187.5 | 30.5 | 3519 |
| Obs25 | 3.5 | 37.5 | 187.5 | 19.5 | 367 |
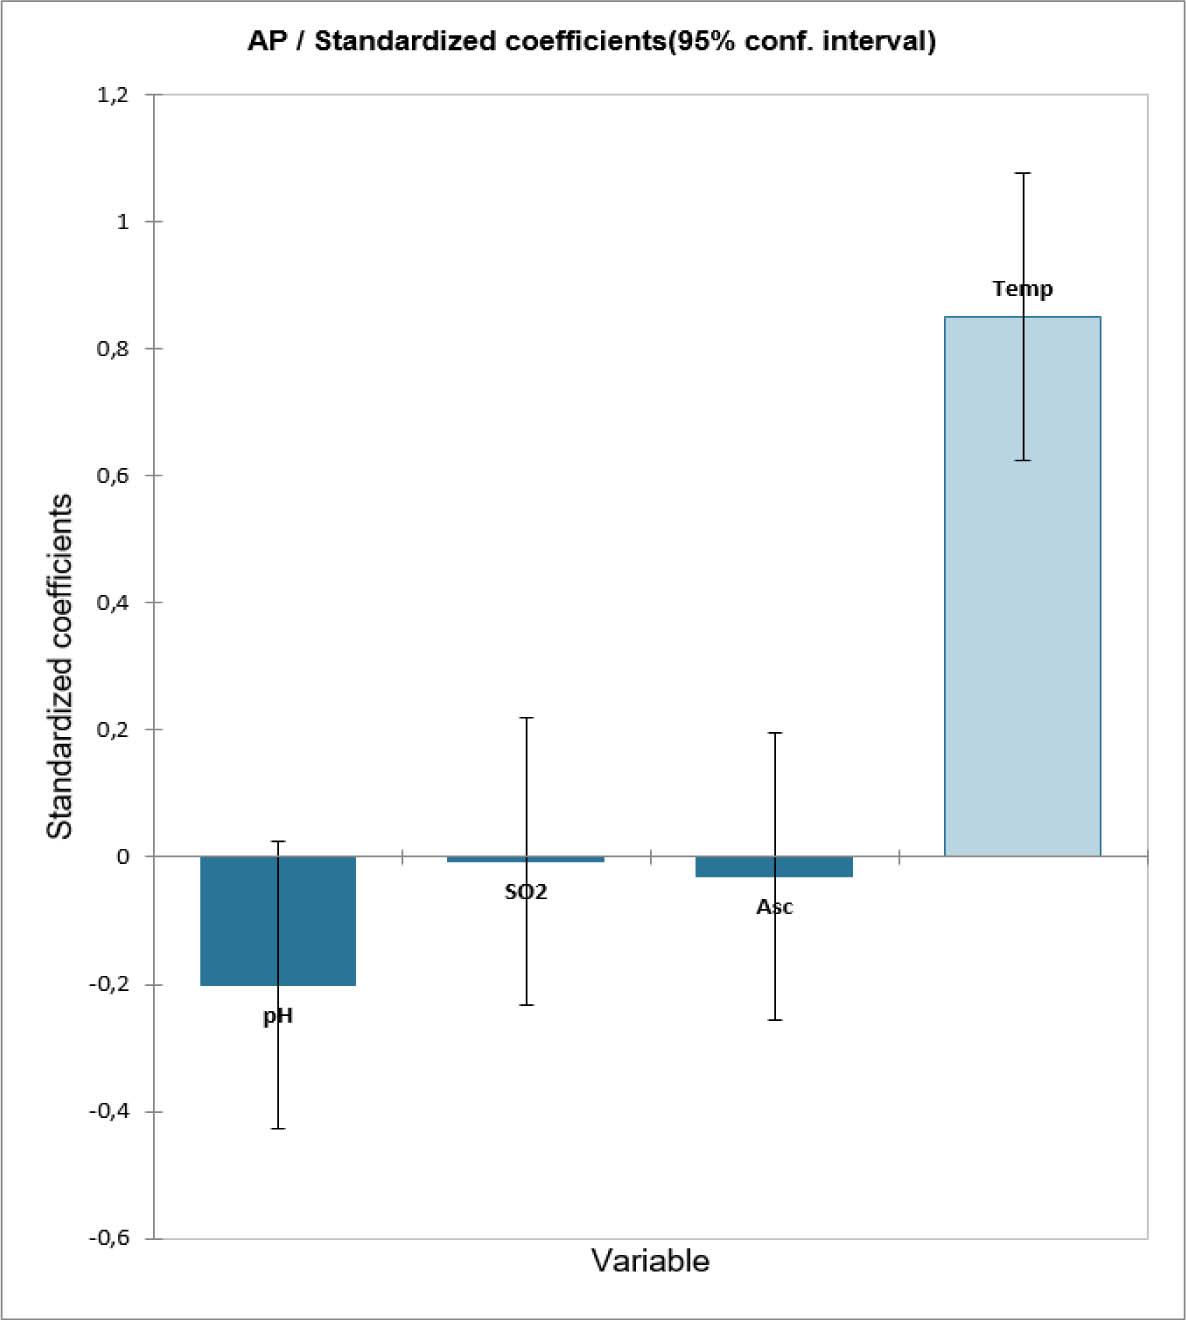
Statistical evaluation of the coefficients responsible for AP formation (based on GC-MS data achieved after 106 days)
In order to better visualize the intense effect of temperature on AP formation observations on day 106 showing area equivalents above 1,000 units and one observation at 14 °C were used to build Fig. 3. The highest temperature (30.5 °C) shows a much higher formation of AP than all the other temperatures. At 25 °C, the mean area equivalent is around 1,300 units, so nearly about three times lower than at 30.5 °C. Storage at 14 °C led to an area of only 209 units, which is about 17 times lower than at 30.5 °C. This illustrates the important influence of different storage temperatures on AP formation. These results also reinforce earlier findings on this topic (Margalit, 2012; Künzler and Pour Nikfardjam, 2013; Pour Nikfardjam and Kunsági-Máté, 2022). Winemakers are thus advised to always keep temperatures during wine storage very low to avoid or at least to slow down processes leading to AP formation.
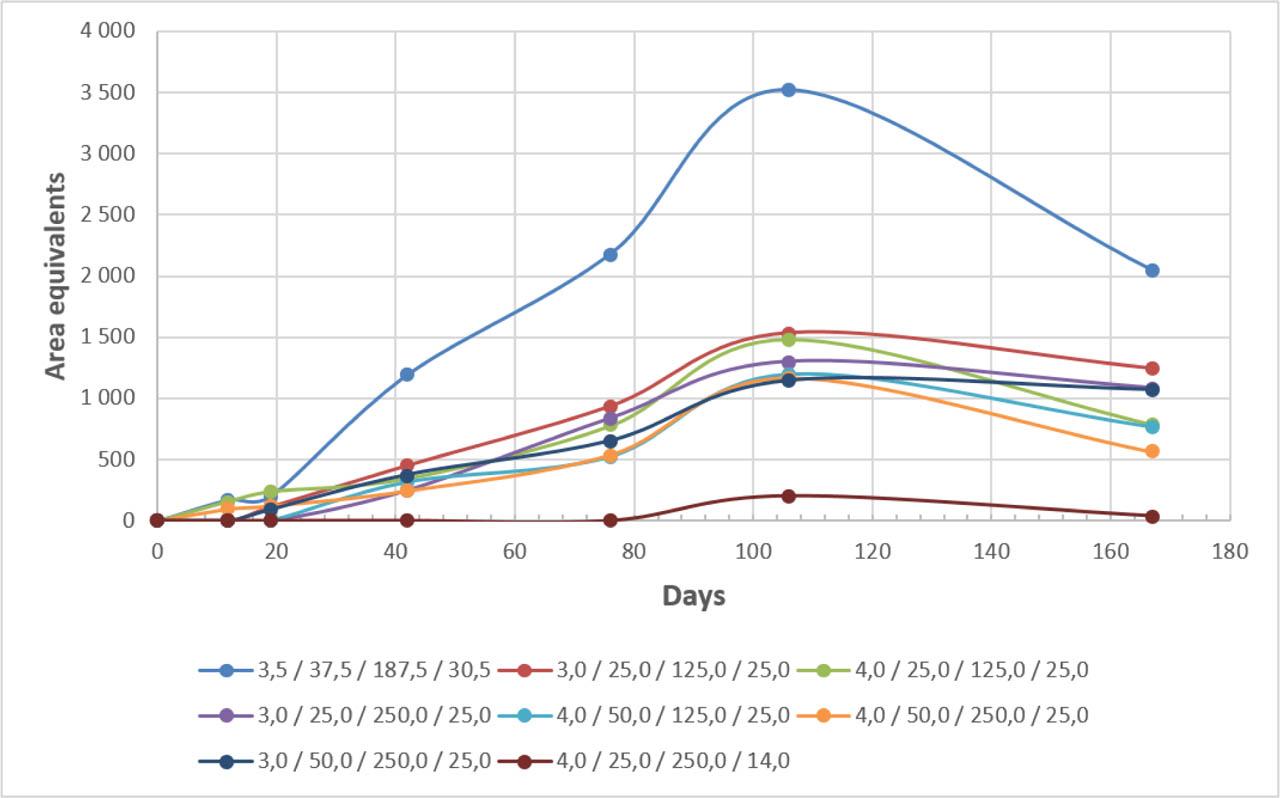
Formation of acetyl pyridine at various pH / SO2 [mg/L] / ascorbic acid [mg/L] / temperature [°C] levels in model solutions over time
The lower contents in the observations on day 167 (Fig. 3) are presumably due to reaction of AP with ascorbic acid or one of its decomposition products, i.e. through the formation of Schiff bases. Especially at higher temperatures, ascorbic acid is not stable and forms various products, some of which are aroma relevant (Heidrich et al., 2024).
Furthermore, the pyridine ring of AP is relatively stable and further oxidation of the ring is hardly imaginable under the given circumstances in absence of strong oxidants, such as hydrogen peroxide. Yet, reactions of the amine group with carbonyl groups provided by ascorbic acid and its decomposition products is quite likely (Koppanyi et al., 1945; Hayashi et al., 1985). This could explain the lower contents of AP on day 167 in Fig. 3.
Beside temperature, pH has been identified a crucial factor in AP formation (Pour Nikfardjam and Kunsági-Máté, 2022). This coherency was confirmed during the scope of this study (Fig. 2). The respective p-values were < 0.0001 for temperature and 0.078 for pH (detailed data not shown). In order to illustrate the dependency between temperature and pH a surface plot of the results obtained on day 106 is shown in Fig. 4. According to the surface plot, especially high AP values are possible at elevated temperatures and concurrent low pH values. Yet, the influence of temperature is so high that differences in pH will ultimately not have a comparable strong effect like the temperature. So again, keeping the wine at low temperatures is strictly advised, when trying to avoid formation of AP.
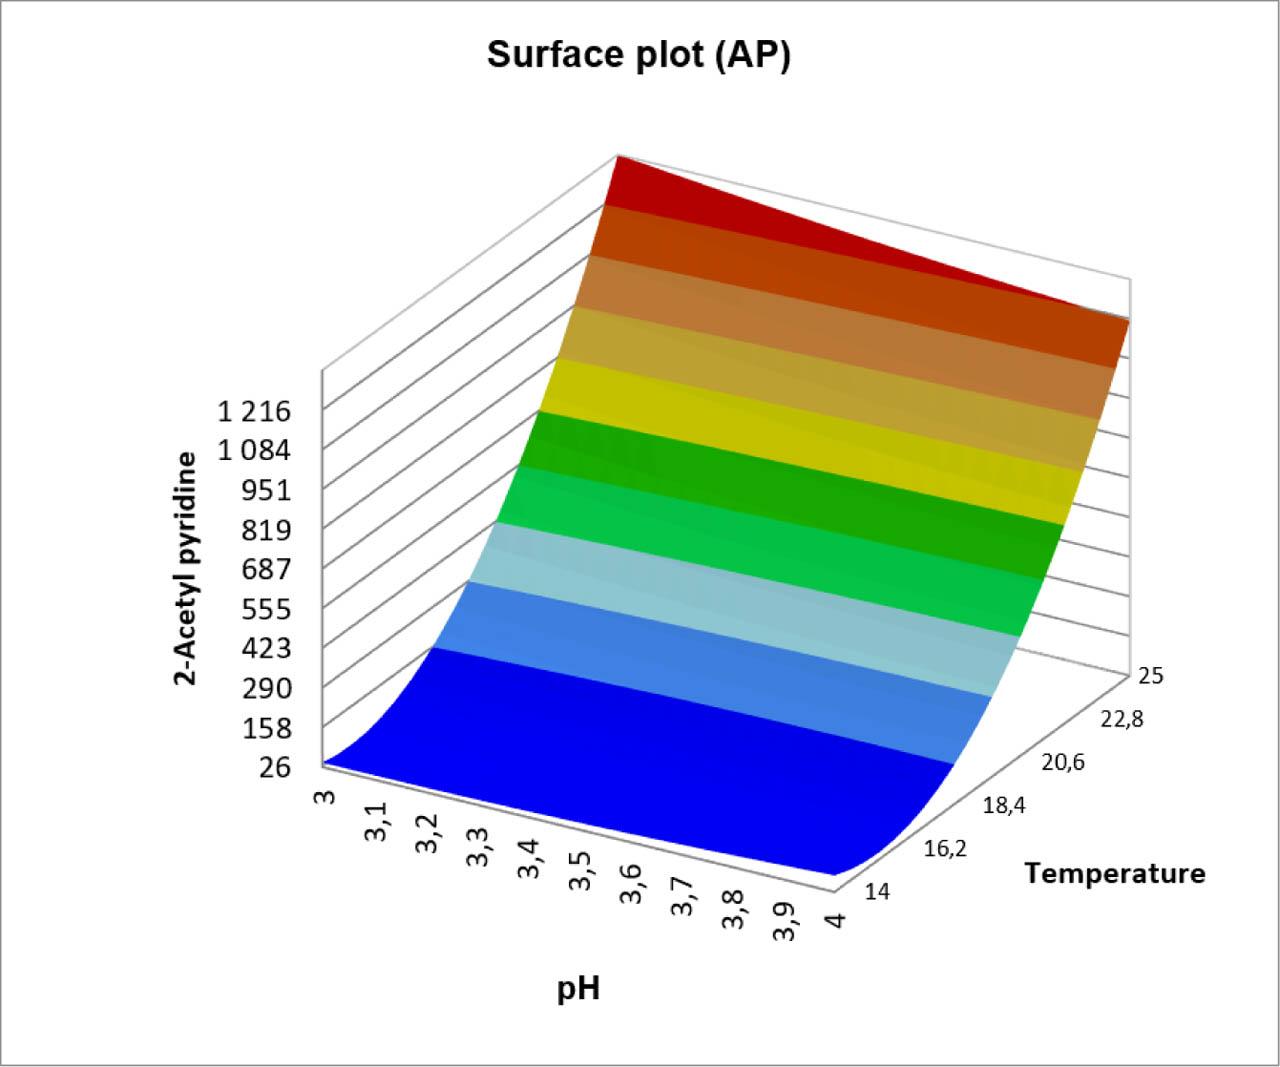
Dependency of the formation of acetyl pyridine [area units] on pH and temperature [°C] in model solutions after 106 days
With regard to SO2 and ascorbic acid, we could not find any significant effects on AP formation (Fig. 2). This is somewhat surprising as SO2 and tannins were effective in lowering AP formation in our previous work (Künzler and Pour Nikfardjam, 2013). Yet, these results were obtained storing the samples only at elevated temperatures. Probably, the combination of both compounds is much more effective than SO2 in combination with ascorbic acid. In addition, tannins might form complexes with AP impeding diffusion of the compound into the gaseous phase. Ongoing research will shed light on this topic and hitherto also on the formation of ATHP.