
Sweet cherry (Prunus avium L.), a member of the Rosaceae family, is highly valued for its early-season production, making it one of the first fresh fruits available each year (Habib et al., 2017). The fruit is known for its exceptional quality, characterized by a bright color, a well-balanced sweetness and acidity, a firm texture, and a rich nutritional profile with numerous health benefits (Esti et al., 2002). Türkiye is one of the leading producers and exporters of sweet cherries, with the 0900 Ziraat cultivar being the most widely grown and exported (TOB, 2020; FAO, 2025). The 0900 Ziraat cultivar is known for its size, deep red color, firm texture, and excellent taste. It plays a crucial role in the Turkish cherry industry and is well competitive on the world market (Engin and Ünal, 2006).
Sweet cherries are non-climacteric fruits that go through three different stages of development during ripening. In the first stage, rapid cell division and growth of mesocarp cells occur immediately after flowering (Andrews & Li, 1994). The second stage is characterized by the lignification of the endocarp and the enlargement of the fruit (Knoche et al., 2004). Finally, the third stage is characterized by changes in the bioactive components and a rapid increase in fruit volume. During the commercial ripening stage, there are significant changes in the pomological and bioactive properties, which are particularly evident in the change in fruit color, which serves as an important indicator of ripeness. In addition, fruit ripening varies within trees and is influenced by variety, climate, agricultural practices, and fertilization (Mineață et al., 2024). Therefore, physicochemical studies are crucial for improving pre- and post-harvest strategies for sweet cherries worldwide (Hayaloğlu & Demir, 2016).
Fruit ripeness is a key factor in determining fruit quality, and cherries are usually harvested at the end of the commercial ripening stage to obtain optimal nutritional value (Correia et al., 2017). The ideal harvest time varies by cultivar, with the optimal time window being less than five days and requiring immediate post-harvest chilling to avoid mechanical damage (Chauvin et al., 2009). In the early stages of cherry development, there are changes in the color of the fruit skin, the initiation of texture change and a rapid increase in fruit size. As ripening progresses, anthocyanin accumulates in the fruit tissue, which increases the antioxidant properties and leads to a darker color of the fruit flesh (Serrano et al., 2005). Determining the optimal time to harvest fruit is important because it ensures that consumers get the best quality, flavor, aroma and nutritional value. For producers and retailers, harvesting at the right time also helps to extend shelf life and reduce post-harvest losses (Muskovics et al., 2006).
Therefore, this study aimed to investigate the physical, chemical, and morphological changes during fruit development of the 0900 Ziraat sweet cherry cultivar and to determine its optimal harvest time.
This study was conducted in 2017 during the full yield period of the 0900 Ziraat sweet cherry cultivar of 12 to 15-year-old trees grown in Iğdır (Turkey), grafted onto Mazzard rootstock. Fruit samples were collected at 7-day-intervals from the early fruit development stage (two weeks after full bloom) from the 1st week of May to the 3rd week of June (Fig. 1). The study was designed with three replications, with each tree representing one replication and 10 fruits examined in each replication.
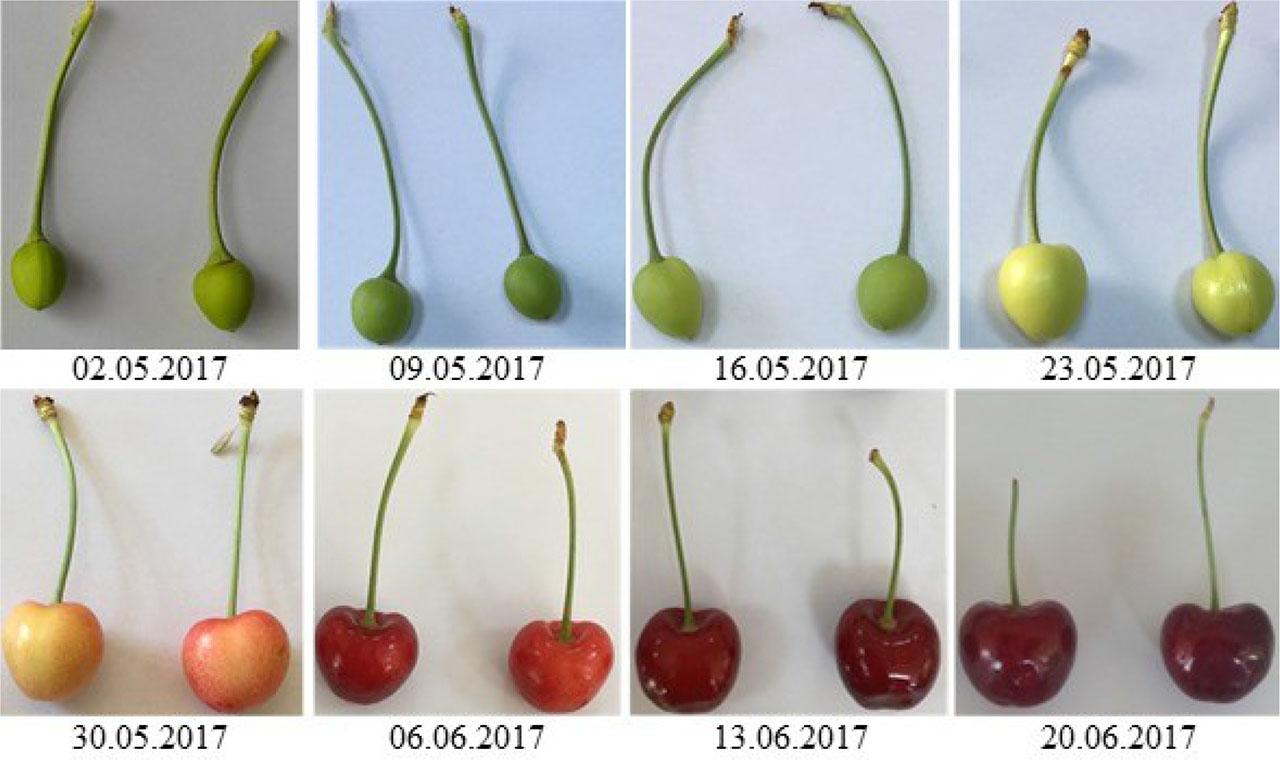
The different development stages of the 0900 Ziraat sweet cherry cultivar
The fruit weight was measured using an electronic scale with an accuracy of 0.01 g for groups of 10 fruits, and the results were expressed in grams (g). The width and length of the fruits were measured using a digital caliper, and the results were expressed in millimeters (mm).
To further investigate the physical properties of the fruits, the geometric mean diameter (Dg) and sphericity (S) were determined using specific mathematical equations:
Fruit skin color (CIELAB color space) was measured using a Minolta colorimeter (CR 410, Osaka, Japan) according to the method described by Karabulut et al. (2007). The results were recorded as CIE values for L* (lightness), a* (red-green), and b* (yellow-blue), which were then used to calculate the hue angle (h⁰) to assess the color changes during ripening:
In addition, chroma (C∗) was determined using the following formula:
Fruit firmness and elasticity were measured using a TA-XT2 texture analyzer (Stable MicroSystems, UK) with a 2 mm cylindrical probe. The tests were performed at a pre- and final speed of 5 mm/s, a test speed of 1 mm/s, and a penetration depth of 3 mm. Each fruit was measured three times.
The pH value of the extracted juice was measured with a pH electrode in combination with a multiparameter device (Consort C3040, Belgium).
Ten fruits were pureed with a household blender to produce a fruit paste, which was then filtered through a Whatman No. 4 filter to extract the juice. The total soluble solids (TSS) content of the juice was determined using a digital Abbe refractometer (Germany).
A 5 g fruit sample was transferred to a beaker, followed by the addition of 10 mL of acidified methanol (50% methanol, v/v, 0.1% HCl). The mixture was then homogenized (1300 rpm, 1 min, IKA Ultra Turrax T18, Korea) and kept in the dark at 4°C for 2 hours. After incubation, centrifugation was performed at 10,000 × g, 10°C, for 15 min. The resulting supernatant was collected and filtered sequentially with Whatman paper No. 4, followed by a 0.45-μm filter. The final filtrate was either analyzed immediately or stored at −80°C for later use.
The analysis of organic acids was performed isocratically, with slight modifications based on the method described by Akin et al. (2008). An Agilent 1260 series high-performance liquid chromatography (HPLC) system equipped with a diode array detector (DAD) and an ACE GENERIX 5 C18 column (5 μm, 4.6 mm × 250 mm) was used. The mobile phase consisted of 98% Na2HPO4, adjusted to pH 2.4 with H3PO4, and was operated at a flow rate of 1 mL/min. Detection was performed at 210 nm for citric acid and 400 nm for ascorbic acid.
The phenolic compounds, in particular gallic acid and catechin, were analyzed according to the method of Hussain et al. (2013) with slight modifications. The separation was performed using an Agilent 1260 series HPLC system equipped with a diode array detector (DAD) and a Poroshell 120 EC-C18 column (2.7 μm, 4.6 mm × 150 mm). A gradient mobile phase consisting of 83% phosphoric acid and 17% acetonitrile was used, with a 1 mL/min flow rate and an injection volume of 20 μL. The elution gradient was set as follows: 83% A for 1 min, 70% A for 2 min, 60% A for 4 min, and 83% A for 10 min. The system was operated under conditions with a detection wavelength of 210 nm and 300 nm, an injection volume of 20 μL, and a column temperature of 20°C.
Statistical analysis was performed using a one-way analysis of variance (ANOVA) followed by Duncan’s multiple range test, with a significance level of P < 0.05. Data processing was performed using SPSS software (version 18; SPSS Inc., Armonk, NY, USA), and the results were presented as mean ± standard deviation.
The physical properties of cherries, such as diameter, height, and firmness, actually affect the overall quality of the fruit (Asanica et al., 2011). In this study, stem length and thickness generally showed a fluctuating trend. The highest stem length was found in the 2nd week (46.11 mm) and the lowest in the 6th week (37.25 mm). The highest stem thickness (1.47 mm) was shown in the 1st week, while the lowest one (1.04 mm) was at the 2nd week. Regarding the fruit weight, width, and length in the 1st week, they were 0.69 g, 10.47 mm, and 12.28 mm, respectively, and these values reached 9.80 g, 27.43 mm, and 24.87 mm in the 8th week. The sphericity generally increased and peaked at week 5th (97.68%). Although a slight decrease was observed in the 7th week (93.95%), it increased again in the 8th week (95.91%) (Tab. 1). Çalhan et al. (2014) reported that in a study with 10 different harvest dates, the cv. Lapins cherry had a fruit weight, width, and length of 9.37 g, 26.91 mm, and 24.97 mm, respectively, at the optimum harvest time. Similarly, in a study with 5 different harvest periods, Valori et al. (2016) found that the cv. Burlat cherry had a fruit weight of 6.71 g and a length of 19.17 mm at its optimum harvest time. These differences can be related to genetics, cultivar variations, cultivation methods, and environmental factors such as climate and soil conditions.
Changes in physical properties of the 0900 Ziraat sweet cherry cultivar during the ripening period.
| Cultivar | Harvest Date | Stem length (mm) | Stem thickness (mm) | Fruit weight (g) | Fruit width (mm) | Fruit length (mm) | Sphericity (%) |
|---|---|---|---|---|---|---|---|
| 0900 Ziraat | 02.05.2017 | 36.35±1.59c | 1.47±0.04a | 0.69±0.06g | 10.47±0.37h | 12.28±0.23h | 88.36±1.13e |
| 09.05.2017 | 46.11±0.85a | 1.04±0.03c | 1.01±0.07fg | 11.60±0.27g | 13.48±0.3g | 89.78±0.53e | |
| 16.05.2017 | 42.47±1.78ab | 1.15±0.03c | 1.45±0.08f | 13.35±0.28f | 14.91±0.24f | 92.07±0.59d | |
| 23.05.2017 | 40.88±1.51abc | 1.28±0.04b | 2.44±0.14e | 15.69±0.26e | 17.11±0.24e | 94.40±0.68bc | |
| 30.05.2017 | 35.63±2.43c | 1.25±0.03b | 4.40±0.31d | 20.55±0.58d | 20.16±0.58d | 97.68±0.32a | |
| 06.06.2017 | 37.25±2.11bc | 1.18±0.03b | 6.31±0.23c | 23.94±0.42c | 21.58±0.34c | 96.26±0.46ab | |
| 13.06.2017 | 42.44±1.80ab | 1.24±0.04b | 8.49±0.25b | 25.95±0.38b | 23.97±0.25b | 93.95±0.77c | |
| 20.06.2017 | 42.12±1.91ab | 1.20±0.04b | 9.80±0.22a | 27.43±0.44a | 24.87±0.18a | 95.91±0.31ab | |
| Sig++. | 0.000 | 0.000 | 0.000 | 0.000 | 0.000 | 0.000 | |
Values of physical properties represent the mean of three independent experiments, with ten samples per replicate (n = 30). Different letters in the same column indicate statistically significant differences according to Duncan’s test (P < 0.001)
Color is considered an important indicator for determining physiological changes in fruits (Antal et al., 2013). In addition, color changes are often used to assess food quality during processing (Yusufe et al., 2017). The color values (L*, a*, b*, C*, and hue) of fruits recorded during the 8-week growth period of the 0900 Ziraat cultivar are presented in Tab. 2. The L* value was 39.96 in the 1st week and showed fluctuations up to the 5th week, reaching a peak of 43.91. After that, a downward trend started in the 6th week, and the value dropped to 25.59 in the 8th week, clearly showing that the fruit is fully mature and has changed from red to a dark purple-black.
Color parameters (L*, a*, b*, C*, and h⁰) of 0900 Ziraat sweet cherry cultivar
| No. | Harvest Date | L* | a* | b* | h⁰ | C* |
|---|---|---|---|---|---|---|
| 1 | 02.05.2017 | 39.96±0.71b | −4.39±0.33c | 5.65±0.54c | 128.01±0.65 | 7.16±0.63e |
| 2 | 09.05.2017 | 33.40±0.38d | −7.91±1.01cd | 14.89±1.65b | 117.87±1.03a | 16.87±1.91cd |
| 3 | 16.05.2017 | 34.91±0.07cd | −7.92±0.30cd | 15.13±0.24b | 117.60±0.58a | 17.08±0.35cd |
| 4 | 23.05.2017 | 40.30±1.15b | −8.57±0.19d | 22.67±0.64a | 110.71±0.34b | 24.24±0.65b |
| 5 | 30.05.2017 | 43.91±1.09a | 12.83±1.69b | 16.60±1.25b | 52.77±1.63c | 21.00±2.01bc |
| 6 | 06.06.2017 | 36.78±1.81c | 29.82±2.16a | 15.07±2.48b | 26.29±2.77d | 33.53±2.87a |
| 7 | 13.06.2017 | 29.72±1.22e | 28.56±1.55a | 8.61±1.74c | 16.31±2.35e | 29.90±1.98a |
| 8 | 20.06.2017 | 25.59±0.08f | 14.67±0.45b | 1.06±0.20d | 4.08±0.66f | 14.71±0.47d |
| Significance++ | 0.000 | 0.000 | 0.000 | 0.000 | 0.000 | |
Color values represent the mean of two independent experiments, with three samples per replicate (n = 6).
Different letters in the same column indicate statistically significant differences according to Duncan’s test (P < 0.001)
The a* value was negative in the first four weeks (−4.39 to −8.57), indicating a greenish hue. Subsequently, it increased to 12.83 in the 5th week, marking the onset of redness, and peaked at 29.82 in the 6th week. Its value slightly decreased in the 7th week (28.56) and there was a more pronounced decrease in the 8th week (14.67), indicating full ripening and a gradual reduction in redness. The b* value represents the blue-yellow color axis, where −b* indicates a shift to blue and +b* to yellow (Waskale & Bhong, 2017). The b* value increased up to the 4th week when it reached its highest value (22.67). From the 5th week on, it decreased continuously and reached its lowest value (1.06) in the 8th week. The increase in the b* value up to the 4th week, was followed by a decrease, and indicates that the yellow coloration of the fruit reaches its peak during ripening and decreases at the full maturity stage.
The hue angle (h⁰) indicates the position of a color on the color wheel in degrees and stands for certain colors: 0° (red), 60° (yellow), 120° (green), 180° (cyan), 240° (blue), and 300° (magenta). It reflects the dominant color tone or wavelength (Kasajima, 2019). The hue value decreased until the 4th week (110.71), with a significant decrease in the 5th week (52.77). It decreased in the following weeks, reaching 4.08 in the 8th week, indicating that the fruits changed from green to red during ripening. The chroma (C*) describes the intensity or saturation of a color, where higher chroma values indicate vibrant and pure colors and lower chroma values correspond to muted or grayish tones (Wrolstad & Smith, 2017). The chroma value increased until the 6th week (33.53), except in the 5th week, and then decreased until the 8th week (14.71). This finding indicates that the color saturation of the 0900 Ziraat cultivar increased during ripening and decreased after full ripening.
In many plants, the change in fruit color is due to the degradation of chlorophyll and the synthesis of new pigments (Ferrer et al., 2005). As the fruit ripens, different pigments take precedence, shaping its visual characteristics. In addition, biochemical transformations during growth contribute to variations in physical properties (Ochmian et. al., 2016). The skin color of cherries varies depending on the variety and is an important criterion for harvest and quality. As the fruit ripens, its color changes, which is influenced by the anthocyanin content (Göksel and Aksoy, 2014).
As the cherry ripens, the chlorophyll is broken down, the anthocyanins increase, and the sugar accumulates. This result leads to a color change from green to dark red, which is influenced by light, temperature, and nutrients (Gonçalves et al., 2007).
Firmness and elasticity are important quality characteristics that affect consumer preference and post-harvest performance. They help maintain fruit integrity, reduce mechanical damage, and extend shelf life, directly impacting marketability and overall quality (Crisosto et al., 2003; Ballistreri et al., 2013). In the 0900 Ziraat cultivar, firmness was found at its high level (1969.55–1988.36 g) between the 1st and 3rd week, but it decreased rapidly from the 4th week onward and reached its lowest value (232.55g) in the 8th week (Fig. 2). This change indicates that the texture of the fruit became softer during the ripening phase and the firmness decreased over time. On the other hand, the lowest elasticity value (1.47 mm) was recorded in the 4th week, while the highest value (2.93 mm) was measured in the 2nd week. The elasticity values showed slight fluctuations from the 5th week onwards and reached 2.10 mm in the 8th week. The elasticity of the fruit reflects its freshness and degree of ripeness. A higher elasticity indicates a firmer and more desirable fruit. As ripeness increases, the elasticity decreases, which affects the texture, shelf life, and market value (Li et al., 2010). Fruit softening plays a key role in ripening, which is caused by protopectin degradation, polymer shortening, and chemical changes that weaken the cell wall and alter texture (Zhou et al., 2021).
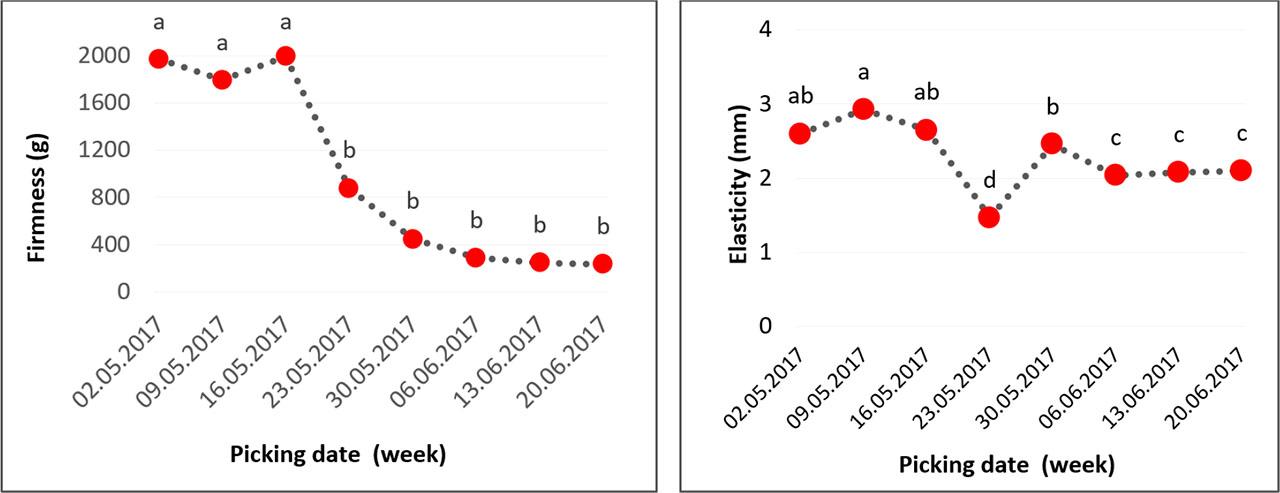
Changes in firmness (g) and elasticity (mm) of cv. 0900 Ziraat of sweet cherry during the ripening period. ANOVA results indicated these changes were statistically significant (P < 0.001).
pH is an important factor influencing cherry quality linked to color, anthocyanin levels, and phenols. While a pH range of 3–5 promotes anthocyanin formation, higher pH levels lead to color loss (Serradilla et al., 2012; Ballistreri et al., 2013). During the ripening period, the pH value of the 0900 Ziraat cultivar varied between 3.43 and 4.53 (Fig. 3). The pH value increased up to the 3rd week, reached its highest value of 4.53 and declined from the 4th week onwards and reached 3.43 in the 5th week. In the following weeks, it showed slight fluctuations and was recorded at 3.57 in the 8th week. Previous studies have reported similar results, with pH values ranging from 3.4 to 4.8 (Ballistreri et al., 2013; Chockchaisawasdee et al., 2016; Gonçalves et al., 2004; Hayaloğlu & Demir, 2016). Similar pH values for the 0900 Ziraat variety were reported by Bolcu & Akça, 2011 (4.27), İkinci & Bolat, 2015 (3.59), and Üstün & Bostan, 2022 (4.15).
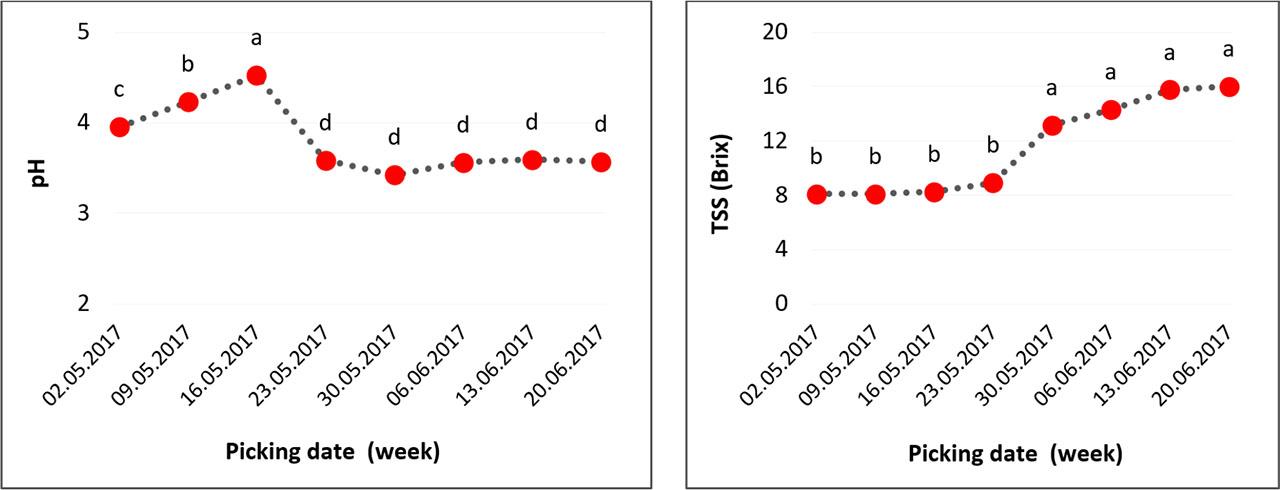
Changes in pH and total soluble solids measurement (TSS) of 0900 Ziraat sweet cherry cultivar during ripening. ANOVA results showed that changes in SSC were statistically significant (P < 0.001).
TSS is another important quality factor for sweet cherries. The balance of sugar and acidity improves the flavor of the cherry and increases consumer preference and acceptance (Ballistreri et al., 2013; Chockchaisawasdee et al., 2016). The TSS value showed slight changes in the first four weeks (8.10%–8.90%), then exhibited a significant increase from the 5th week onwards and reached its peak in the 8th week (16.00%) (Fig. 3). During the ripening process, the TSS/TA ratio increases due to a more significant increase in TSS compared to TA (Crisosto et al., 2003). The balance between TSS and TA is crucial in determining fruit flavor and is an important indicator of fruit quality (Serradilla et al., 2012). Çalhan et al. (2014) collected fruit samples of Lapin’s cherry cultivar at ten different stages and reported a continuous increase in TSS from the first to the last week. Mineata et al. (2024) recorded TSS values between 9.40 and 10.50 in three different cherry cultivars at two stages (pre-ripening and full ripening) and reported an increase in TSS from pre-ripening to full ripening. This result shows that the 0900 Ziraat cultivar shows the highest sugar content compared with other cultivars reported in the literature, indicating that the sweet taste of this cultivar makes it favorable to consumers.
The changes in ascorbic acid and citric acid contents during the ripening phase of the 0900 Ziraat cultivar are shown in Fig. 4. Citric acid content decreased significantly during the 8 weeks, reaching its peak (455.99 mg 100 g−1 fw) in the 2nd week and its lowest (55.76 mg 100 g−1 fw) in the 7th week. In general, citric acid continuously decreased from the 3rd to the last week. Ascorbic acid content fluctuated during the 8 weeks. The lowest value (106.72 mg 100 g−1 fw) was shown in the 1st week, while the highest values were shown in the 6th (214.52 mg 100 g−1 fw) and 8th week (255.67 mg 100 g−1 fw).
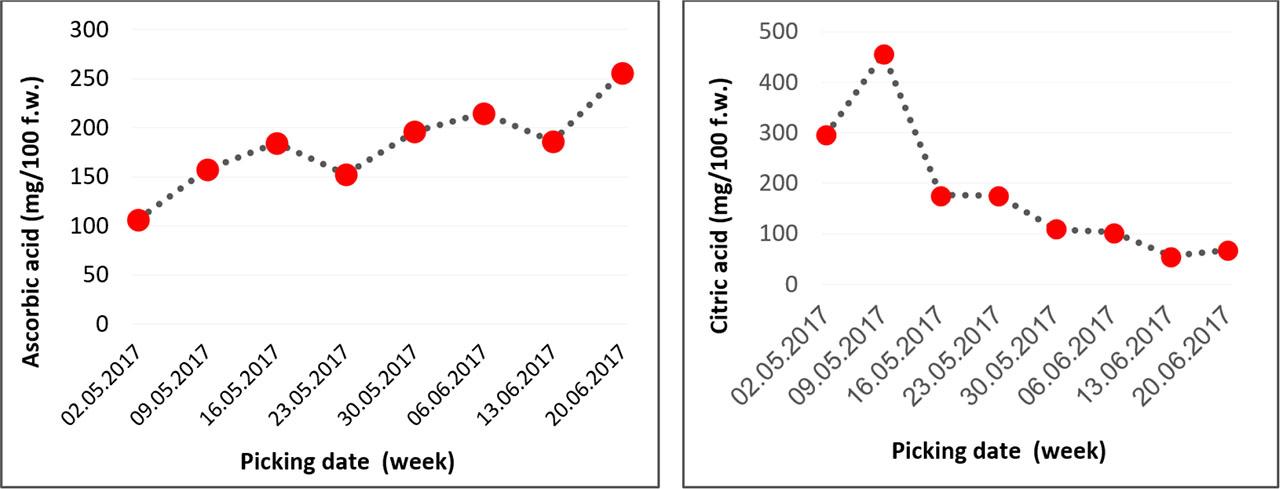
Changes in ascorbic acid and citric acid of 0900 Ziraat sweet cherry cultivar during the ripening period.
Ascorbic acid extends shelf life through its antioxidant properties, preserves color and flavor, and supports the immune system (He et al., 2024), while citric acid balances acidity, shapes the characteristic flavor profile, acts as a natural preservative and supports energy metabolism (Carr & Maggini, 2017). Usenik et al. (2008) found that the citric acid content in the fruit of 13 sweet cherry cultivars varied between 11 and 54 mg 100 g−1 fw. Hayaloglu and Demir (2016) reported that the citric acid content of 12 cherry cultivars ranged between 59 and 617 mg 100 g−1 fw. Mineata et al. (2024) reported an ascorbic acid content of 5.3 to 9.8 mg 100 g−1 fw in three cherry cultivars and found an increase in its value from pre-ripeness to full ripeness. In this study, the ascorbic acid content was higher than that reported by Mineata et al. (2024), while the citric acid content was consistent with the results of Usenik et al. (2008) and Hayaloglu & Demir (2016).
The changes in gallic acid and catechin during the ripening process of the 0900 Ziraat cultivar are shown in Fig. 5. Gallic acid generally decreased during the 8 weeks. The highest value was recorded in the 1st week (2670.14 mg 100 g−1 fw) and the lowest in the 7th week (293.24 mg 100 g−1 fw). A significant decrease in its value was observed from week 3 onwards, but a slight increase was detected in week 8 (592.93 mg 100 g−1 fw).
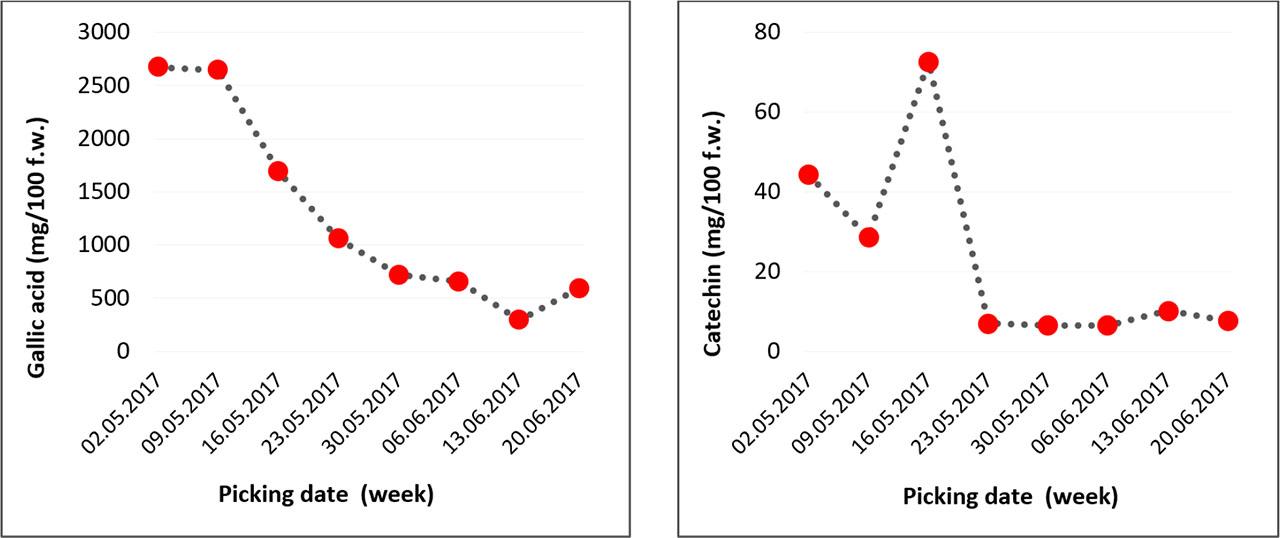
Changes in gallic acid and catechin of 0900 Ziraat sweet cherry cultivar during the ripening period.
Catechin soared in the 3rd week (72.78 mg 100 g−1 fw), followed by a sharp decrease in the 4th week, and reached its lowest values in the 5th and 6th weeks (6.43 mg 100 g−1 fw). A slight increase was observed in the 7th week (10.18 mg 100 g−1 fw), but in the 8th week the value dropped again to 7.54 mg 100 g−1 fw.
Gündoğdu and Bilge (2012) reported that 1.76–5.02 mg 100 g−1 of catechin was identified in sweet cherry cultivars, including the cv. 0900 Ziraat from Mardin, Türkiye. Canan et al. (2019) reported that the catechin content in 8 sweet cherry varieties, including cv. 0900 Ziraat, was between 1.00 and 8.03 mg 100 g−1. Kaya et al. (2024) found that the catechin content of the 0900 Ziraat cultivar was between 3.99 and 5.82 mg kg−1 fw at harvest time and after a (30-day) post-harvest period. The catechin and gallic acid concentrations observed in this study were within the ranges reported in previous studies. The content of these compounds may vary depending on factors such as genotype, degree of ripeness, climate, and storage conditions. (Serradilla et al., 2012; Chockchaisawasdee et al., 2016; Kaya et al., 2024).
In this study, the physical, chemical, morphological, and mechanical changes during the 8-week-ripening period of Ziraat 0900 cherry cultivar was investigated. Significant variations in the investigated parameters were observed during the ripening processing. The color changed from green to deep red as the a* and chroma values increased while the hue angle decreased, indicating an accumulation of anthocyanins. The color change intensified in the 5th week, peaked in the redness and saturation notes in the 6th week, and by the 8th week, the measured color values reflected the stage of full ripeness. Firmness was more pronounced in the first weeks but decreased rapidly from the 4th week and reached its lowest values in the 8th week, while elasticity fluctuated, reaching its lowest level in the 4th week and showing slight fluctuations after the 6th week. The TSS values continuously increased, while the pH values fluctuated during the ripening period. Organic acids, especially citric acid, decreased during ripening, while ascorbic acid fluctuated and peaked in the later stages. Phenolic compounds such as gallic acid and catechin also reduced over time, with a slight increase in the last few weeks. These results show that the optimum harvest time for the 0900 Ziraat sweet cherry cultivar is between the 7th and 8th week after full bloom. During this period, the fruit has reached its highest weight (9.80 g) and soluble solids content (16.00%), while firmness has declined to 232.55 g and the hue angle has dropped to 4.08°, indicating full ripeness. The concurrent changes in physical and biochemical traits confirm that this is the most suitable stage for harvest, when the fruit exhibits optimal size, sweetness, texture, and visual appeal. The outcomes of the present study can help producers and retailers collect 0900 ziraat sweet cherry cultivar at optimal harvest time when it possesses the highest sensory and nutritional quality parameters.