
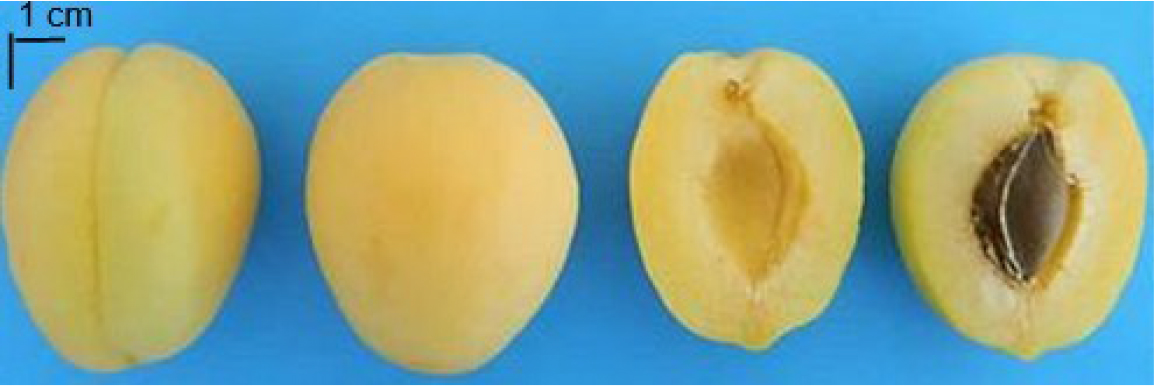
Fig. 1:
Fruit of “Şalak” apricot variety (Doğru Çokran, 2020)
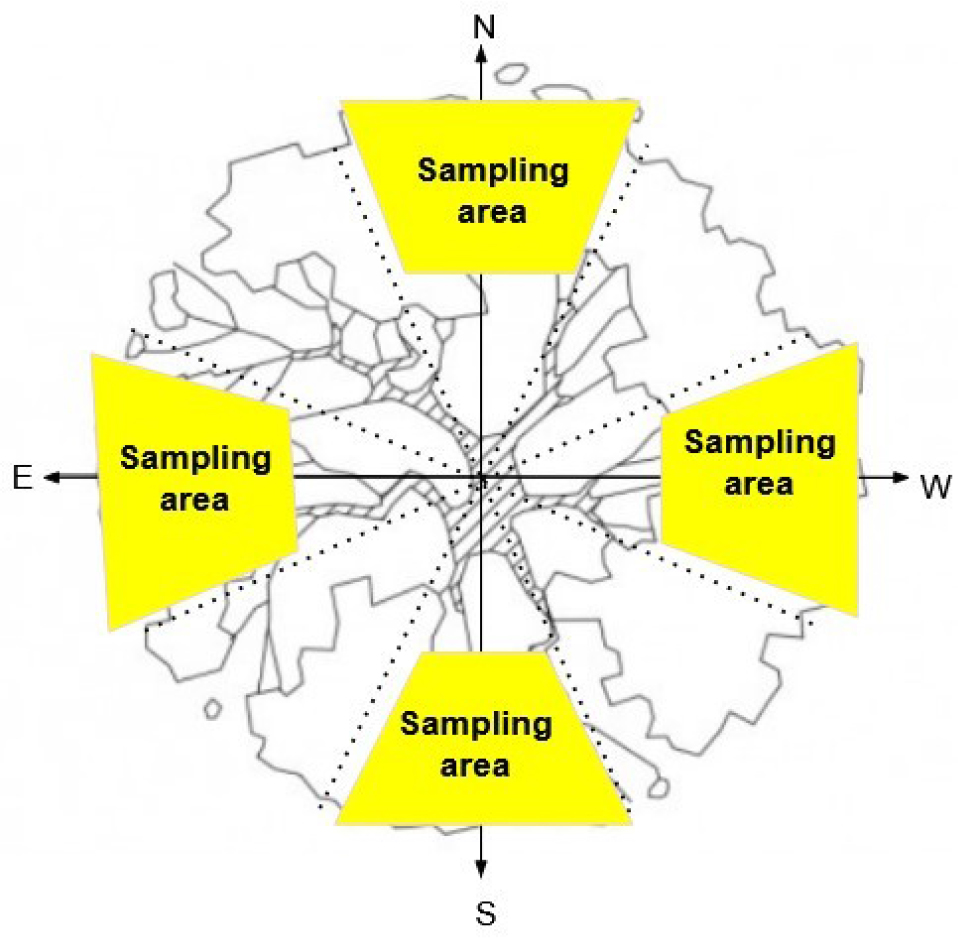
Fig. 2:
Illustration of sampling area within tree canopy. N; north, W; west, S; south, E; east.
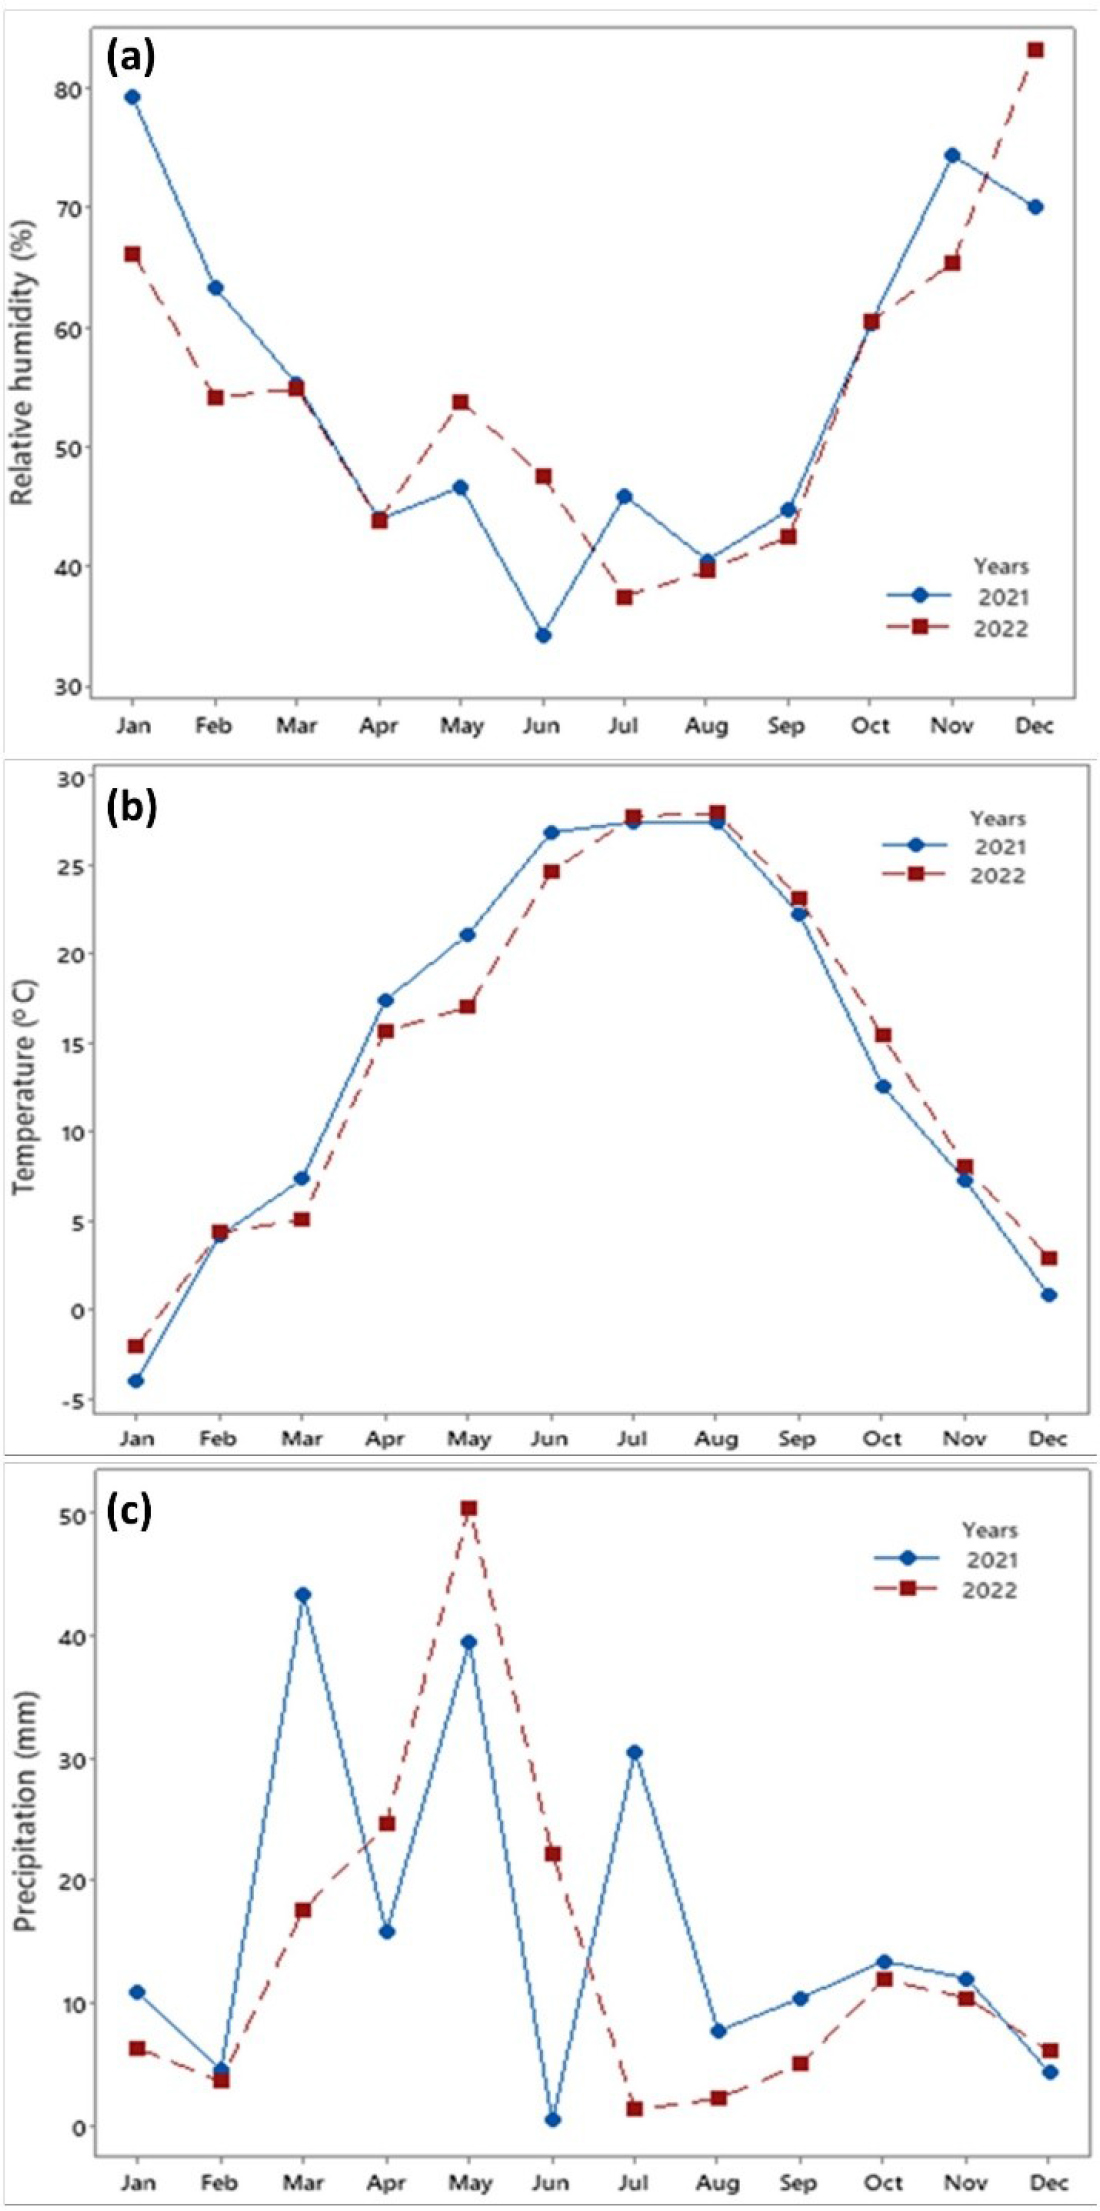
Fig. 3:
Weather conditions: (a) monthly relative humidity, (b) monthly temperature, and (c) monthly precipitation, in the study years (2021 and 2022)
Tab. 1:
Average of fruit size (dimension), geometric mean diameter, sphericity and flesh thickness (2021–2022)
| Directions | Years | Fruit width (mm) | Fruit length (mm) | Fruit thickness (mm) | Geometric mean diameter (mm) | Sphericity | Flesh thickness (mm) |
|---|---|---|---|---|---|---|---|
| East | 44.25 ab | 52.80 b | 42.29 a | 46.22 ab | 0.88 a | 12.60 b | |
| West | 43.97 b | 52.66 b | 41.94 a | 45.94 b | 0.87 a | 12.48 b | |
| North | 43.70 b | 52.39 b | 41.94 a | 45.78 b | 0.87 a | 12.48 b | |
| South | 44.68 a | 53.49 a | 42.56 a | 46.66 a | 0.87 a | 12.94 a | |
| 2021 | 43.14 b | 52.46 b | 40.35 b | 45.02 b | 0.86 b | 12.92 a | |
| 2022 | 45.16 a | 53.21 a | 44.02 a | 47.28 a | 0.89 a | 12.33 a | |
| F Value | |||||||
| Directions | 4.35** | 4.36** | 2.36ns | 4.31** | 0.56ns | 6.43*** | |
| Years | 100.83*** | 11.10*** | 356.49*** | 147.21*** | 236.90*** | 47.18*** | |
| Directions x Years | 0.065ns | 0.185ns | 0.714ns | 0.962ns | 4.17** | 0.43ns | |
Tab. 2:
Average of fruit and stone weight, flesh/stone ratio and fruit firmness (2021-2022)
| Directions | Years | Fruit weight (g) | Stone weight (g) | Flesh/stone ratio (%) | Fruit firmness (kg/cm2) |
|---|---|---|---|---|---|
| East | 53.59 b | 1.90 a | 96.43 a | 4.78 c | |
| West | 52.88 b | 1.95 a | 96.27 b | 5.30 b | |
| North | 51.92 b | 1.96 a | 96.21 b | 5.79 a | |
| South | 55.43 a | 1.96 a | 96.41 a | 4.16 d | |
| 2021 | 43.36 b | 1.62 b | 96.60 a | 5.60 a | |
| 2022 | 58.55 a | 2.27 a | 96.07 b | 4.42 b | |
| F Value | |||||
| Directions | 5.33*** | 2.14ns | 4.56*** | 36.48*** | |
| Years | 250.84*** | 905.57*** | 106.65*** | 103.10*** | |
| Directions x Years | 0.40ns | 0.52ns | 1.01ns | 12.76*** |
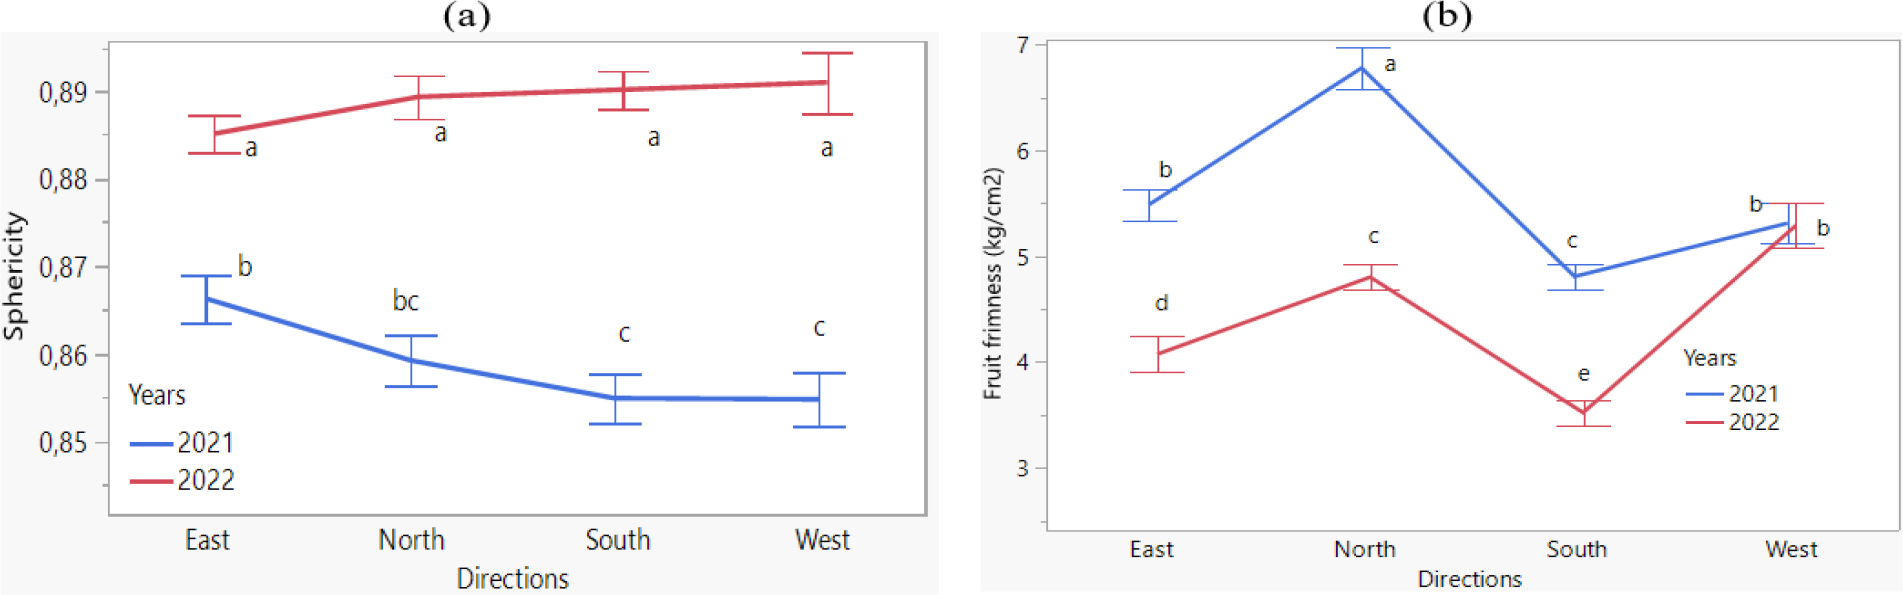
Fig. 4:
Interaction of directions x years for fruit sphericity (a) and fruit firmness (b). Different letters in the related visuals indicate significant differences according to the LSD test (p≤0.05).
Tab. 3:
Average of fruit colour parameters according to CIE L* a*b* (2021-2022)
| Directions | Years | L* | a* | b* | Hue° | Chroma |
|---|---|---|---|---|---|---|
| East | 81.57 a | 5.45 a | 46.47 a | 82.83 c | 47.02 a | |
| West | 80.91 a | 2.63 c | 43.26 a | 84.74 ab | 43.53 a | |
| North | 81.07 a | 3.54 bc | 46.88 a | 85.31 a | 47.20 a | |
| South | 78.36 b | 4.16 b | 44.09 a | 83.81 bc | 44.47 a | |
| 2021 | 83.21 a | 2.39 b | 40.92 a | 85.63 a | 41.05 b | |
| 2022 | 77.74 b | 5.50 a | 49.43 b | 82.71 b | 50.06 a | |
| F Value | ||||||
| Directions | 3.54** | 12.37*** | 2.13ns | 7.52*** | 2.30ns | |
| Years | 50.93*** | 85.96*** | 48.91*** | 54.08*** | 55.34*** | |
| Directions x Years | 3.61** | 6.85*** | 2.62* | 4.78*** | 2.42ns |
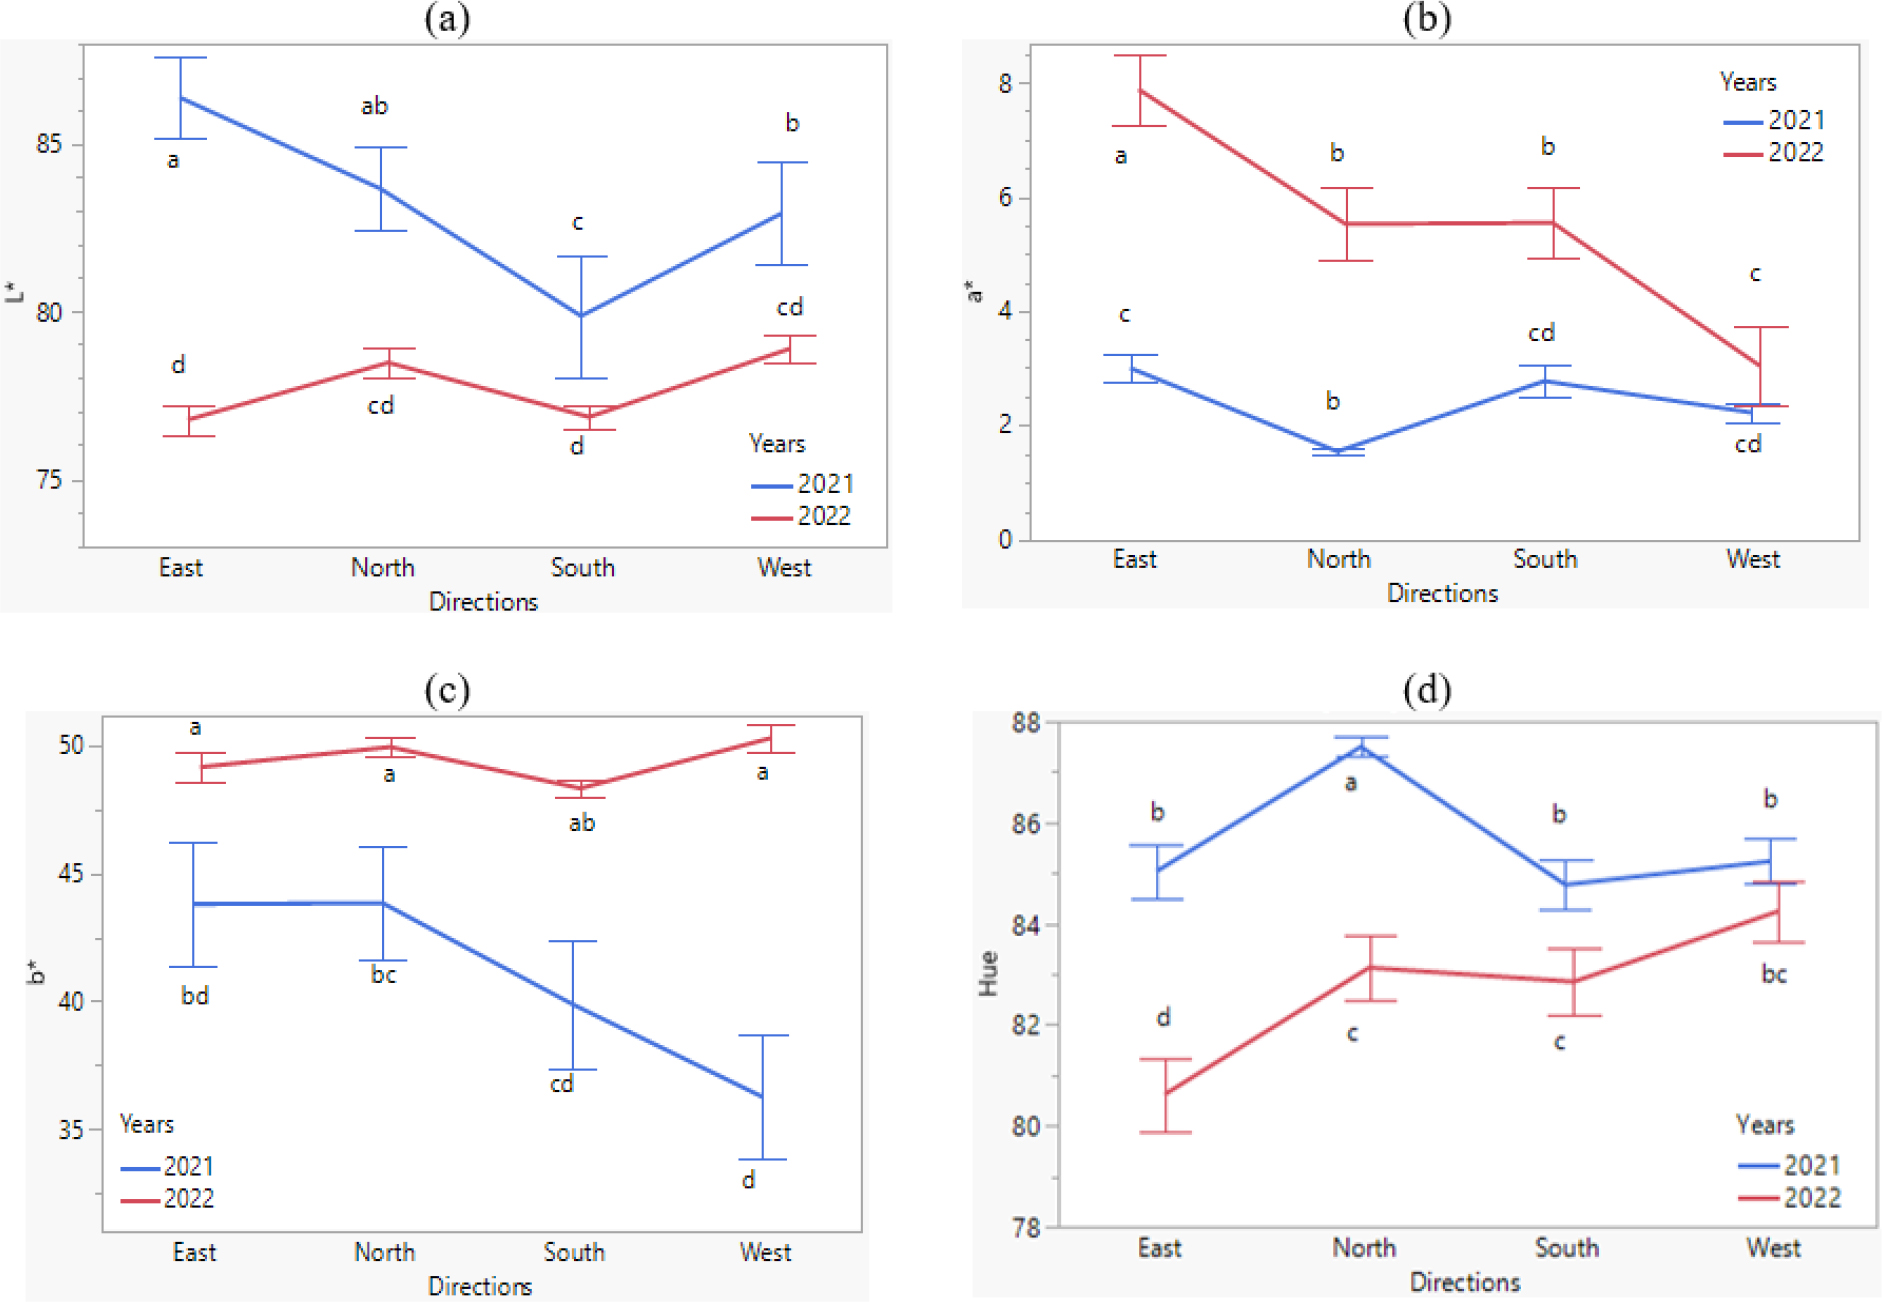
Fig. 5:
Interaction of directions x years for L* (a), a* (b), b* (c) and hue angle value (d). Different letters in the related visuals indicate significant differences according to the LSD test (p≤0.05).
Tab. 4:
Average of some chemical features in cv. “Şalak” fruit (2021-2022)
| Directions | Years | Soluble solid content (%) | Titratable acidity (g 100 g-1) | Ripening index | Fruit juice pH | Ascorbic acid (mg 100 g-1) |
|---|---|---|---|---|---|---|
| East | 14.53 a | 0.85 b | 17.26 a | 4.37 a | 15.84 b | |
| West | 13.10 c | 0.89 a | 15.03 c | 4.27 b | 16.97 a | |
| North | 13.12 c | 0.83 bc | 16.08 b | 4.29 b | 16.25 ab | |
| South | 13.97 b | 0.81 c | 17.80 a | 4.37 a | 14.88 c | |
| 2021 | 13.49 b | 0.89 a | 15.35 b | 4.18 b | 14.31 b | |
| 2022 | 13.87 a | 0.80 b | 17.76 a | 4.47 a | 17.66 a | |
| F Value | ||||||
| Directions | 25.61*** | 12.50*** | 26.15*** | 22.66*** | 10.65*** | |
| Years | 7.44* | 129.36*** | 102.80*** | 680.72*** | 156.14*** | |
| Directions x Years | 4.78** | 13.19*** | 19.09*** | 4.64*** | 10.73*** |
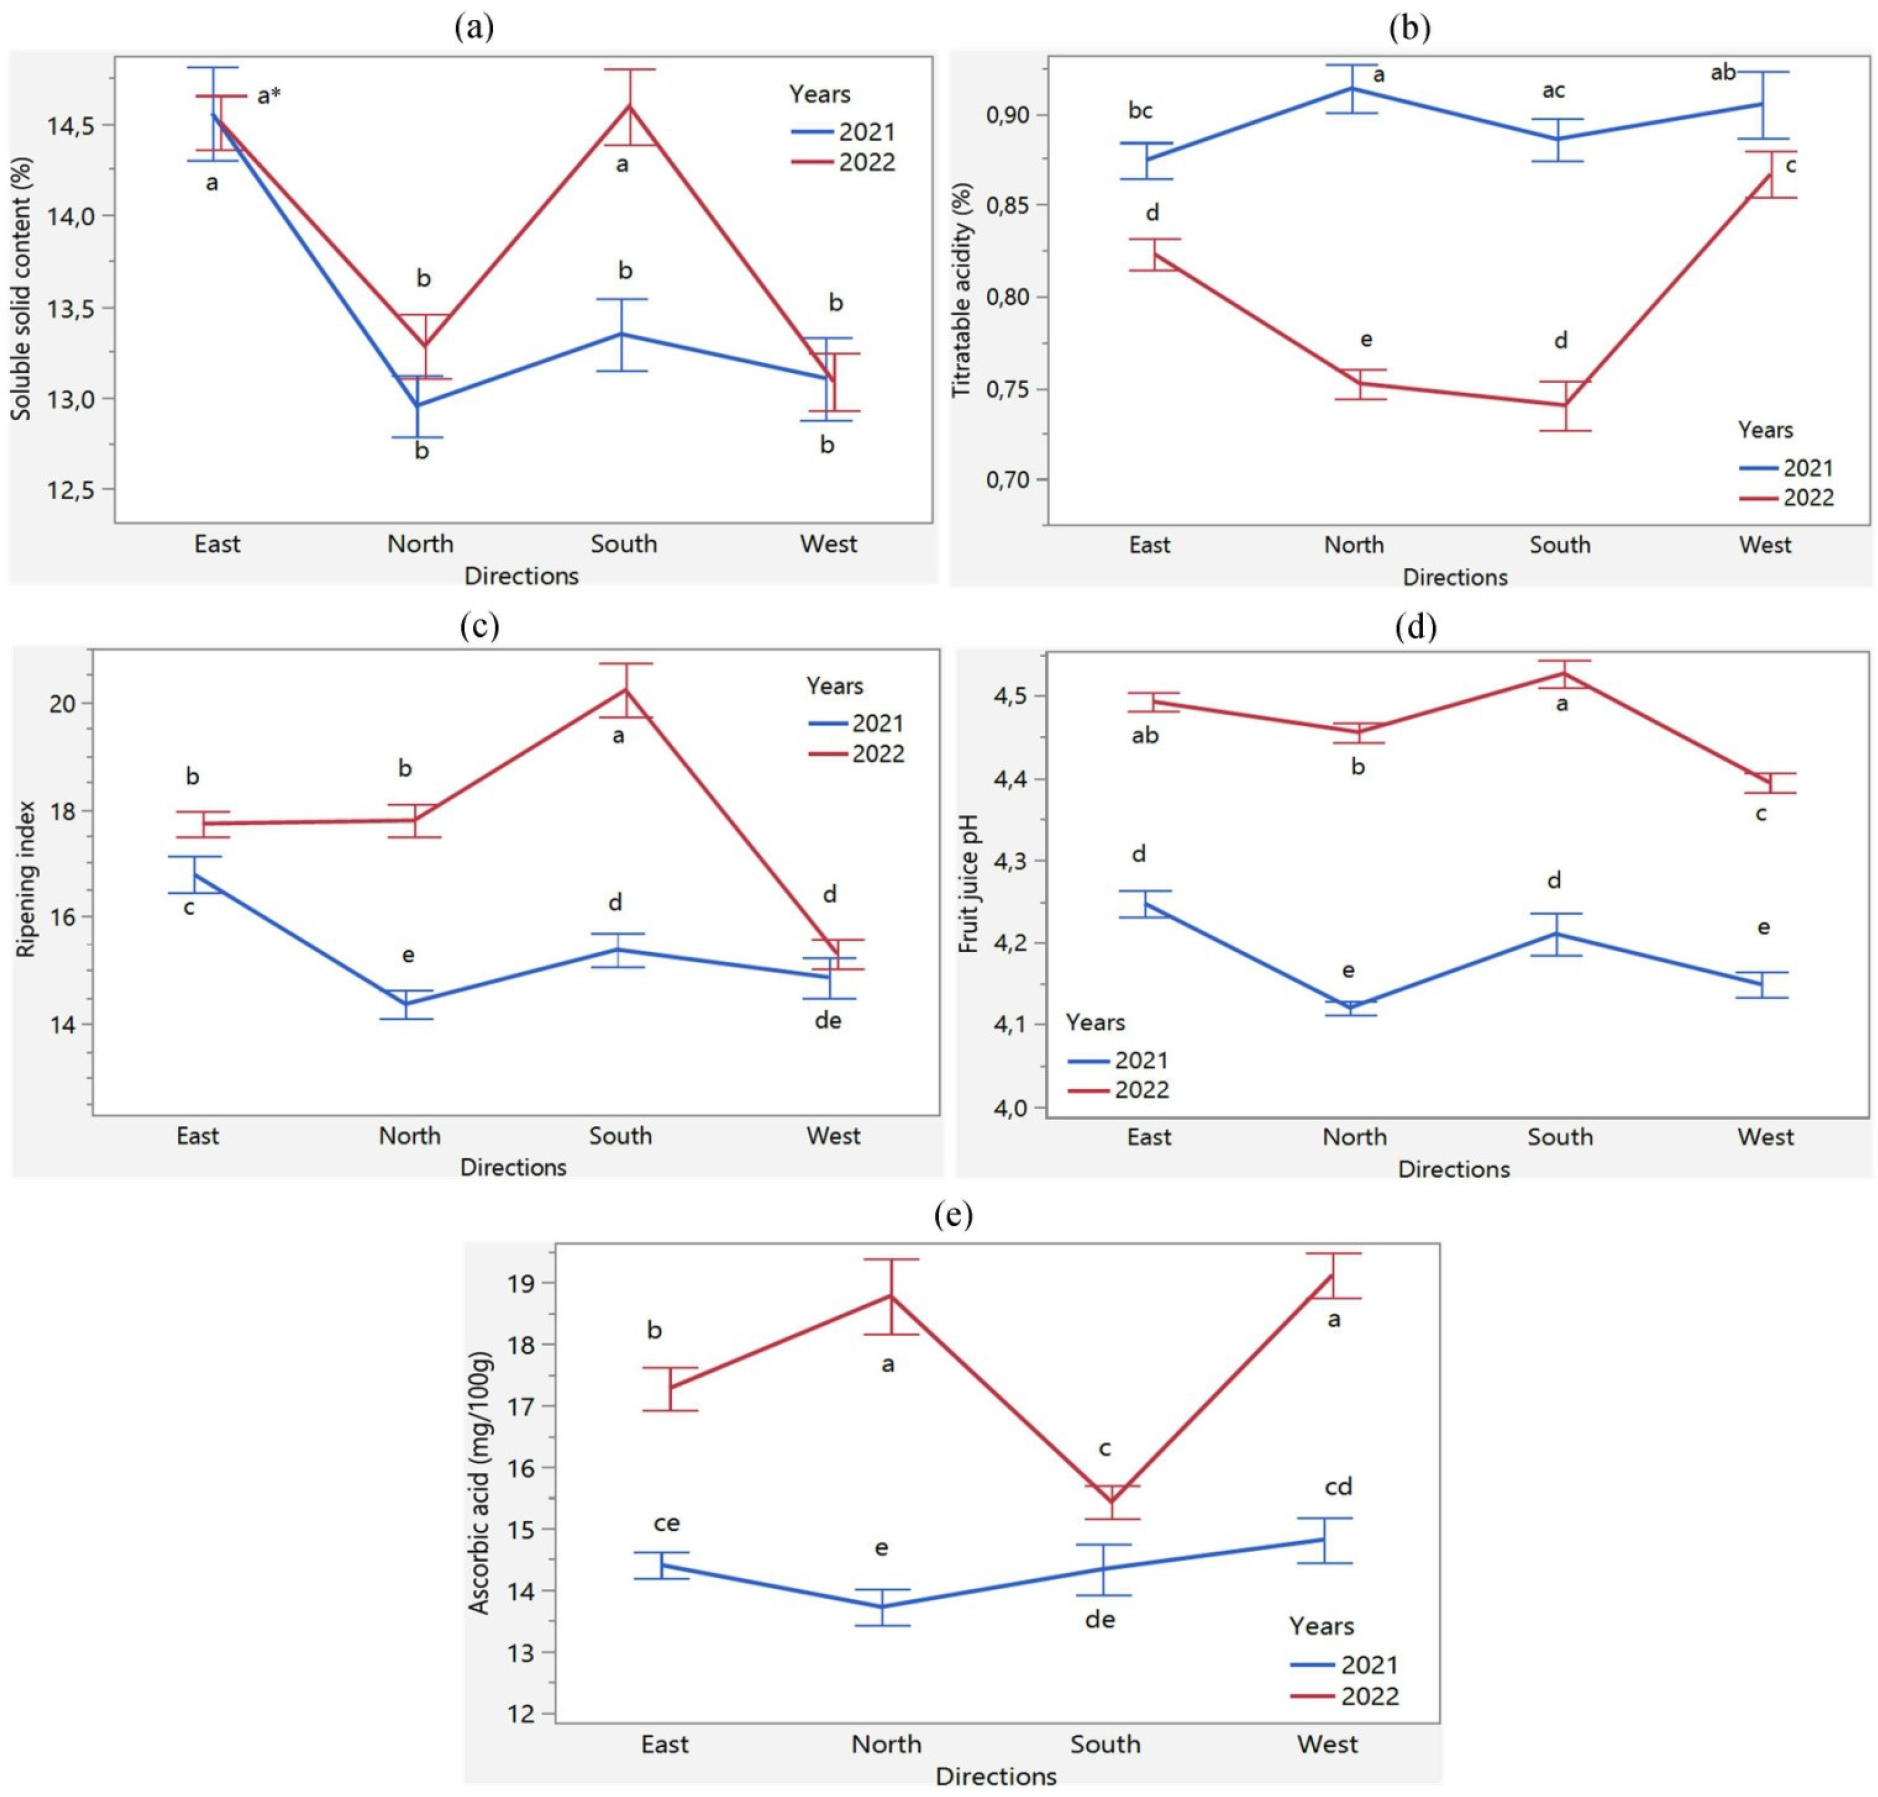
Fig. 6:
Interaction of directions x years for soluble solid content (a), acidity (b), ripening index (c), pH (d) and ascorbic acid (e). Different letters in the related visuals indicate significant differences according to the LSD test (p≤0.05).
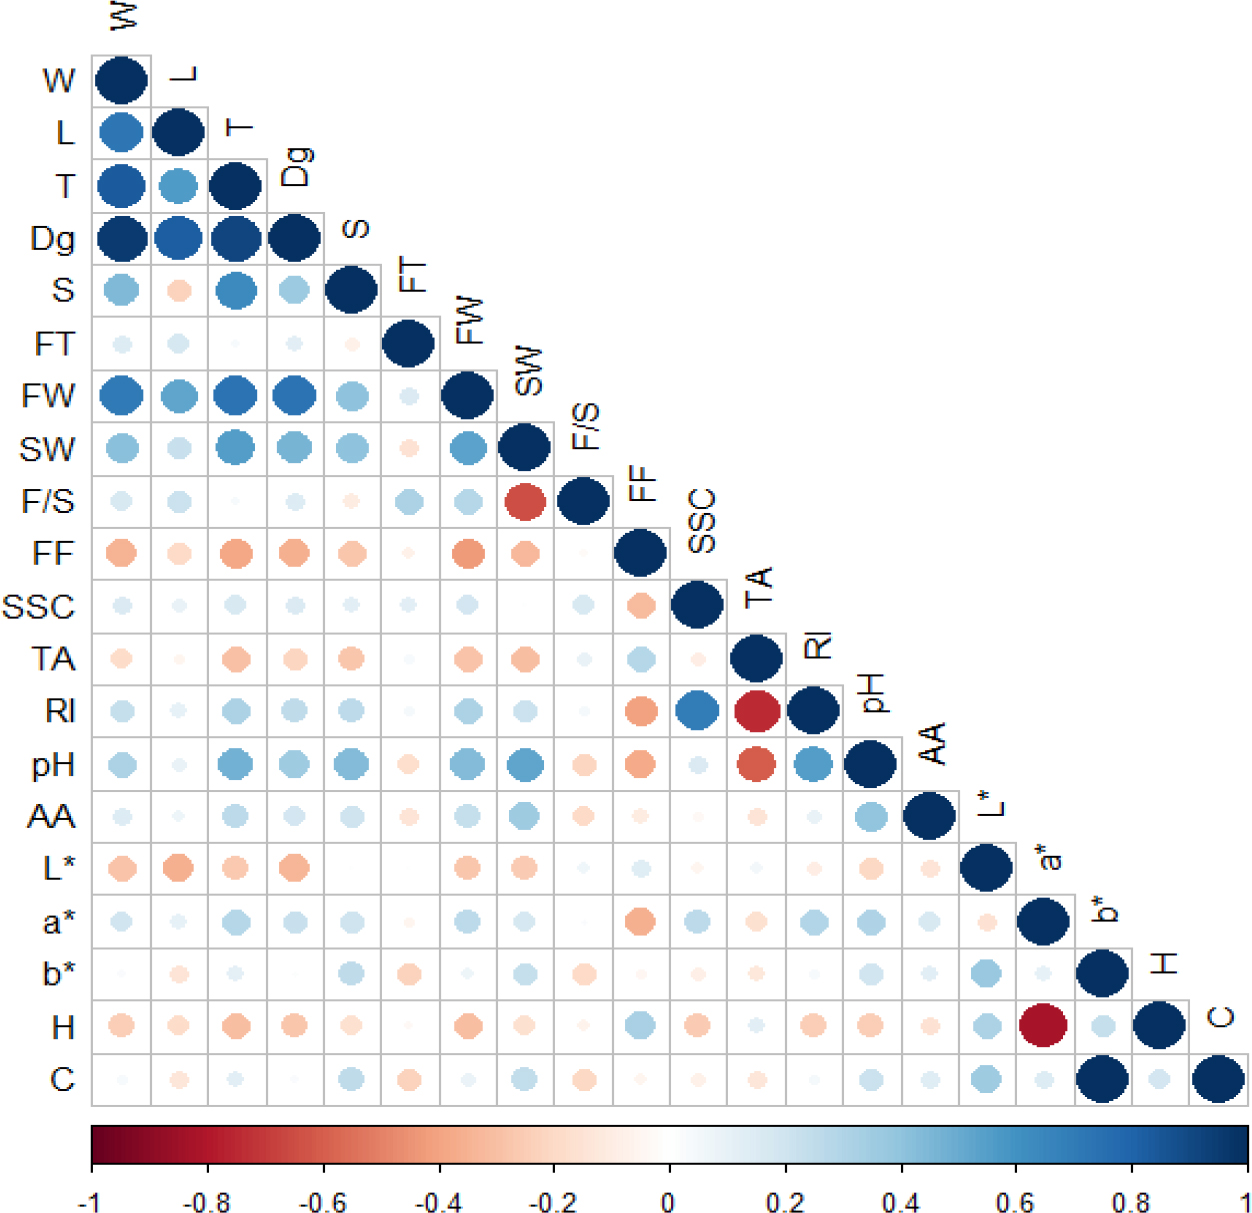
Fig. 7:
Pearson’s rank correlation among 20 studied variables. W; fruit width, L; fruit length, T; fruit thickness, Dg; geometric mean diameter, S; sphericity, FT; flesh thickness, FW; fruit weight, SW; stone weight, F/S; flesh/stone ratio, FF; fruit firmness, SSC; soluble solid content, TA; titratable acidity, RI; ripening index, AA; ascorbic acid, H; hue°, C; chroma
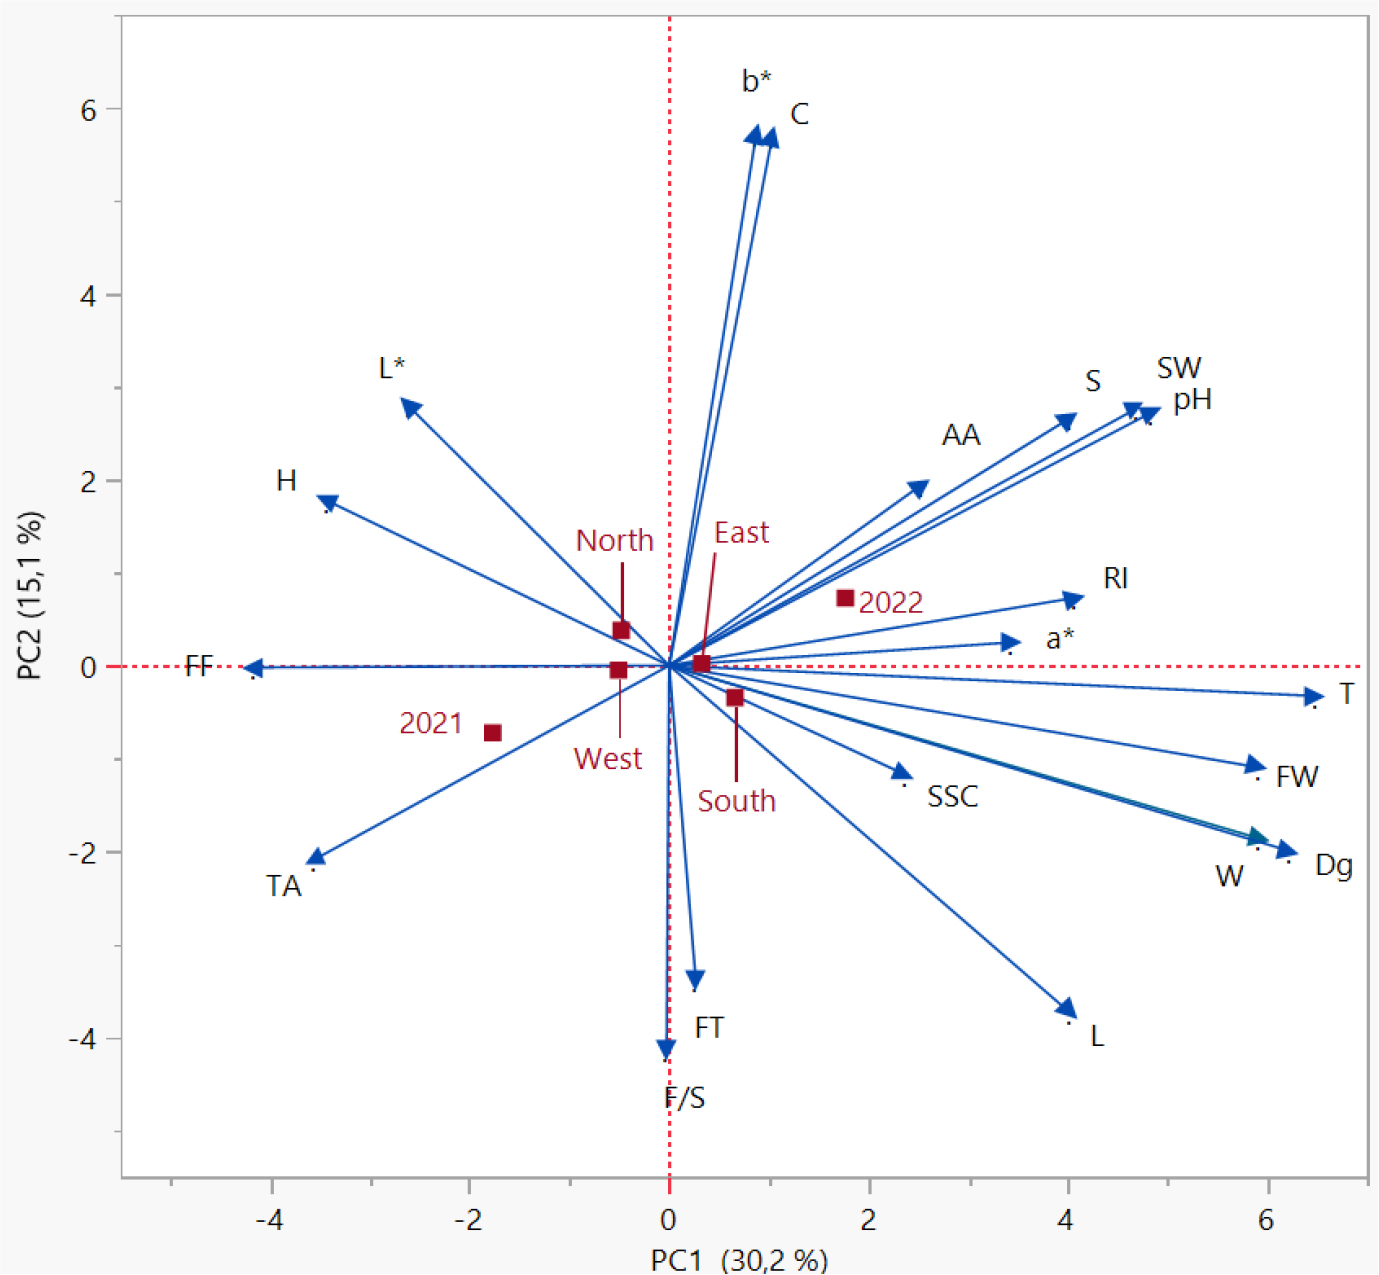
Fig. 8:
PCA analysis and biplot design illustration for relation direction, years and 20 studied traits. W; fruit width, L; fruit length, T; fruit thickness, Dg; geometric mean diameter, S; sphericity, FT; flesh thickness, FW; fruit weight, SW; stone weight, F/S; flesh/stone ratio, FF; fruit firmness, SSC; soluble solid content, TA; titratable acidity, RI; ripening index, AA; ascorbic acid, H; hue°, C; chroma