
Table 1.
Synthesis of construct measurements
| Construct | Item Code | Measurement item (Adapted for QRIS) | Supporting literature |
|---|---|---|---|
| Risk Avoidance | RAV01 | Concerned about complicated relationships with other merchants. | Čirjevskis (2025) |
| RAV02 | Reluctance to make cost-related adjustments. | Hosomi and Ge (2025) | |
| RAV03 | Not implemented because it is not government-mandated. | Ruberti and Calciolari (2025) | |
| RAV04 | Fear of disruption to business operations. | Kiettikunwong and Sangsarapun (2025) | |
| RAV05 | Perception of QRIS as a risky digital tool. | Bouzguenda and Jarboui (2025) | |
| Risk Control | RC01 | Focusing on minimizing the chance of customer misuse. | Taherdoost (2021) |
| RC02 | Ensuring safety for both business and customers. | Ferrara et al. (2024) | |
| RC03 | Regular monitoring to identify usage problems early. | Chen et al. (2024) | |
| RC04 | Adjusting infrastructure to ensure effective usage. | Hiebl (2024) | |
| RC05 | Meticulous planning to avoid usage issues. | Osei-Kyei et al. (2022) | |
| Risk Mitigation | RM01 | Studying cost changes resulting from adoption. | Balea-Stanciu et al. (2025) |
| RM02 | Keeping manual transaction notes as a backup. | Sapountzaki (2022) | |
| RM03 | Setting aside emergency funds for QRIS-related issues. | Akomea-Frimpong et al. (2024) | |
| RM04 | Using QRIS alongside other digital tools (e.g., e-wallets). | Hosseini Shekarabi et al. (2025) | |
| RM05 | Accepting traditional cash alongside QRIS. | Rezvani et al. (2023) | |
| Risk Transfer | RT01 | Relying on known individuals to manage financial risks. | Leng et al. (2017) |
| RT02 | Letting experts handle adoption to avoid regulation risk. | Ashmawi et al. (2018) | |
| RT03 | Relying on community/networks to manage adoption. | Feng and Liu (2025) | |
| RT04 | Delegating tasks to avoid single-person responsibility. | Feng (2023) | |
| RT05 | Asking official parties to handle technical complications. | Franco et al. (2024) | |
| Risk Acceptance | RAC01 | Accepting risks as a natural part of doing business. | Marhavilas and Koulouriotis (2021) |
| RAC02 | Believing that financial risks are eventually manageable. | Jain et al. (2023) | |
| RAC03 | Tolerating the possibility of technical issues. | Ludvigsen and Parnell (2023) | |
| RAC04 | Accepting risks after gaining sufficient understanding. | Panos and Wilson (2020) | |
| RAC05 | Accepting risks because benefits outweigh drawbacks. | Barraza de la Paz et al. (2023) |
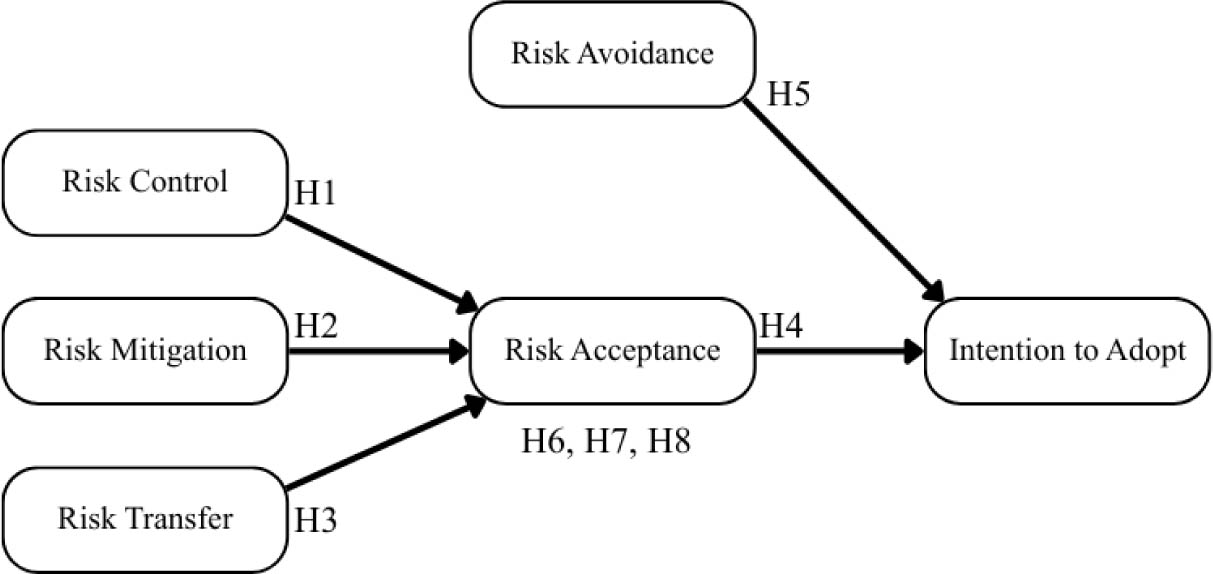
Figure 1.
Research framework
Source: own processing
Table 2.
Respondents’ profile
| Category | Type | Number of respondents (Total 150) | Percentage of respondents |
|---|---|---|---|
| Respondent Age | < 20 years old | 9 | 6.0% |
| 20 – 29 years old | 20 | 8.7% | |
| 30 – 39 years old | 27 | 13.3% | |
| 40 – 49 years old | 46 | 18.0% | |
| 50 – 59 years old | 35 | 30.7% | |
| > 59 years old | 13 | 23.3% | |
| Business Age | < 1 years old | 21 | 14.0% |
| 1 – < 3 years old | 32 | 21.3% | |
| 3 – 5 years old | 20 | 13.3% | |
| >5 years old | 77 | 51.3% | |
| Business Type | Services | 8 | 5.3% |
| F&B | 78 | 52.0% | |
| Trade / Retail | 64 | 42.7% | |
| Average Monthly Sales | < IDR 5,000,000 | 126 | 84.0% |
| IDR 5,000,001 – 10,000,000 | 19 | 12.7% | |
| IDR 10,000,001 – 15,000,000 | 3 | 2.0% | |
| IDR 15,000,001 – 20,000,000 | 2 | 1.3% | |
| Location | Bandung City (purposive sampling) | 150 | 100% |
| QRIS System Implemented | No (purposive sampling) | 150 | 100% |
Table 3.
Measurement model evaluation
| Variable | Items | Outer Loading | Cronbach’s Alpha | Composite Reliability (rho_a) | Composite Reliability (rho_c) | Average Variance Extracted |
|---|---|---|---|---|---|---|
| Intention to Adopt (IA) | IA01 | 0.864 | 0.907 | 0.912 | 0.931 | 0.730 |
| IA02 | 0.883 | |||||
| IA03 | 0.890 | |||||
| IA04 | 0.785 | |||||
| IA05 | 0.846 | |||||
| Risk Acceptance (RAC) | RAC01 | 0.810 | 0.878 | 0.881 | 0.911 | 0.673 |
| RAC02 | 0.880 | |||||
| RAC03 | 0.829 | |||||
| RAC04 | 0.794 | |||||
| RAC05 | 0.787 | |||||
| Risk Avoidance (RAV) | RAV01 | 0.770 | 0.734 | 0.736 | 0.849 | 0.652 |
| RAV02 | 0.835 | |||||
| RAV03 | 0.817 | |||||
| Risk Control (RC) | RC01 | 0.741 | 0.882 | 0.905 | 0.912 | 0.677 |
| RC02 | 0.792 | |||||
| RC03 | 0.860 | |||||
| RC04 | 0.852 | |||||
| RC05 | 0.860 | |||||
| Risk Mitigation (RM) | RM01 | 0.775 | 0.783 | 0.784 | 0.860 | 0.606 |
| RM02 | 0.765 | |||||
| RM03 | 0.818 | |||||
| RM04 | 0.755 | |||||
| Risk Transfer (RT) | RT01 | 0.789 | 0.813 | 0.814 | 0.877 | 0.640 |
| RT02 | 0.806 | |||||
| RT03 | 0.778 | |||||
| RT04 | 0.826 |
Table 4.
Discriminant validity (Fornell-Larcker)
| Variable | IA | RAC | RAV | RC | RM | RT |
|---|---|---|---|---|---|---|
| IA | 0.855 | |||||
| RAC | 0.562 | 0.821 | ||||
| RAV | 0.248 | 0.080 | 0.808 | |||
| RC | 0.429 | 0.529 | 0.167 | 0.823 | ||
| RM | 0.465 | 0.647 | 0.115 | 0.751 | 0.778 | |
| RT | 0.417 | 0.563 | 0.278 | 0.296 | 0.421 | 0.800 |
Table 5.
Direct effects
| Direct Effect | Path Coefficients | P Values | 95% Confidence Interval Path Coefficient | F Square | |
|---|---|---|---|---|---|
| Lower Limit | Upper Limit | ||||
| H1: RC -> RAC | 0.117 | 0.203 | −0.064 | 0.291 | 0.013 |
| H2: RM -> RAC | 0.409 | 0.000 | 0.240 | 0.568 | 0.138 |
| H3: RT -> RAC | 0.357 | 0.000 | 0.206 | 0.503 | 0.221 |
| H4: RAC -> IA | 0.546 | 0.000 | 0.406 | 0.678 | 0.461 |
| H5: RAV -> IA | 0.204 | 0.006 | 0.060 | 0.347 | 0.065 |
Table 6.
Indirect effects
| Indirect Effect | Path Coefficients | P Values | Lower Limit | Upper Limit | Upsilon (υ) |
|---|---|---|---|---|---|
| H6: RC -> RAC -> IA | 0.064 | 0.223 | −0.031 | 0.172 | 0.004 |
| H7: RM -> RAC -> IA | 0.223 | 0.000 | 0.130 | 0.339 | 0.049 |
| H8: RT -> RAC -> IA | 0.195 | 0.000 | 0.109 | 0.298 | 0.038 |
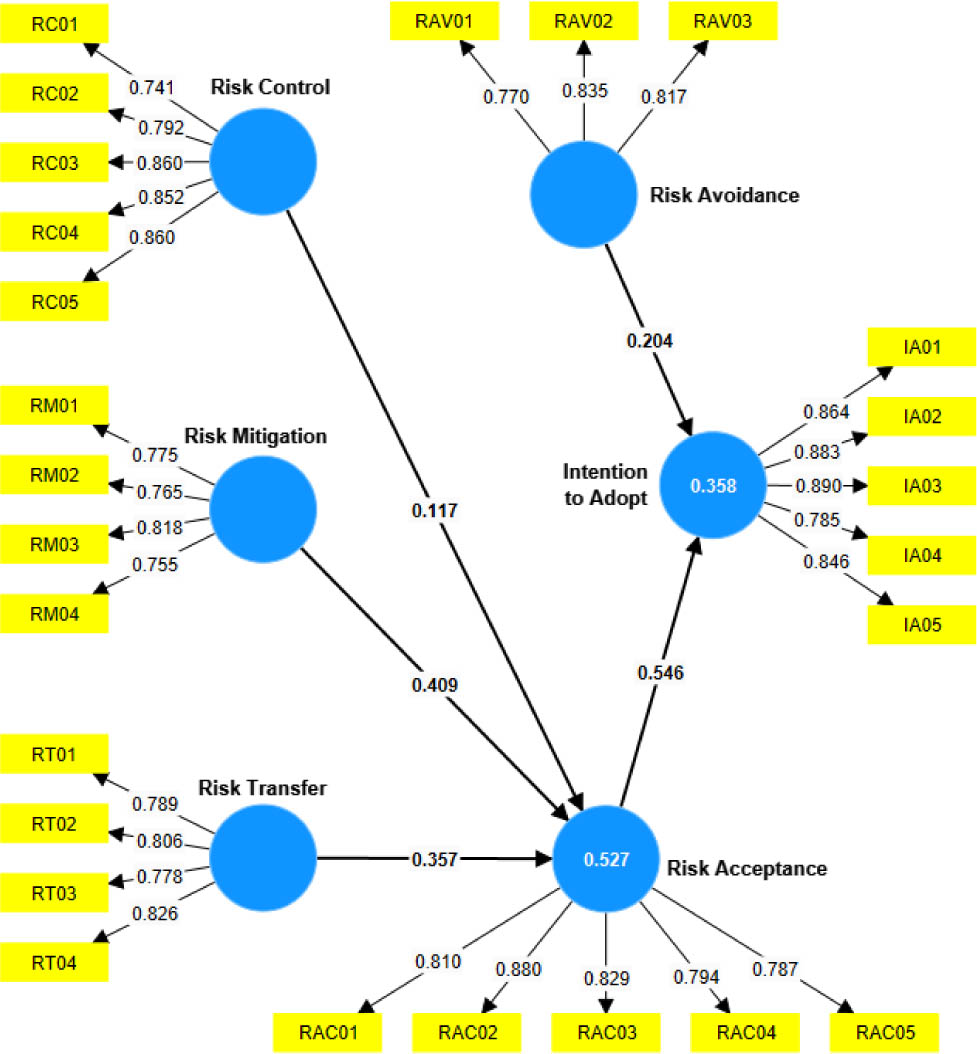
Figure 2.
Outer model
Source: own processing