
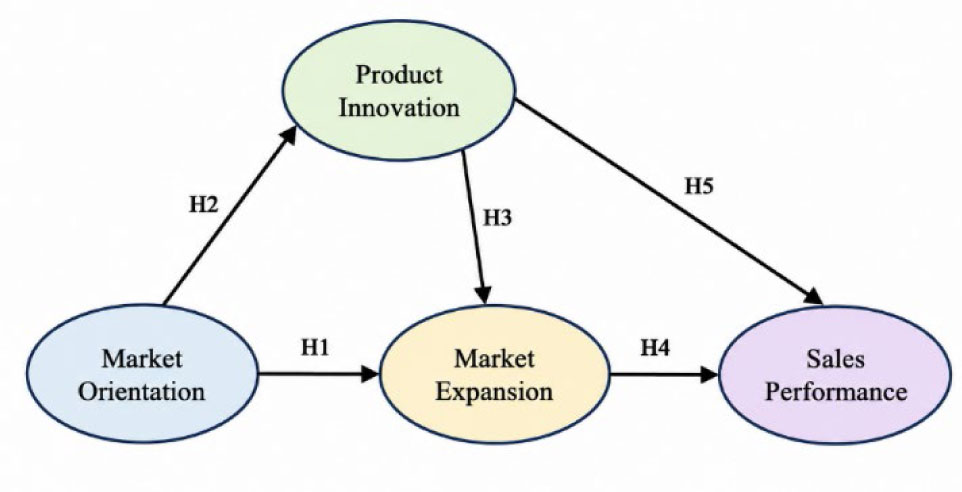
Figure 1.
Conceptual framework of the study
Source: own processing
Table 1.
Reliability and convergent validity of the constructs
| Constructs | Loadings | AVE | Cronbach’s Alpha | Composite reliability |
|---|---|---|---|---|
| Market Orientation | 0.818 | 0.890 | 0.931 | |
| MO1: Customer preferences are regularly considered when deciding what products to offer (Talaja et al., 2017) | 0.900 | |||
| MO2: Information about competitors is used when planning products or services (Narver & Slater, 1999) | 0.919 | |||
| MO3: Feedback from customers is used to improve products or services (Talaja et al., 2017) | 0.908 | |||
| Product Innovation | 0.826 | 0.895 | 0.934 | |
| PI1: New menu items or products are introduced periodically (Parichatnon et al., 2025) | 0.873 | |||
| PI2: Existing menus are modified or improved to offer something different (Parichatnon et al., 2025) | 0.901 | |||
| PI3: New ideas are applied to create unique food or beverage offerings (Calantone et al., 2002) | 0.889 | |||
| Market Expansion | 0.788 | 0.866 | 0.918 | |
| ME1: Efforts are made to reach customers in new areas or locations (Gerhardt et al., 2022) | 0.919 | |||
| ME2: New customer groups are targeted beyond the usual buyers (Gerhardt et al., 2022) | 0.986 | |||
| ME3: Additional sales channels are used to reach more customers (Gerhardt et al., 2022) | 0.900 | |||
| Sales Performance | 0.803 | 0.884 | 0.924 | |
| SP1: The number of units sold has increased (Shapiro & Gómez, 2014) | 0.909 | |||
| SP2: Our sales revenue keeps growing (Shapiro & Gómez, 2014) | 0.885 | |||
| SP3: More customers choose our products over competitors (Shapiro & Gómez, 2014) | 0.894 |
Table 3.
Collinearity assessment (VIF)
| Path | VIF |
|---|---|
| Market Expansion ➔ Sales Performance | 1.139 |
| Market Orientation ➔ Market Expansion | 1.347 |
| Market Orientation ➔ Product Innovation | 1.000 |
| Product Innovation ➔ Market Expansion | 1.347 |
| Product Innovation ➔ Sales Performance | 1.138 |
Table 4.
Path coefficients
| Path | Path coefficient | T-statistics | P-values |
|---|---|---|---|
| Market Expansion ➔ Sales Performance | −0.347 | 5.056 | 0.000 |
| Market Orientation ➔ Market Expansion | 0.265 | 2.730 | 0.007 |
| Market Orientation ➔ Product Innovation | 0.508 | 7.784 | 0.000 |
| Product Innovation ➔ Market Expansion | 0.214 | 2.478 | 0.014 |
| Product Innovation ➔ Sales Performance | 0.547 | 9.383 | 0.000 |