
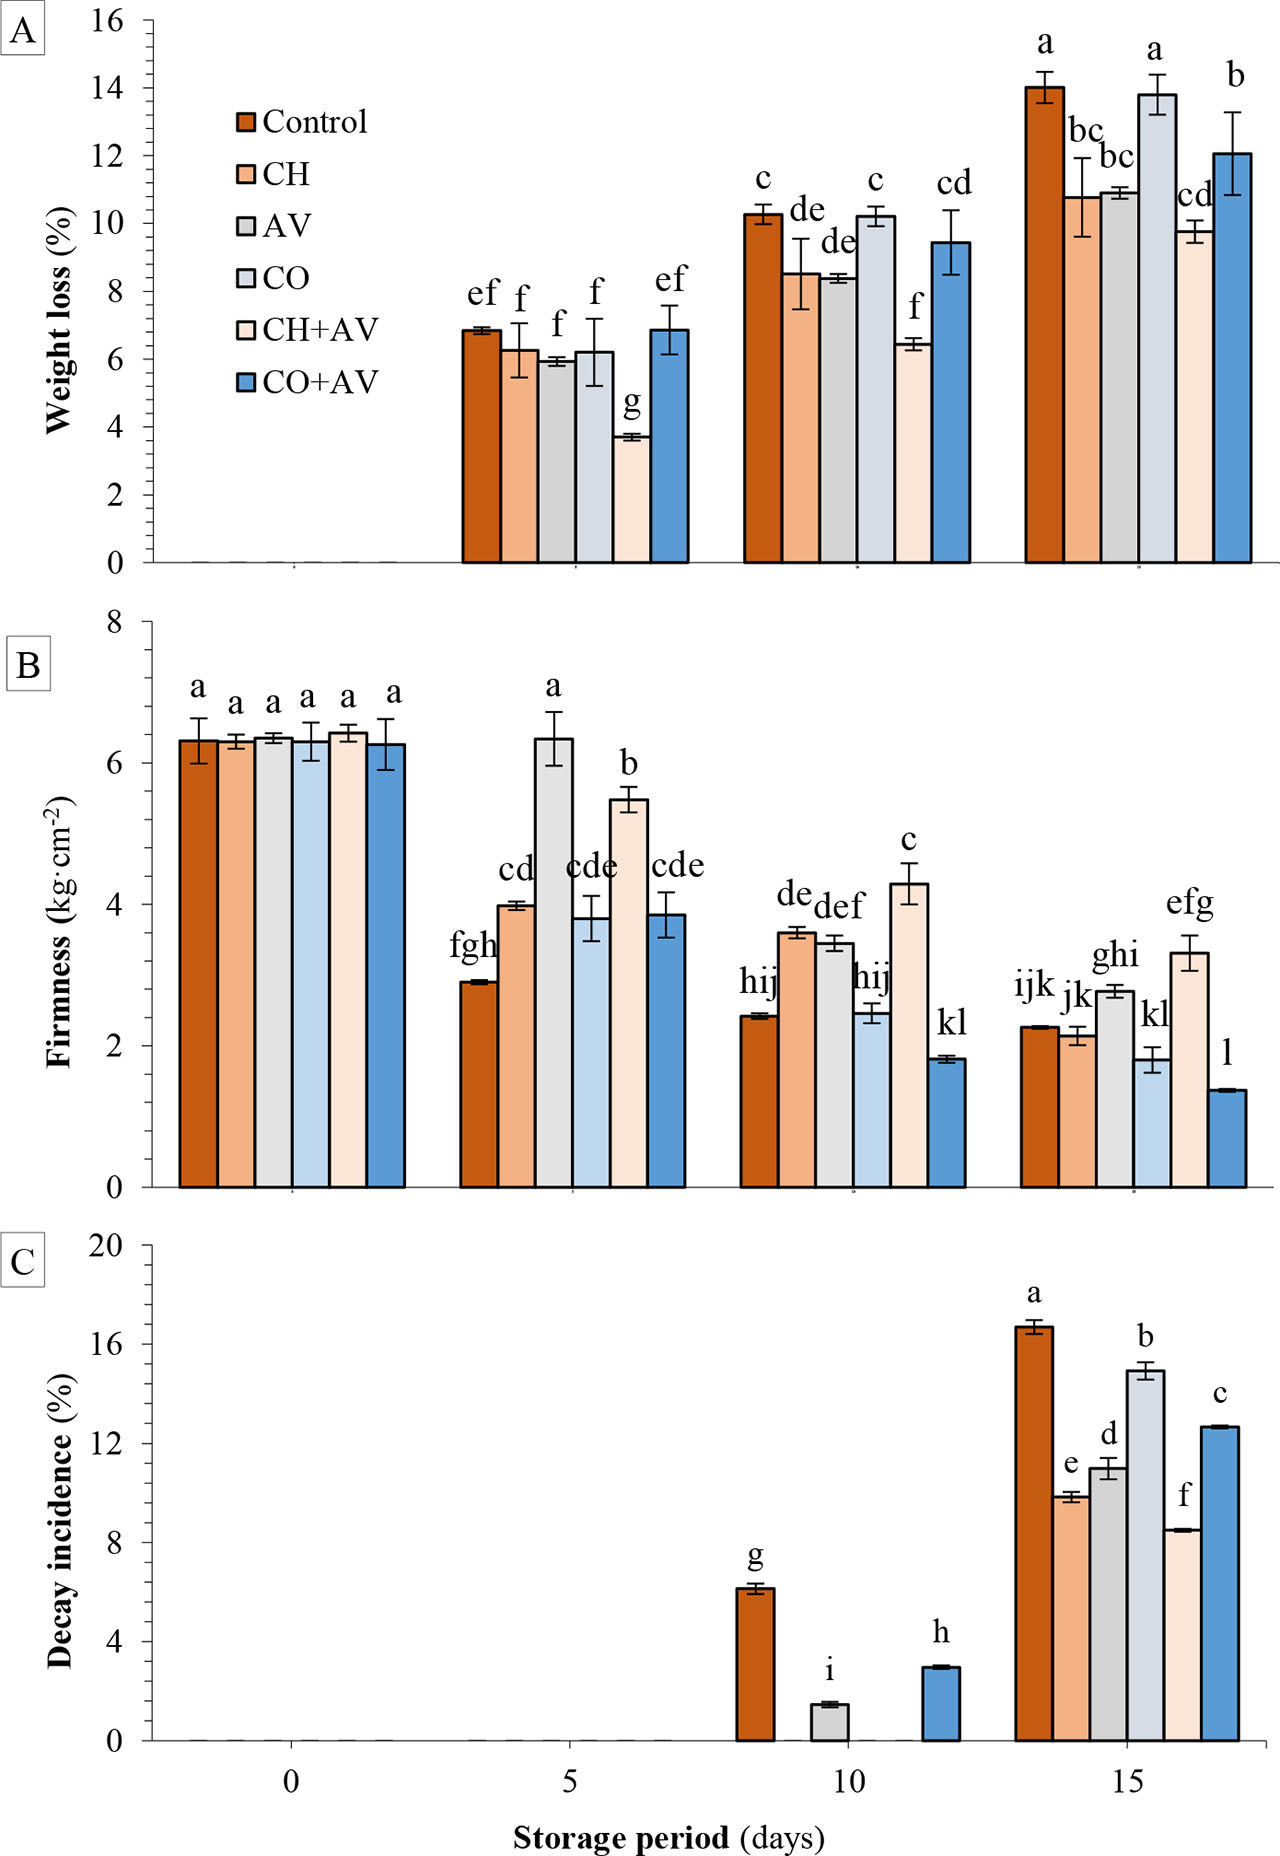
Figure 1.
Effect of storage time and fruit coatings on weight loss (A), firmness (B), and decay (C) of ‘Haribhanga’ mangoes during 15 days of storage at 25 ± 2 °C and 80–85% relative humidity
The vertical bars indicate the standard errors of the means (n = 3); the means indicated by the same letters do not differ significantly according to LSD test (p < 0.05); control – distilled water, CH – 1.5% chitosan solution, AV – Aloe vera gel, CO – coconut oil, CH + AV – 1.5% chitosan + A. vera gel, and CO + AV – coconut oil + A. vera gel
Table 1.
Effect of storage time and fruit coating treatments on ascorbic acid, TSS, TA, and pH of mango fruit (‘Haribhanga’) during storage at 25 ± 2 °C and 80–85% relative humidity for 15 days
| Storage time (days) | 0 | 5 | 10 | 15 | Mean (coatings) |
|---|---|---|---|---|---|
| Ascorbic acid (mg·100 g−1) | |||||
| Control | 28.2 ± 0.46a | 16.7 ± 0.37de | 14.7 ± 0.5fg | 12.2 ± 0.36i | 16.11C |
| CH | 28.2 ± 0.31a | 23.1 ± 1.22b | 19.8 ± 0.49c | 12.9 ± 0.58hi | 21.33A |
| AV | 28.2 ± 0.41a | 19.8 ± 0.44c | 17.5 ± 0.29d | 13.8 ± 0.46gh | 18.63B |
| CO | 28.2 ± 0.48a | 19.7 ± 0.18c | 16.5 ± 0.24de | 14.3 ± 0.38gh | 19.12B |
| CH+AV | 28.2 ± 0.6a | 22.3 ± 0.38b | 19.4 ± 0.78c | 15.8 ± 0.43ef | 21.40A |
| CO+AV | 28.2 ± 0.83a | 17.5 ± 0.29d | 13.6 ± 0.33gh | 11.6 ± 0.3i | 16.72C |
| Mean (storage periods) | 28.2A | 19.84B | 16.91C | 13.41D | |
| TSS (%) | |||||
| Control | 6.1 ± 0.09m | 13.4 ± 0.1g | 15.2 ± 0.15d | 22.5 ± 0.29a | 14.29A |
| CH | 6.1 ± 0.07m | 12.9 ± 0.19h | 14.3 ± 0.15f | 17.7 ± 0.44c | 12.68C |
| AV | 6.1 ± 0.09m | 9.0 ± 0.09k | 10.5 ± 0.29j | 12.0 ± 0.09i | 9.33D |
| CO | 6.1 ± 0.06m | 15.0 ± 0.12e | 15.0 ± 0.06e | 18.7 ± 0.15b | 13.66B |
| CH+AV | 6.1 ± 0.06m | 8.4 ± 0.23l | 10.5 ± 0.29j | 11.7 ± 0.27i | 9.20D |
| CO+AV | 6.1 ± 0.09m | 13.4 ± 0.09g | 15.9 ± 0.19h | 22.4 ± 0.1a | 14.44A |
| Mean (storage time) | 6.1D | 12.01C | 13.73B | 17.32A | |
| TA (%) | |||||
| Control | 0.15 ± 0.01a | 0.14 ± 0a | 0.13 ± 0.01b | 0.10 ± 0de | 0.13B |
| CH | 0.15 ± 0.01a | 0.13 ± 0bc | 0.12 ± 0bc | 0.11 ± 0de | 0.13B |
| AV | 0.15 ± 0.01a | 0.13 ± 0.01b | 0.11 ± 0cd | 0.09 ± 0fg | 0.12C |
| CO | 0.15 ± 0.01a | 0.11 ± 0de | 0.09 ± 0ef | 0.07 ± 0g | 0.11D |
| CH+AV | 0.15 ± 0.01a | 0.15 ± 0a | 0.14 ± 0.01b | 0.12 ± 0de | 0.14A |
| CO+AV | 0.15 ± 0.01a | 0.10 ± 0de | 0.11 ± 0.01de | 0.10 ± 0ef | 0.11D |
| Mean (storage time) | 0.15A | 0.13B | 0.12C | 0.10D | |
| pH | |||||
| Control | 3.4 ± 0.02m | 3.8 ± 0.01l | 6.0 ± 0.06b | 6.5 ± 0.03a | 4.92A |
| CH | 3.4 ± 0.02m | 4.1 ± 0.02j | 5.4 ± 0.03de | 6.4 ± 0.06a | 4.82B |
| AV | 3.4 ± 0.02m | 5.0 ± 0.01h | 5.1 ± 0.03g | 5.7 ± 0.06c | 4.82B |
| CO | 3.4 ± 0.01m | 3.8 ± 0.02l | 4.9 ± 0.06h | 5.2 ± 0.06fg | 4.33D |
| CH+AV | 3.4 ± 0.02m | 4.0 ± 0.01k | 5.3 ± 0.03ef | 5.4 ± 0.03d | 4.52C |
| CO+AV | 3.4 ± 0.01m | 3.8 ± 0.03l | 4.6 ± 0.06i | 5.4 ± 0.06d | 4.31D |
| Mean (storage time) | 3.4D | 4.07C | 5.21B | 5.77A | |
[i] Mean followed by the same letter (s) is not significantly different within the columns or rows according to an LSD test (P < 0.05); n = 3 replicates, ± SE, control – distilled water, CH – 1.5% chitosan solution, AV – Aloe vera gel, CO – coconut oil, CH + AV – 1.5% chitosan solution + A. vera gel, CO + AV – coconut oil + A. vera gel
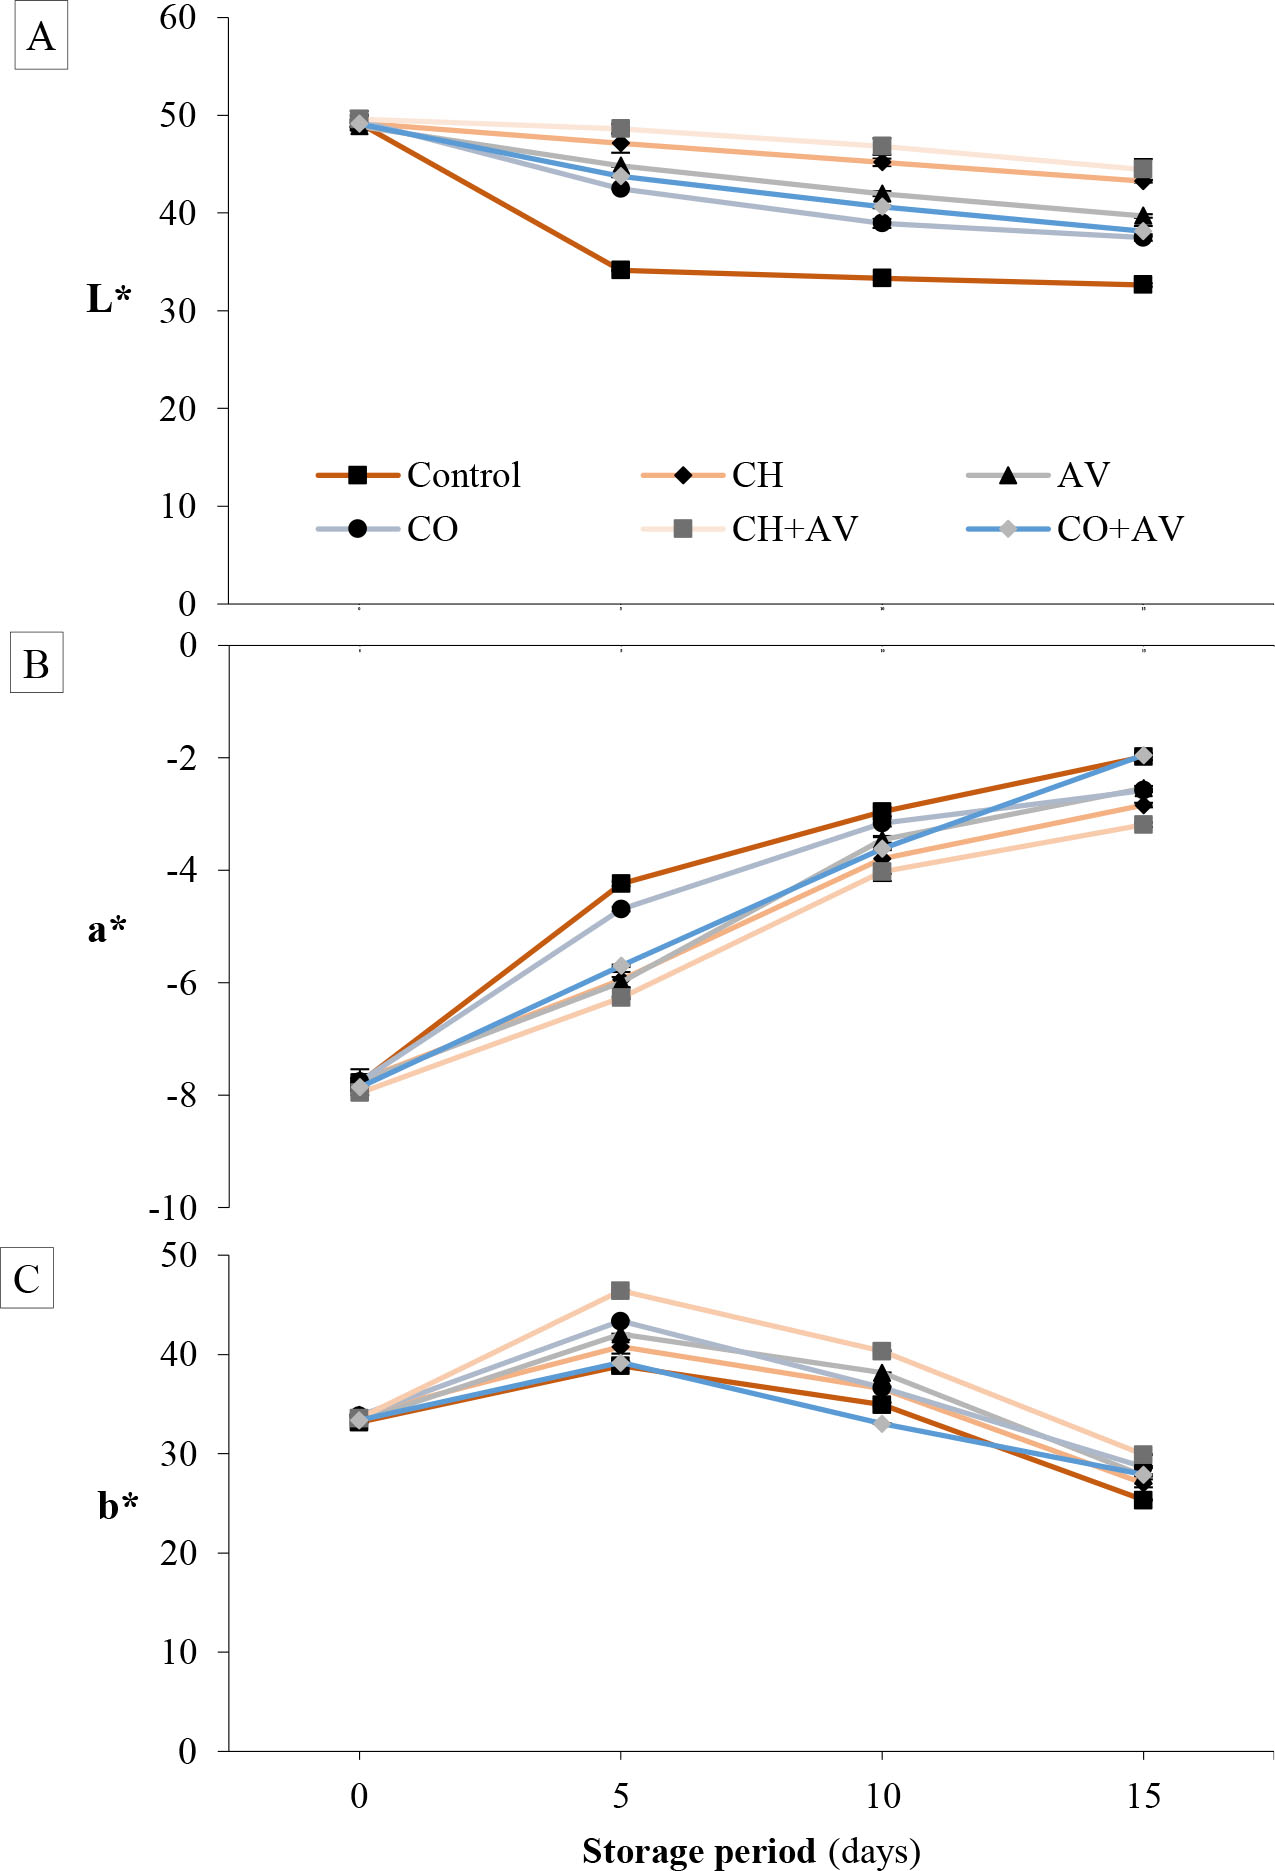
Figure 2.
Effect of storage time and fruit coatings on color parameters (L*, a* and b*) of ‘Haribhanga’ mangoes during 15 days of storage at 25 ± 2 °C and 80–85% relative humidity
Note: see Figure 1
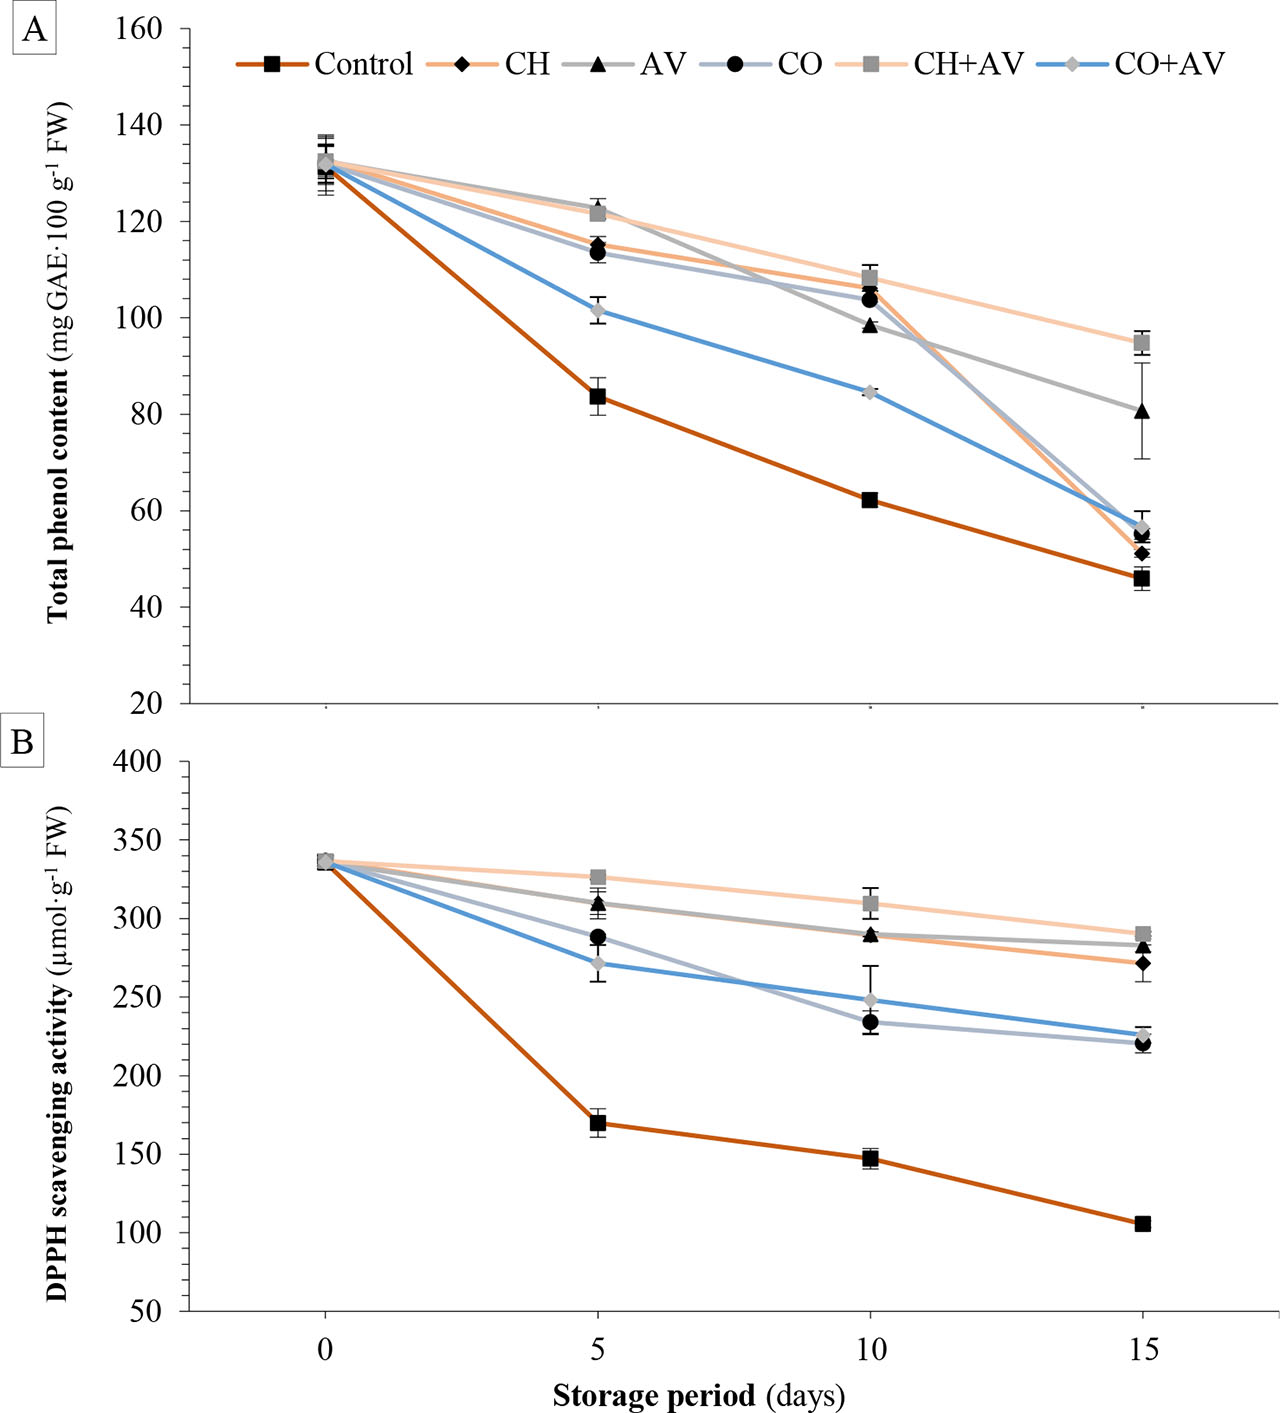
Figure 3.
Effect of storage time and fruit coatings on the content of phenols (A) and antioxidants (B) in ‘Haribhanga’ mangoes during 15 days of storage at 25 ± 2 °C and 80–85% relative humidity
Note: see Figure 1
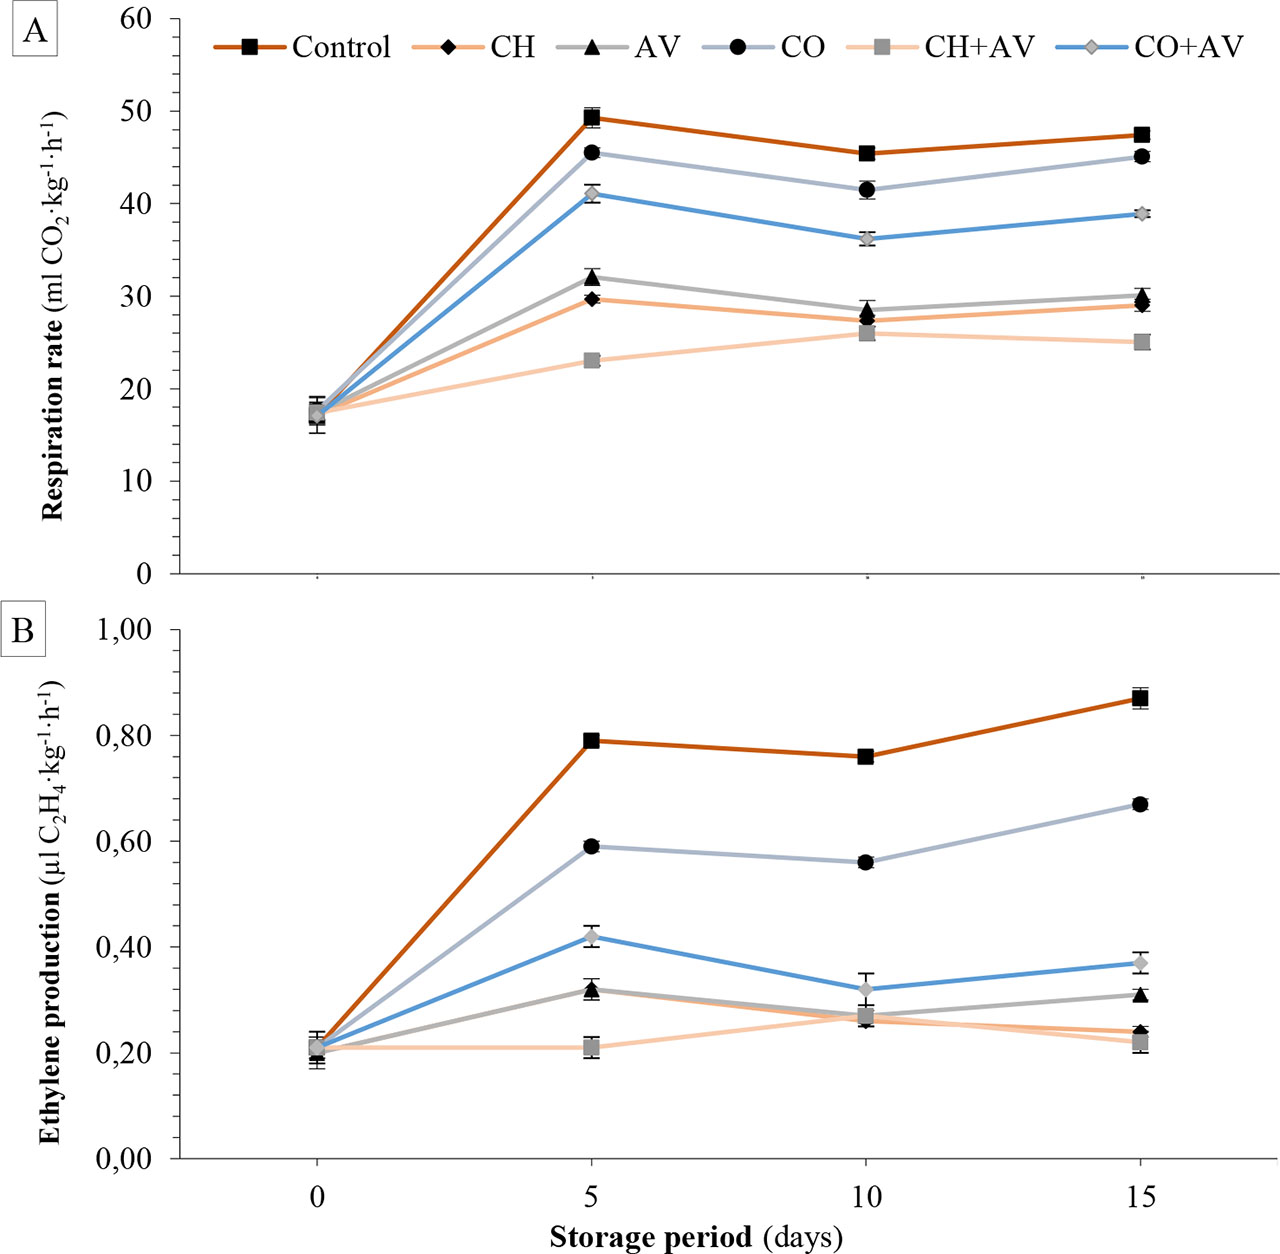
Figure 4.
Effect of storage time and fruit coatings on respiration rate (A) and ethylene production (B) of ‘Haribhanga’ mangoes during 15 days of storage at 25 ± 2 °C and 80–85% relative humidity
Note: see Figure 1
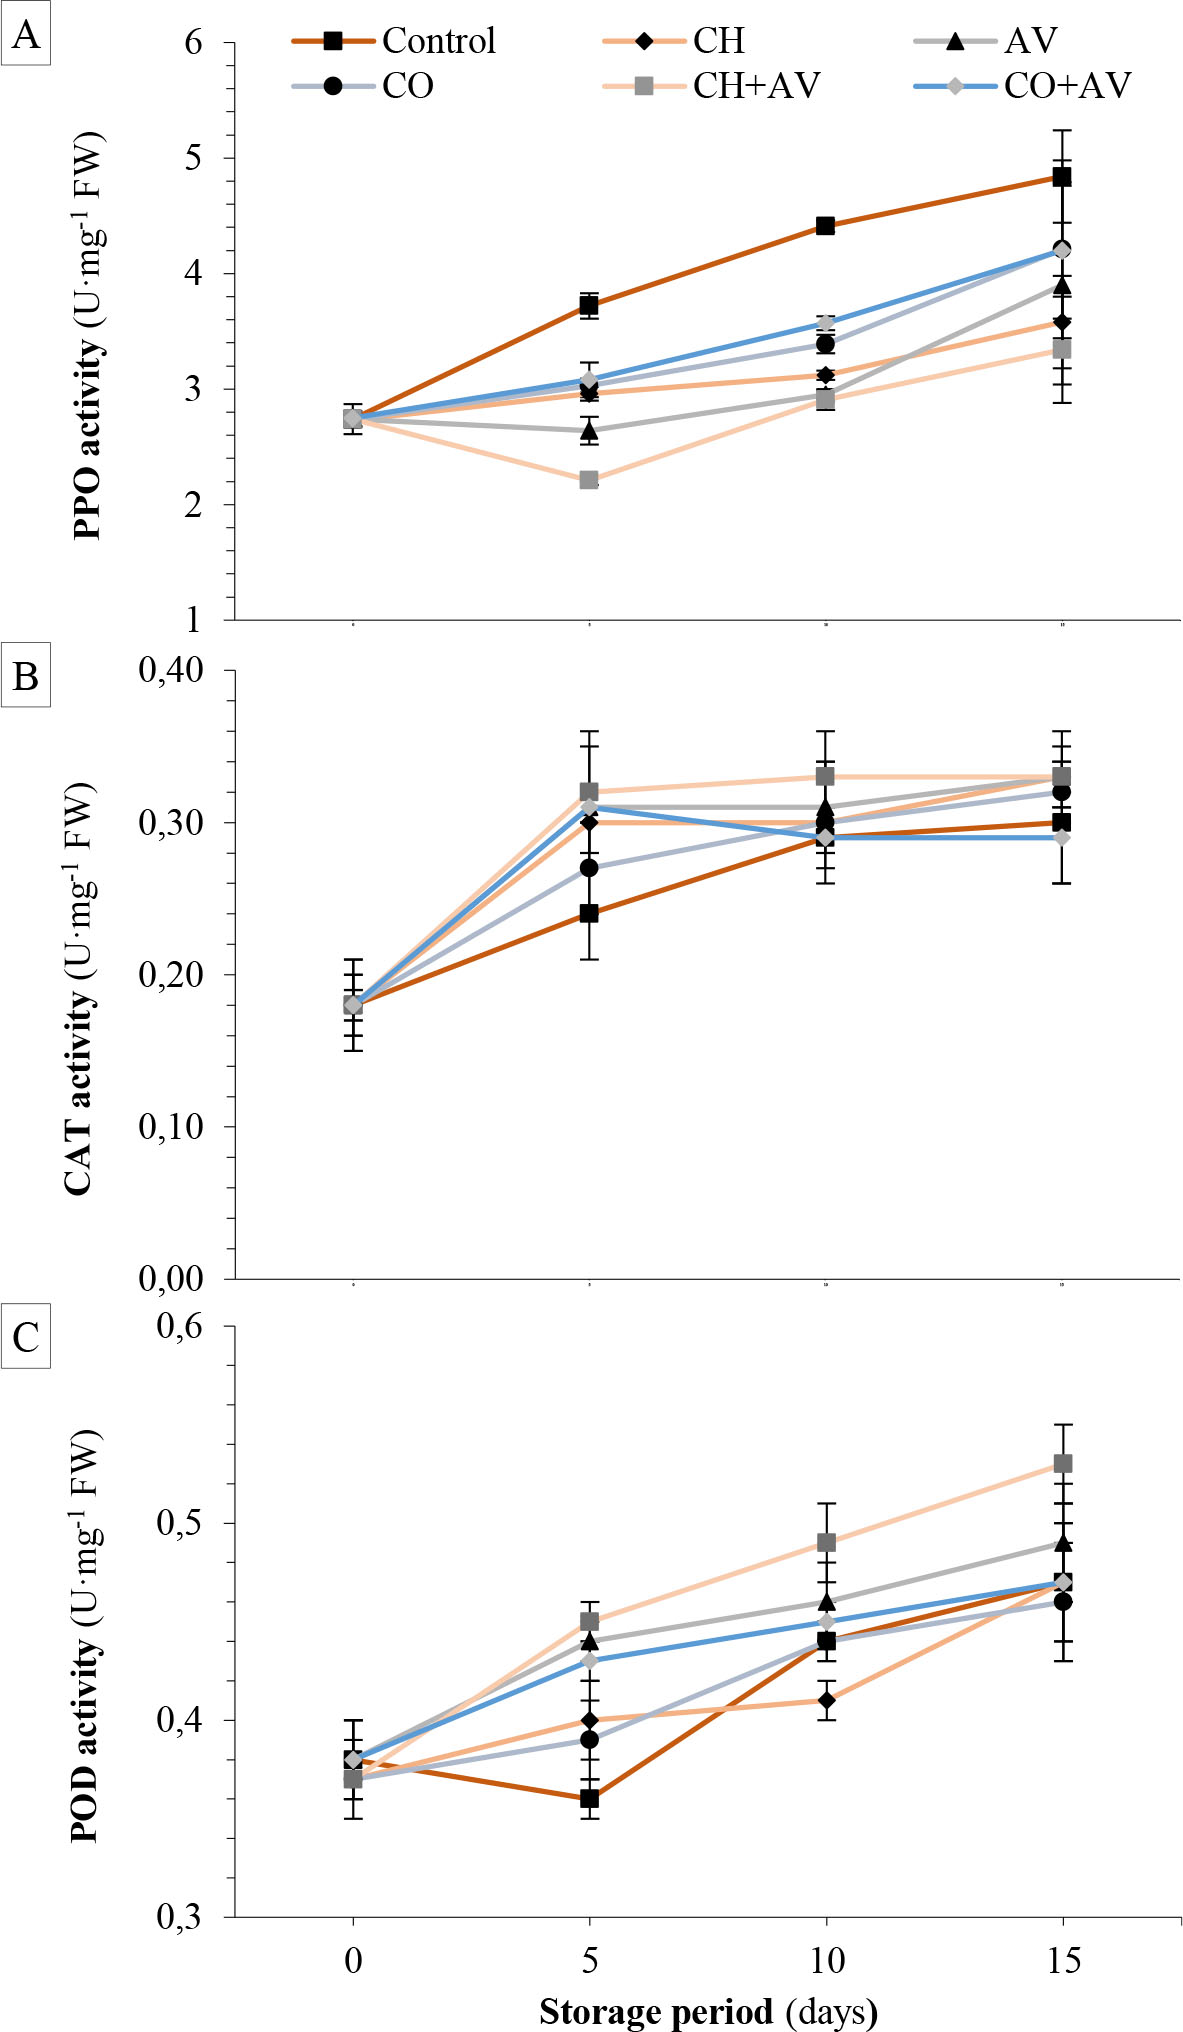
Figure 5.
Effect of storage time and fruit coatings on polyphenol oxidase (PPO) (A), catalase (CAT) (B), and peroxidase (POD) (C) activity of ‘Haribhanga’ mangoes during 15 days of storage at 25 ± 2 °C and 80–85% relative humidity
Note: see Figure 1
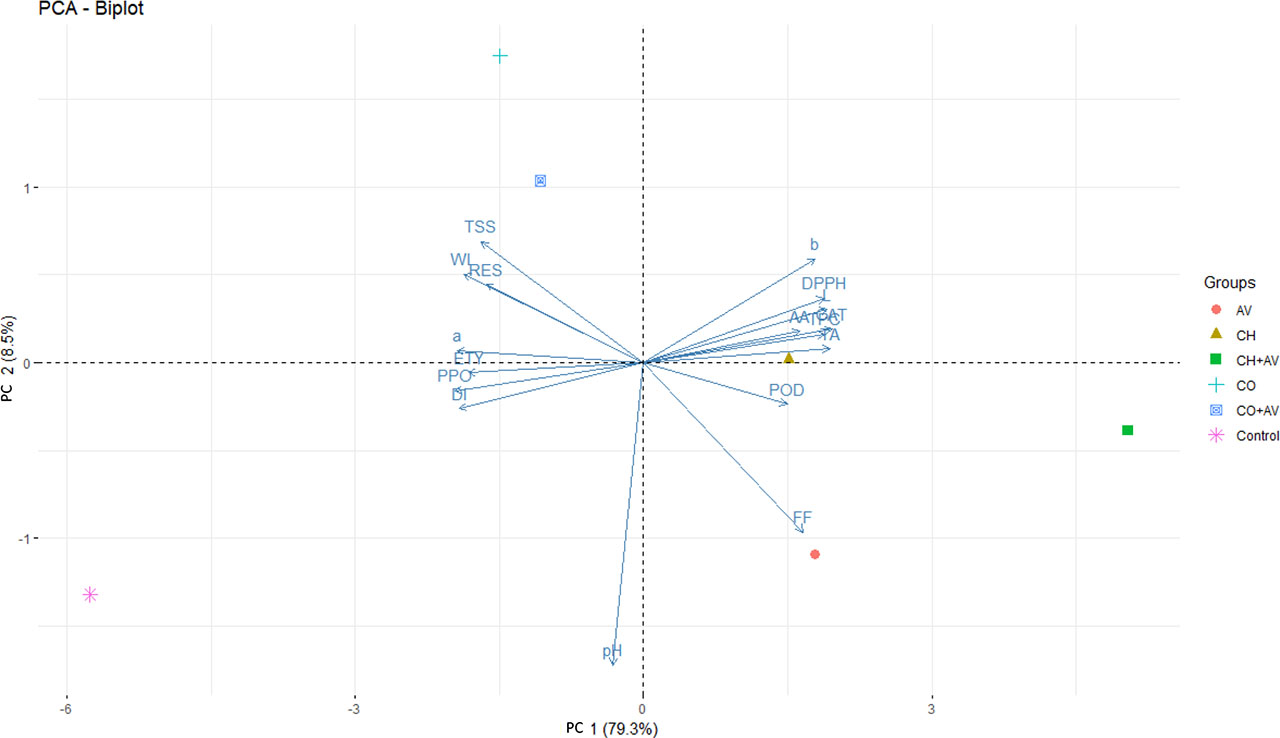
Figure 6.
Principal component loading plot of physiochemical and antioxidant enzymes activities of ‘Haribhanga’ mangoes during storage
Note: see Figure 1