
Table 1
The influence of 1-MCP treatment after fruit cutting on quality of cut pepper ‘Yecla F1’ after 6 days of storage (means of 2013 and 2014)
| Storage temperature (°C) | Concentration of 1-MCP (μl·dm−3) | Quality of cut pepper | |||
|---|---|---|---|---|---|
| softening | discoloration | rotting | total quality | ||
| 0 | 0.0 | 1.8 ± 0.26 b | 1.0 ± 0.00 | 1.0 ± 0.00 a | 7.0 ± 0.00 b |
| 1.0 | 1.3 ± 0.27 a | 1.0 ± 0.00 | 1.1 ± 0.09 b | 7.3 ± 0.46 ab | |
| 3.0 | 1.3 ± 0.27 a | 1.0 ± 0.00 | 1.0 ± 0.00 a | 7.5 ± 0.53 a | |
| 5.0 | 1.3 ± 0.27 a | 1.0 ± 0.00 | 1.0 ± 0.00 a | 7.5 ± 0.53 a | |
| 5 | 0.0 | 2.4 ± 0.44 e | 1.0 ± 0.00 | 1.0 ± 0.00 | 6.3 ± 0.87 c |
| 1.0 | 2.3 ± 0.27 d | 1.0 ± 0.00 | 1.0 ± 0.00 | 6.5 ± 0.53 c | |
| 3.0 | 2.4 ± 0.50 e | 1.0 ± 0.00 | 1.0 ± 0.00 | 6.3 ± 0.75 c | |
| 5.0 | 2.1 ± 0.69 c | 1.0 ± 0.00 | 1.0 ± 0.00 | 6.6 ± 1.13 c | |
[i] Means in columns signed with the same letter do not differ significantly at p = 0.05, according to Tukey's test. Quality evaluating scales: softening: 1 – lack, 3 – light, 5 – medium (clearly perceptible), 7 – strong (soft stripes), 9 – very strong (completely soft stripes); discoloration: 1 – none, 3 – light, 5 – medium (clearly visible), 7 – strong, 9 – very strong (brown); rotting: 1 – no, 3 – light, 5 – medium (clearly visible), 7 – strong, 9 – very strong (100% rotten; overall quality: 9 – excellent (as after cutting), 7 – good (slight defects, slightly lowering the quality), 5 – sufficient (light and medium defects – lower limit of marketability), 3 – fair (limit of usability), 1 – poor (inedible)
Table 2
The influence of 1-MCP treatment after cutting on the quality of cut pepper ‘Yecla F1’ after 4 days of cold storage and one day at 18–20 °C (means of 2013 and 2014)
| Storage temperature (°C) | Concentration of 1-MCP (μl·dm−3) | Quality of cut pepper | |||
|---|---|---|---|---|---|
| softening | discoloration | rotting | total quality | ||
| 0 | 0.0 | 1.5 ± 0.58 | 1.0 ± 0.00 | 1.1 ± 0.12 | 6.8 ± 0.29 b |
| 1.0 | 1.4 ± 0.58 | 1.0 ± 0.00 | 1.1 ± 0.12 | 7.0 ± 0.00 ab | |
| 3.0 | 1.3 ± 0.28 | 1.0 ± 0.00 | 1.1 ±0.12 | 7.3 ± 0.29 a | |
| 5.0 | 1.3 ± 0.58 | 1.0 ± 0.00 | 1.1± 0.12 | 7.3 ± 0.29 a | |
| 5 | 0.0 | 2.0 ± 1.15 | 1.3 ± 0.58 | 1.5 ± 0.58 | 4.0 ± 1.78 c |
| 1.0 | 2.0 ± 1.15 | 1.5 ± 0.58 | 1.5 ± 0.58 | 3.8 ± 1.44 c | |
| 3.0 | 1.5 ± 0.58 | 1.3 ± 0.28 | 1. 5± 0.58 | 4.0 ± 1.15 c | |
| 5.0 | 2.0 ±1.15 | 1.5 ± 0.58 | 1.5 ± 0.58 | 3.8 ± 1.44 c | |
[i] Means signed with different letters differ significantly at p = 0.05. Quality evaluating scales: such as under Table 1
Table 3
The quality of fresh-cut pepper ‘Roberta F1’ during the cold storage
| Storage temperature (°C) | Storage time (days) | |||
|---|---|---|---|---|
| 6 | 8 | |||
| softening | total quality | softening | total quality | |
| 2015 | ||||
| 0 | 1.0 ± 0.00 | 8.5 ± 0.00 | 1.1 ± 0.00 | 8.0 ± 0.00 |
| 5 | 1.1 ± 0.00 | 8.0 ± 0.00 | 1.3 ± 0.00 | 7.5 ± 0.00 |
| 2016 | ||||
| 0 | 2.5 ± 0.00 | 6.0 ± 0.00 | 4.5 ± 0.00 | 4.5 ± 0.00 |
| 5 | 2.5 ± 0.00 | 6.0 ± 0.00 | 4.5 ± 0.00 | 4.5 ± 0.00 |
[i] Data for all experimental objects within the same temperature and the same year are the same. Quality assessment scales: such as under Table 1
Table 4
The quality of fresh-cut pepper ‘Roberta F1’ after 4 days of cold storage and one day at shelf life at 18–20 °C (means of 2015–2016)
| Storage temperature (°C) | Quality of cut pepper | |||
|---|---|---|---|---|
| softening | discoloration | rotting | total quality | |
| 2015 | ||||
| 0 | 1.1 ± 0.00 | 1.0 ± 0.00 | 1.0 ± 0.00 | 8.0 ± 0.00 |
| 5 | 1.5 ± 0.00 | 1.0 ± 0.00 | 1.0 ± 0.00 | 7.5 ± 0.00 |
| 2016 | ||||
| 0 | 2.5 ± 0.00 | 1.0 ± 0.00 | 1.0 ± 0.00 | 6.5 ± 0.00 |
| 5 | 2.5 ± 0.00 | 1.0 ± 0.00 | 1.0 ± 0.00 | 6.5 ± 0.00 |
[i] Data for all experimental objects within the same temperature and the same year are the same. Quality assessment scales: such as under Table 1
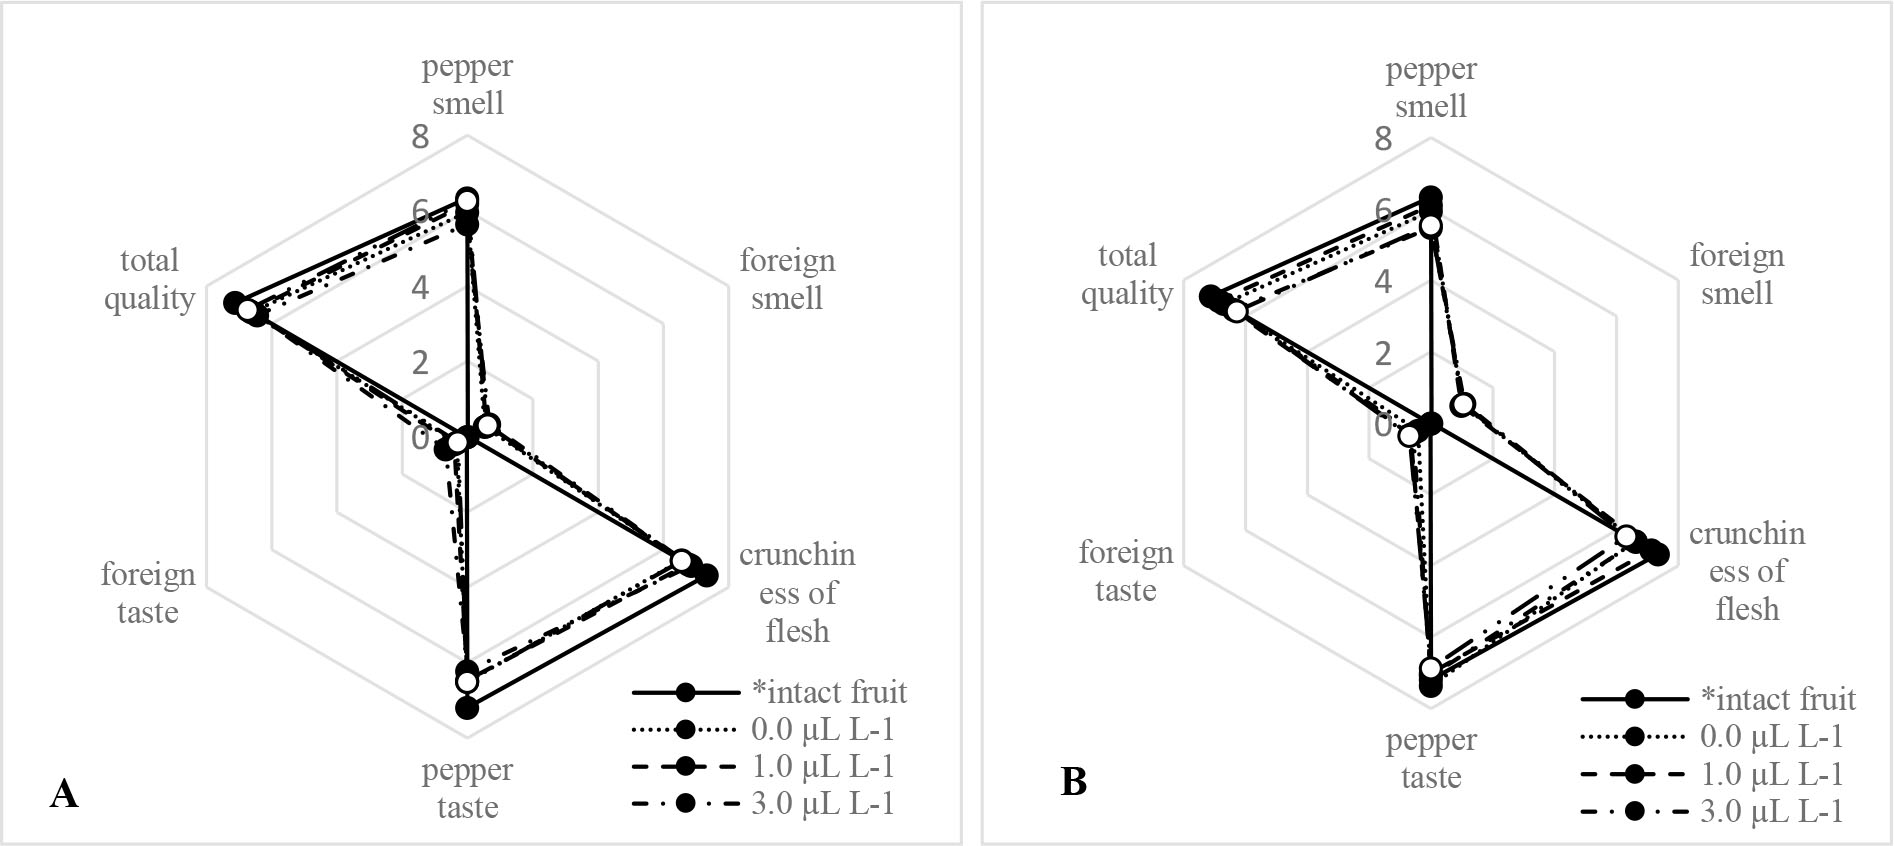
Fig. 1
* not treated with 1-MCP and stored at 8 °C as intact fruit
evaluation scale: 0 – minimally value, 10 – maximally value
Sensory quality of fresh cut pepper ‘Yecla F1’ treated by 1-MCP before cutting (A – after 4 days at 0°C, B – after 4 days at 5°C, means from 2013 and 2014)
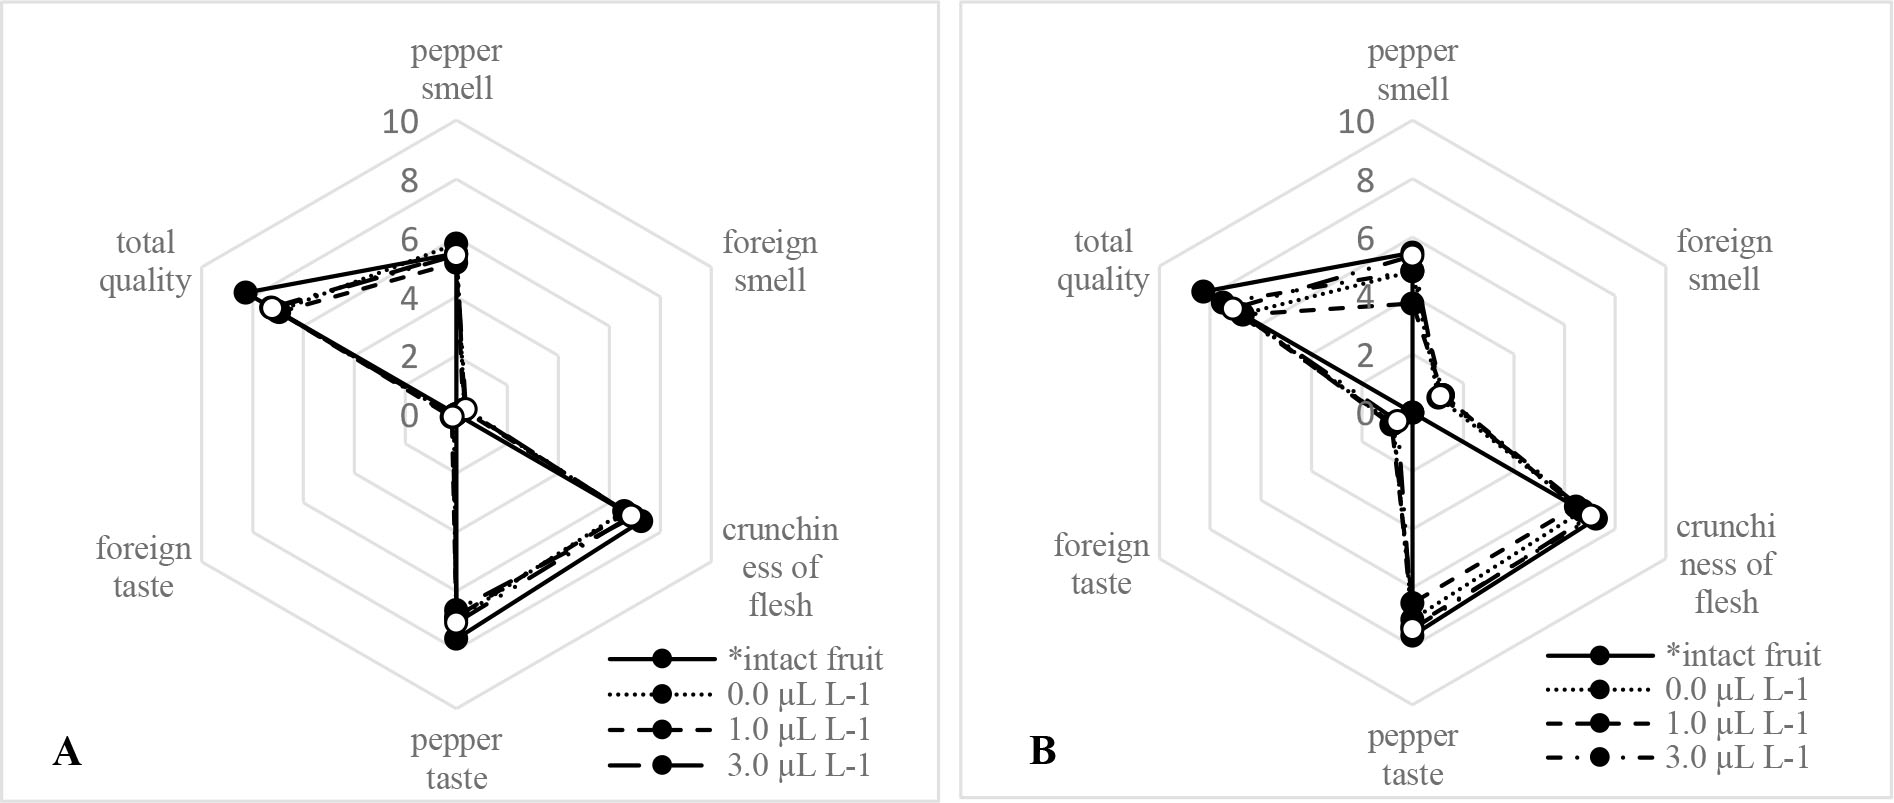
Fig. 2
Note: See Fig. 1
Sensory quality of fresh cut pepper ‘Roberta F1’ treated by 1-MCP immediately after cutting (A – after 4 days at 0 °C, B – after 4 days at 5 °C, means from 2013 and 2014)
Table 5
The ethylene concentration (μl·dm−3) in packs with sliced pepper treated with 1-MCP (4 days of storage)
| Storage temperature (°C) | 1-MCP concentration (μl·dm−3) | |||
|---|---|---|---|---|
| 0.0 μl·dm−3 | 1.0 μl·dm−3 | 3.0 μl·dm−3 | 5,0 μl·dm−3 | |
| Means from 2013 and 2014 – ‘Yecla F1’ treated after cutting | ||||
| 0 | 0.85 ±0.37 ab | 2.60 ± 1.88 d | 2.57 ± 1.33 d | 2.90 ± 1.78 d |
| 5 | 0.40 ± 0.24 a | 1.18 ± 0.88 bc | 1.85 ±0.73 c | 1.65 ± 0.88 c |
| Means from 2015 and 2016 – ‘Roberta F1’ treated before cutting | ||||
| 0 | 0.55 ± 0.1 2 ab | 1.32 ± 0.48 c | 0.67 ± 0.30 ab | 0.47 ± 0.16 ab |
| 5 | 0.26 ± 0.15 a | 0.68 ± 0.29 ab | 0.56 ± 0.19 ab | 0.71 ± 0.41 b |
[i] The mean for each cultivar signed with the same letter do not differ significantly at p = 0.05 according to Tukey's test
Table 6
The carbon dioxide concentration (%) in packs with sliced pepper ‘Roberta F1’ treated with 1-MCP after cutting, after 4 days of storage (means of 2015–2016)
| Storage temperature (°C) | 1-MCP concentration (μl·dm−3) | |||
|---|---|---|---|---|
| 0.0 μl·dm−3 | 1.0 μl·dm−3 | 3.0 μl·dm−3 | 5.0 μl·dm−3 | |
| 0 | 1.99 ± 0.19 ab | 1.98 ± 0.09 ab | 1.84 ± 0.21 ab | 1.68 ± 0.41 a |
| 5 | 2.03 ± 0.76 ab | 2.19 ± 0.09 ab | 2.37 ± 0.21 b | 2.91 ± 0.31 c |
[i] The mean signed with the same letter do not differ significantly at p = 0.05 according to Tukey's test