
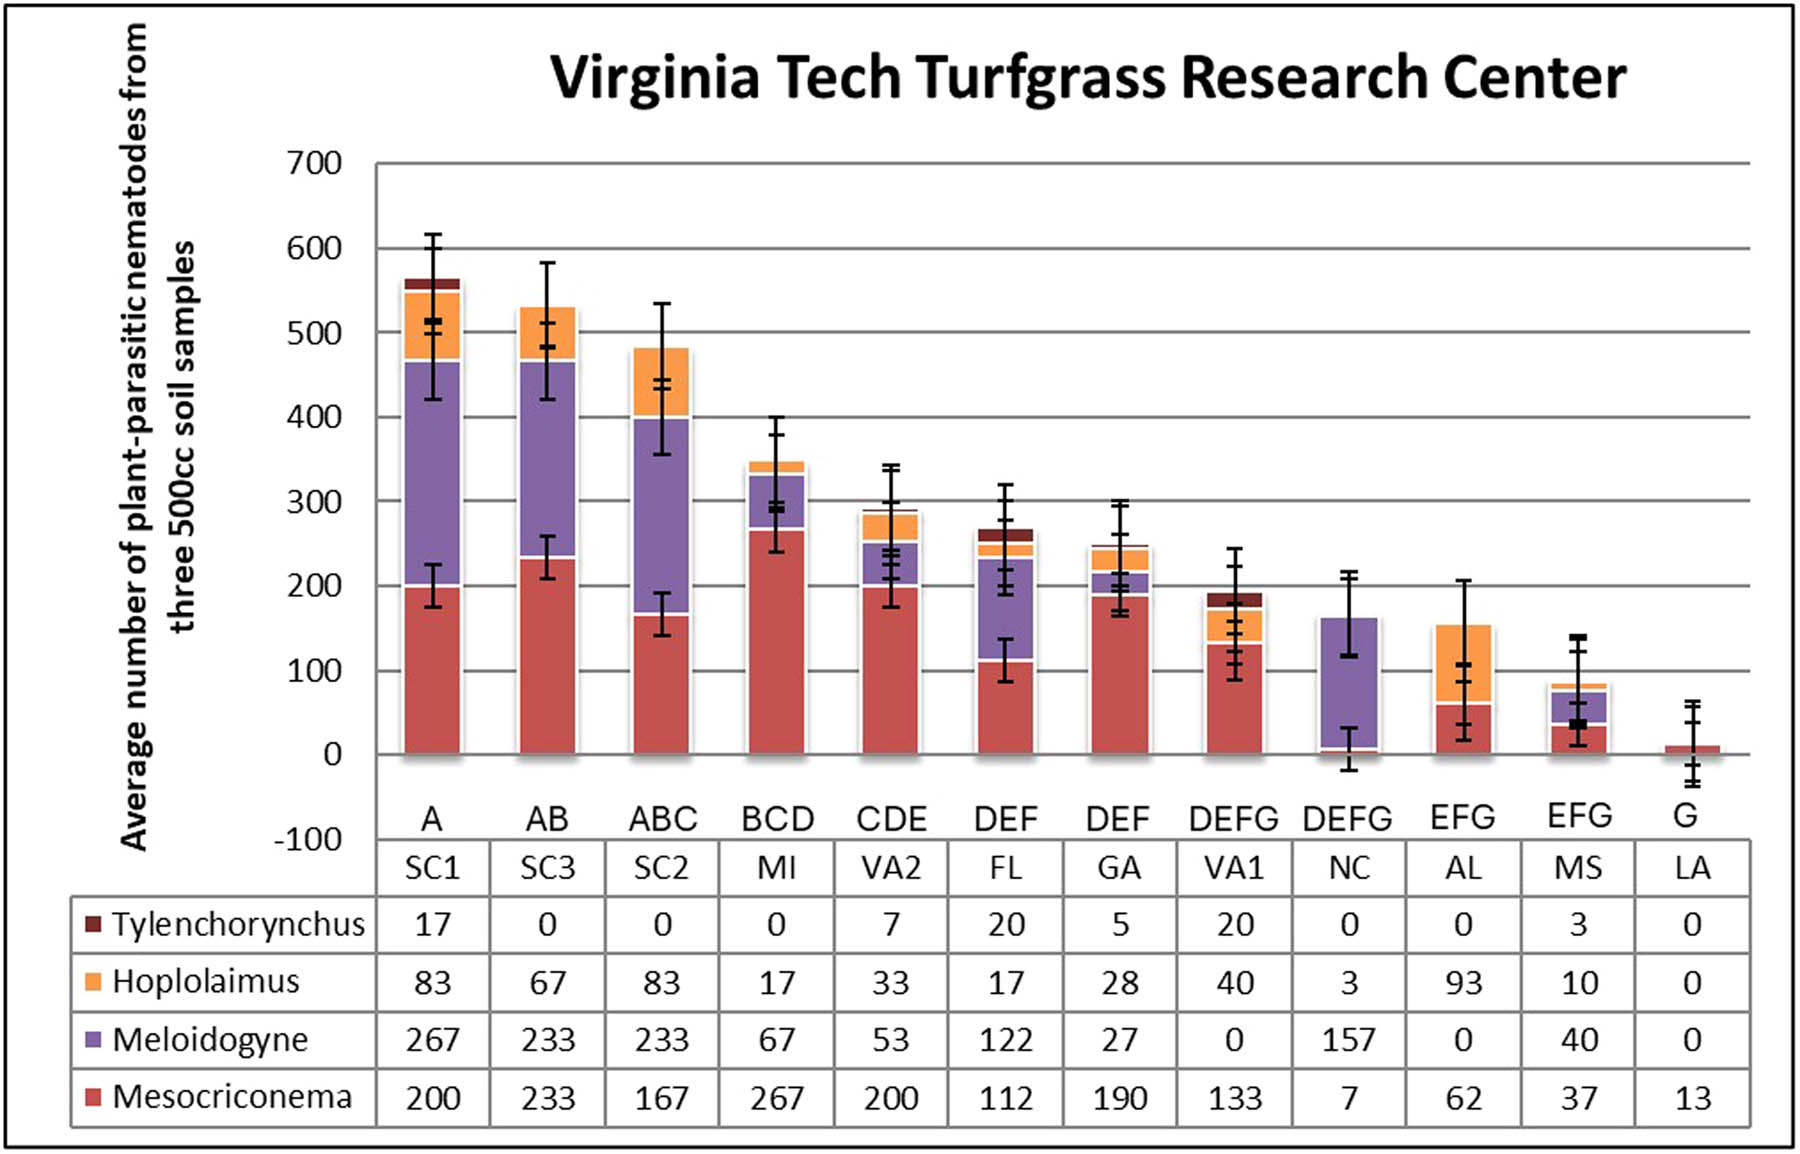
Figure 1
Comparison of nematode extraction efficiencies among 10 state nematode assay labs for the four most common genera of plant-parasitic nematodes at the Virginia Tech Turfgrass Research Center, Blacksburg, VA. Total means in each column followed by the same letters are not significantly different according to Tukey’s Honestly significant difference (P < 0.05).
Table 1
Comparisons of nematode assay lab recommendations for three locations
| State | Sampling site | Nematode | Technique | Soil | Rec.* |
|---|---|---|---|---|---|
| Alabama | TRC | Root-knot | Hand sieve | 100 cm3 | B, B, B |
| Florida | TRC | Hand sieve | 100 cm3 | A, A, A | |
| Georgia | TRC | Hand sieve | 100 cm3 | A, A, A | |
| Louisiana | TRC | Elutriator | 500 cm3 | A, A, A | |
| Michigan | TRC | Hand sieve | 100 cm3 | A, A, A | |
| Mississippi | VTRC | Hand sieve | 100 cm3 | A, A, A | |
| North Carolina | VTRC | Root-knot | Elutriator | 500 cm3 | B, B, B |
| South Carolina 1 | VTRC | Hand sieve | 100 cm3 | A, A, A | |
| South Carolina 2 | VTRC | Hand sieve | 100 cm3 | A, A, A | |
| South Carolina 3 | VTRC | Hand sieve | 100 cm3 | A, A, A | |
| Virginia 1 | VTRC | Elutriator | 500 cm3 | A, A, A | |
| Virginia 2 | VTRC | Elutriator | 500 cm3 | A, A, A | |
| Alabama | AGC | Hand sieve | 100 cm3 | A, A, A | |
| Florida | AGC | Hand sieve | 100 cm3 | A, A, A | |
| Georgia | AGC | Hand sieve | 100 cm3 | A, A, A | |
| Louisiana | AGC | Elutriator | 500 cm3 | A, A, A | |
| Michigan | AGC | Hand sieve | 100 cm3 | A, A, A | |
| Mississippi | AGC | Hand sieve | 100 cm3 | A, A, A | |
| North Carolina | AGC | Elutriator | 500 cm3 | A, A, A | |
| South Carolina 1 | AGC | Hand sieve | 100 cm3 | A, A, A | |
| South Carolina 2 | AGC | Hand sieve | 100 cm3 | A, A, A | |
| South Carolina 3 | AGC | Hand sieve | 100 cm3 | A, A, A | |
| Virginia 1 | AGC | Elutriator | 500 cm3 | A, A, A | |
| Virginia 2 | AGC | Elutriator | 500 cm3 | A, A, A | |
| Alabama | PCCGC | Ring | Hand sieve | 100 cm3 | C, C, C |
| Florida | PCCGC | Hand sieve | 100 cm3 | A, A, A | |
| Georgia | PCCGC | Hand sieve | 100 cm3 | A, A, A | |
| Louisiana | PCCGC | Elutriator | 500 cm3 | A, A, A | |
| Massachusetts | PCCGC | Ring, Stunt | Hand sieve | 100 cm3 | B, C, C |
| Michigan | PCCGC | Ring, Stunt | Hand sieve | 100 cm3 | B, B, C |
| Mississippi | PCCGC | Hand sieve | 100 cm3 | A, A, A | |
| North Carolina | PCCGC | Elutriator | 500 cm3 | A, A, A | |
| South Carolina 1 | PCCGC | Ring | Hand sieve | 100 cm3 | B, C, C |
| South Carolina 2 | PCCGC | Ring | Hand sieve | 100 cm3 | C, C, C |
| South Carolina 3 | PCCGC | Ring | Hand sieve | 100 cm3 | C, C, C |
| Virginia 1 | PCCGC | Ring | Elutriator | 500 cm3 | B, C, C |
| Virginia 2 | PCCGC | Ring | Elutriator | 500 cm3 | B, C, C |
This table presents the recommendations of 10 nematode assay labs for three turfgrass locations: Virginia Tech Turfgrass Research Center (TRC), Blacksburg, VA.; Augustine Golf Course (AGC), Stafford, VA.; and Philadelphia Country Club Golf Course (PCCGC), Gladwyne, PA. A = nematodes are not likely to cause a problem, B = nematodes may cause a problem, and C = nematodes are likely to cause a problem. Cells that are shaded indicate a B or C recommendation. *Rec. = recommendation.
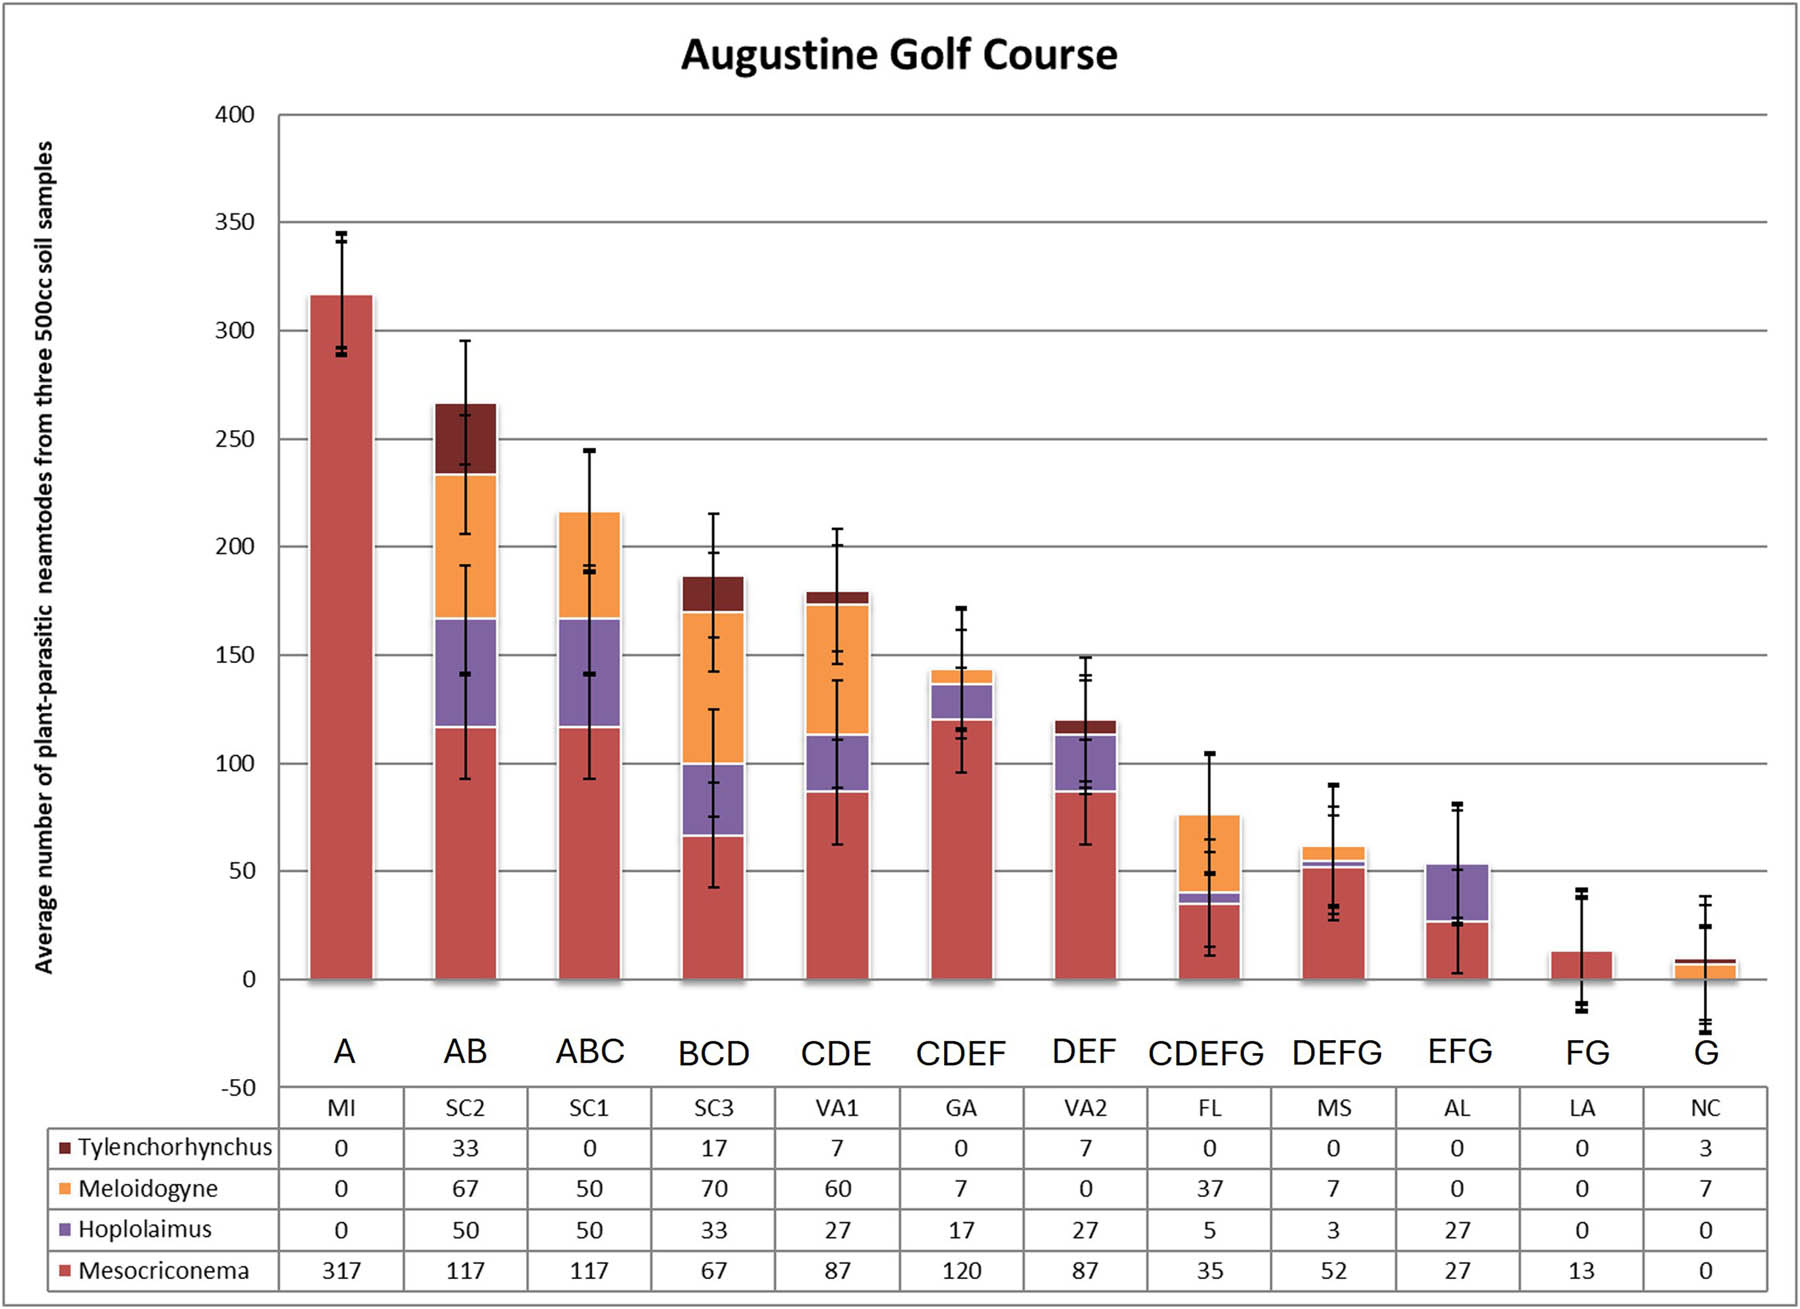
Figure 2
Comparison of nematode extraction efficiencies among 10 state nematode assay labs for the four most common genera of plant-parasitic nematodes from the Augustine Golf Course, Stafford, VA. Total means in each column followed by the same letters are not significantly different according to Tukey’s Honestly significant difference (P < 0.05).
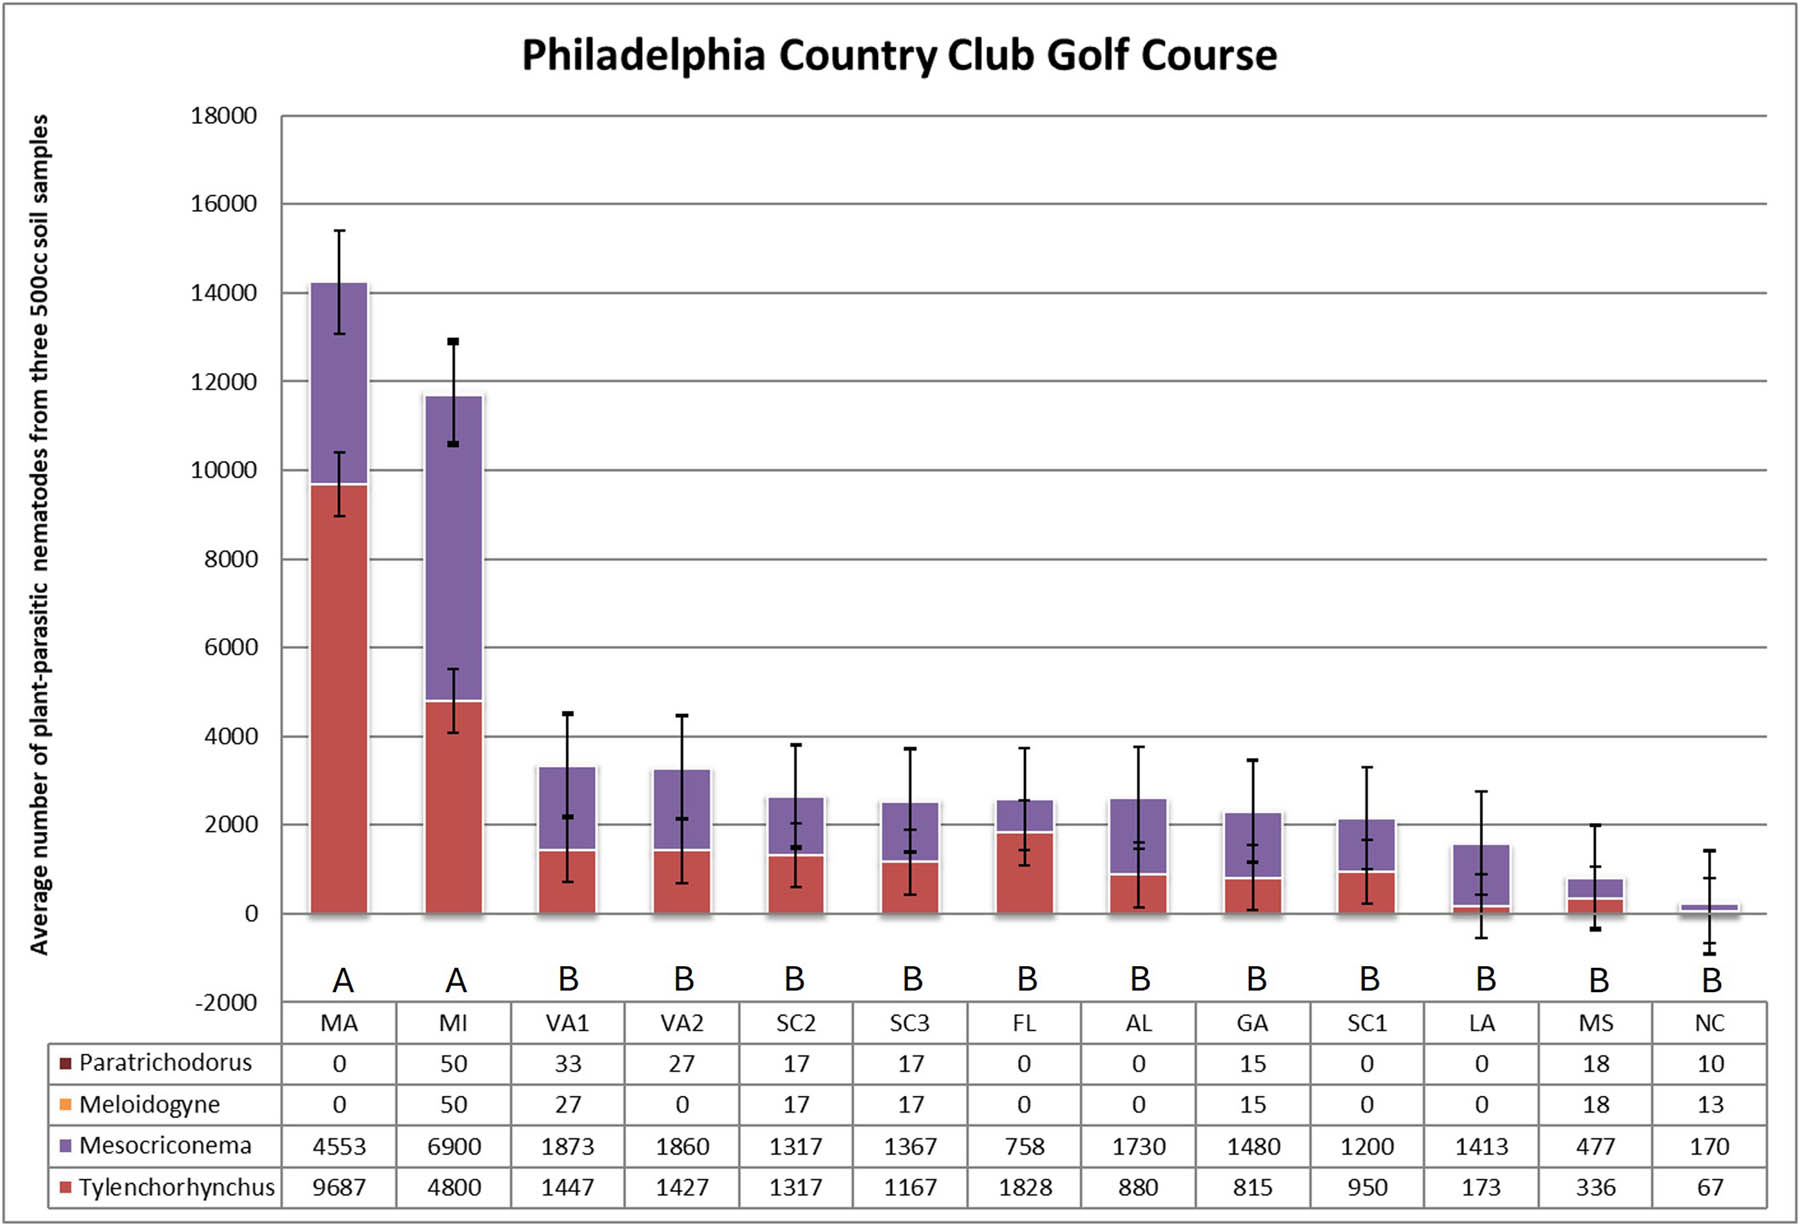
Figure 3
Comparison of nematode extraction efficiencies among 10 state nematode assay labs of the four most common genera of plant-parasitic nematodes at the Philadelphia Country Club Golf Course, Gladwyne, PA. Total means in each column followed by the same letters are not significantly different based on Tukey’s Honestly significant difference (P < 0.05).
Table 2
Comparison of nematode extraction efficiencies among six genera of plant-parasitic nematode by state and by extraction method
| Comparison by state | Comparison by semi-automatic elutriation | Comparison by hand-sieving | ||||
|---|---|---|---|---|---|---|
| P value | F ratio | P value | F ratio | P value | F ratio | |
| Hoplolaimus spp. | 0.0001* | 4.2557* | 0.0021* | 7.5056* | 0.0027* | 3.8647* |
| Mesocriconema spp. | 0.0385* | 2.0908* | 0.1487 | 2.0200 | 0.1030 | 1.8655 |
| Tylenchorhynchus spp. | 0.0051* | 2.8722* | 0.1001 | 2.4703 | 0.0344* | 2.4698* |
| Meloidogyne spp. | 0.0329* | 2.1530* | 0.0639 | 2.9928 | 0.0802 | 2.0054 |
| Helicotylenchus spp. | 0.443 | 1.0023 | 0.3678 | 1.0313 | 0.0066* | 3.3684* |
| Paratrichodorus spp. | 0.0191* | 2.3648* | 0.5025 | 0.7027 | 0.0462* | 2.3093* |
*Statistical significance (α = 0.05). P-values and F ratios were determined using analysis of variance in JMP® Pro 18 (SAS Institute, Cary, NC) and Tukey’s Honestly significant difference post hoc test were used to compare means.