
Table 1
Nematicide treatments evaluated in each aldicarb and fluazaindolizine experiment in Meloidogyne incognita-infested fields
| Experiment | Treatmentsa | Application type | Rate | Years evaluated |
|---|---|---|---|---|
| Aldicarb | Abamectin | Seed | 0.15 mg ai/seed | 2017, 2019, 2022 |
| Aldicarb | In-furrow | 841 g ai/ha | 2017, 2019, 2022 | |
| Bacillus firmus | Seed | 0.13 mg ai/seed | 2017, 2019, 2022 | |
| Fluopyram | Seed | 0.15 mg ai/seed | 2017, 2019, 2022 | |
| Abamectin + Aldicarb | Seed + In-furrow | – b | 2017, 2019, 2022 | |
| Aldicarb + B. firmus | In-furrow + Seed | — | 2019, 2022 | |
| Aldicarb + Fluopyram | In-furrow + Seed | — | 2017, 2019, 2022 | |
| Fluopyram + B. firmus | Seed + Seed | — | 2017, 2019, 2022 | |
| Fluazaindolizine | Abamectin | Seed | 0.15 mg ai/seed | 2019, 2020, 2022 |
| Fluazaindolizine | In-furrow | 281 g ai/ha | 2019, 2020, 2022 | |
| Fluopyram | Seed | 0.25 mg ai/seed | 2019, 2020, 2022 | |
| Oxamyl | In-furrow | 298 g ai/ha | 2019, 2020 |
Table 2
Experimental characteristics of each aldicarb and fluazaindolizine experimental year in Meloidogyne incognita-infested fields
| Experiment | Year | Planting date | Harvest date | Total rainfall (14 DAP)a | Nematode density at harvest b |
|---|---|---|---|---|---|
| Aldicarb | 2017 | 9 May | 2 Oct | 11.79 | 1,628 |
| 2019 | 28 May | 4 Nov | 6.48 | 914 | |
| 2022 | 14 Jun | 17 Oct | 0.05 | 125 | |
| Fluazaindolizine | 2019 | 28 May | 4 Nov | 6.48 | 1,019 |
| 2020 | 2 Jun | 21 Oct | 6.35 | 336 | |
| 2022 | 14 Jun | 17 Oct | 0.05 | 38 |
Table 3
Effect of cultivar and treatment on percentage of the root system galled, yield, and percent yield change compared to the control in aldicarb experiments in Meloidogyne incognita-infested fields
| 2017 Experiment | 2019 Experiment | 2022 Experiment | ||||||||
|---|---|---|---|---|---|---|---|---|---|---|
| % gall | Yield (kg/ha) | % yield changea | % gall | Yield (kg/ha) | % yield change | % gall | Yield (kg/ha) | % yield change | ||
| Cultivarb | Susceptible | 8.7 ac | 2,381 b | 5.2 a | 3,329 b | 2.5 a | 2,966 b | |||
| Moderately resistant | 1.5 b | 4,923 a | 106.8 | 1.7 b | 4,008 a | 20.4 | 0.5 b | 3,847 a | 29.7 | |
| Treatmente | NTC | 8.3 a | 3,679 | 5.3 a | 3,450 b | 2.6 a | 3,416 | |||
| Abamectin | 6.1 | 3,168 | −13.9 | 9.1 a | 3,719 ab | 7.8 | 1.2 ab | 3,416 | 0.0 | |
| Aldicarb | 1.9 d | 3,786 | 2.9 | 0.8 bc | 3,719 ab | 7.8 | 1.2 bc | 3,295 | −3.5 | |
| Bacillus firmus | 4.8 b | 3,995 | 8.6 | 6.9 a | 3,410 ab | −1.2 | 1.9 ab | 3,295 | −3.5 | |
| Fluopyram | 5.6 ab | 3,302 | −10.2 | 1.6 bc | 3,611 ab | 4.7 | 0.7 d | 3,430 | 0.4 | |
| Abamectin + Aldicarb | 2.5 c | 4,075 | 10.8 | 1.0 b | 3,430 ab | −0.6 | 1.1 c | 3,416 | 0.0 | |
| Aldicarb + B. firmus | — | — | — | 1.0 b | 3,907 ab | 13.2 | 1.9 ab | 3,389 | −0.8 | |
| Aldicarb + Fluopyram | 3.5 c | 3,450 | −6.2 | 0.4 | 4,049 a | 17.4 | 1.4 ab | 3,383 | −1.0 | |
| Fluopyram + B. firmus | 8.3 a | 3,591 | −2.4 | 4.1 ab | 3,901 ab | 13.1 | 1.0 cd | 3,618 | 5.9 | |
| P-value | Cultivar | <0.01 | <0.01 | — | <0.01 | <0.01 | — | <0.01 | <0.01 | — |
| Nematicide | <0.01 | 0.04 | — | <0.01 | <0.01 | — | <0.01 | 0.41 | — | |
[i] aPercent yield change = [(yield of cultivar or treatment – yield of susceptible cultivar or NTC)/(yield of susceptible cultivar or NTC) × 100].
[ii] bCultivars: susceptible = Delta Grow DG4870 RR (2017) and DG4880 GLY (2019, 2022), moderately resistant = DG4940 GLY (all years).
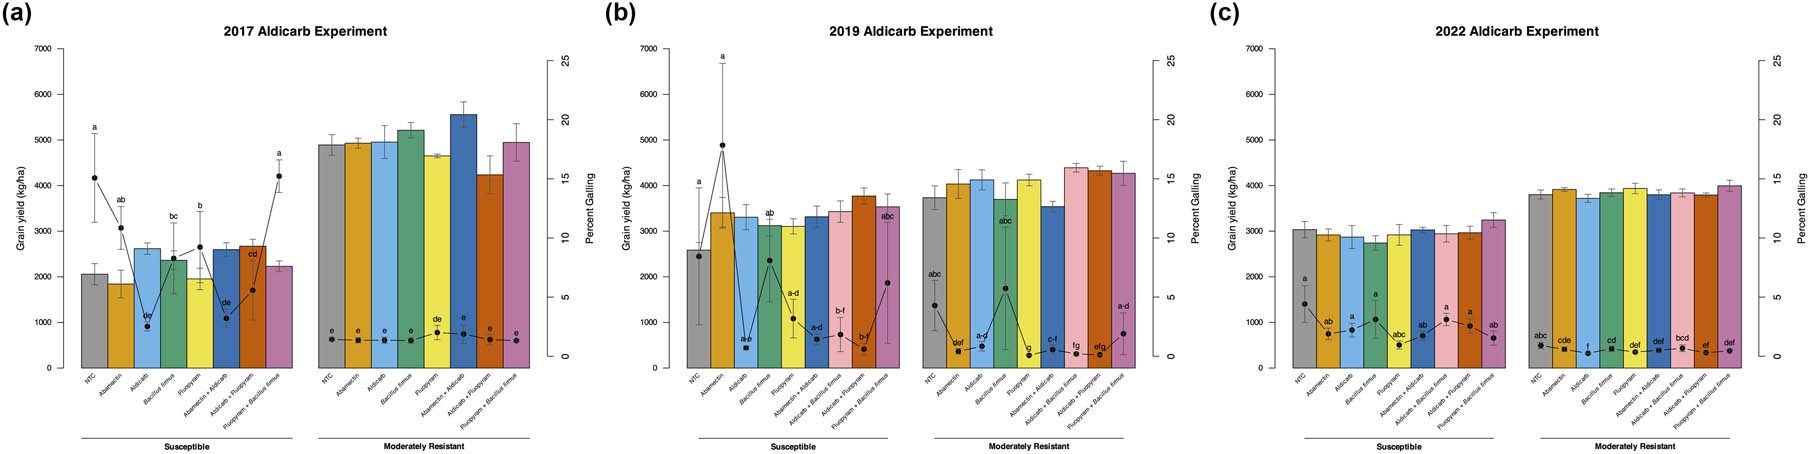
Figure 1
Effect of cultivar and nematicide treatment on root galling by Meloidogyne incognita and grain yield in three field experiments. The cultivar by treatment interaction had a significant (p < 0.01) effect on galling, but not yield, in all 3 years. Bars are grain yield (kg/ha), and the dotted line represents percent root system galled. Different letters on the dotted line indicate a significant difference according to Tukey’s HSD at α = 0.05, and error bars represent standard error. (a) 2017 aldicarb experiment, (b) 2019 aldicarb experiment, and (c) 2022 aldicarb experiment.
Table 4
Effect of treatment on percentage of the root system galled, yield, and percent yield change compared to the control in fluazaindolizine experiments in Meloidogyne incognita-infested fields
| 2019 Experiment | 2020 Experiment | 2022 Experiment | ||||||||
|---|---|---|---|---|---|---|---|---|---|---|
| % Gall | Yield (kg/ha) | % yield changea | % Gall | Yield (kg/ha) | % yield change | % Gall | Yield (kg/ha) | % yield change | ||
| Treatmentb | NTC | 13.1 ab c | 3,396 | 3.3 ab | 2,986 | 1.9 a | 3,060 | |||
| Abamectin | 18.0 a | 3,134 | −7.7 | 4.4 a | 3,147 | 5.4 | 1.3 ab | 2,999 | −2.0 | |
| Fluazaindolizine | 1.0 c | 3,477 | 2.4 | 2.7 ab | 3,295 | 10.3 | 1.3 a | 2,925 | −4.4 | |
| Fluopyram | 5.0 bc | 3,430 | 1.0 | 2.7 ab | 2,993 | 0.2 | 0.6 b | 3,322 | 8.6 | |
| Oxamyl | 5.0 bc | 3,268 | −3.8 | 2.2 b | 3,248 | 8.8 | — | — | — | |
| P-value | Nematicide | <0.01 | 0.67 | — | 0.03 | 0.84 | — | <0.01 | 0.44 | — |