
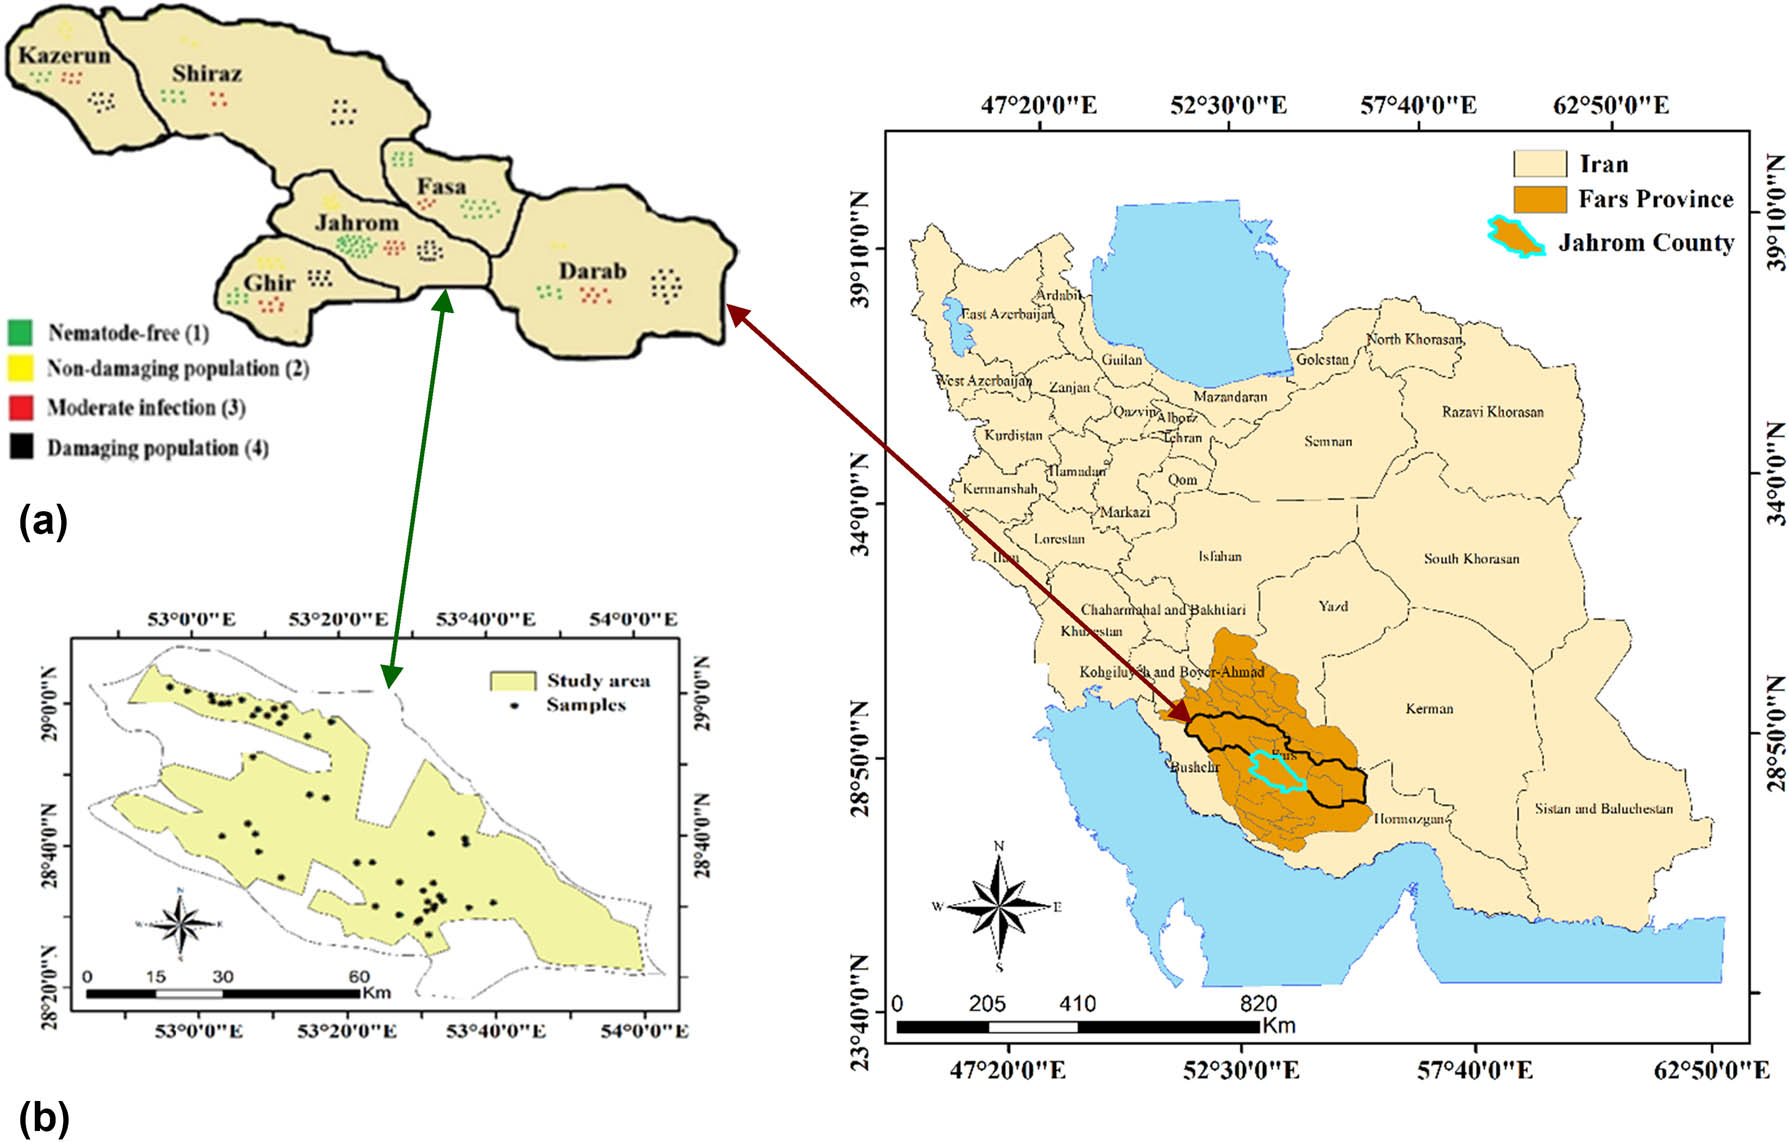
Figure 1
Sampling sites in citrus-growing regions of Fars Province, southern Iran. (a) Provincial survey of 189 orchards across the major citrus-producing areas collectively known as the “citrus belt” (Kazerun, Shiraz, Ghir, Jahrom, Fasa, and Darab). (b) Focused survey in Jahrom County involving 46 orchards. Scores of 1, 2, 3, and 4 correspond to nematode-free (0), nondamaging (<800 males and J2), moderate (800–3,600 males and J2), and damaging (>3,600 males and J2) densities per 100 cm3 soil, respectively.
Table 1
Distribution of Tylenchulus semipenetrans in citrus orchards of Fars Province, Iran, from late summer to early autumn 2018
| Citrus producing regionsa | The number of sampling localities by nematode scoresb | Total samples | |||
|---|---|---|---|---|---|
| Nematode-free (1) | Nondamaging population (2) | Moderate infection (3) | Damaging population (4) | ||
| Jahrom | 28 | 8 | 9 | 14 | 59 |
| Darab | 6 | 2 | 8 | 13 | 29 |
| Ghirokarzin | 7 | 6 | 7 | 9 | 29 |
| Fasa | 9 | 0 | 5 | 13 | 27 |
| Kazerun | 5 | 4 | 6 | 10 | 25 |
| Shiraz | 6 | 2 | 4 | 8 | 20 |
| Total samples | 61 | 22 | 39 | 67 | 189 |
Table 2
Geographic coordinates, Tylenchulus semipenetrans population densities, and nematode damage scores in citrus orchards in Jahrom County, Fars Province, Iran
| Soil Sample codes | GPS location | Nematode countsa | Nematode population scoresb | Soil Sample codes | GPS location | Nematode counts | Nematode population scores | ||
|---|---|---|---|---|---|---|---|---|---|
| Latitude (N) | Longitude (€) | Latitude (N) | Longitude (€) | ||||||
| 1 | 28.669278 | 53.606233 | 10,200 | 4 | 24 | 28.657221 | 53.608646 | 5,805 | 4 |
| 2 | 29.035991 | 52.948343 | 4,370 | 4 | 25 | 28.685277 | 53.059892 | 195 | 2 |
| 3 | 29.026267 | 52.989052 | 8,120 | 4 | 26 | 28.689224 | 53.135475 | 30,908 | 4 |
| 4 | 29.013814 | 53.041493 | 3,335 | 3 | 27 | 28.713066 | 53.118763 | 11,843 | 4 |
| 5 | 29.000878 | 53.044644 | 75 | 2 | 28 | 28.685308 | 53.059835 | 0 | 1 |
| 6 | 28.995715 | 53.064851 | 1,700 | 3 | 29 | 28.646726 | 53.142337 | 0 | 1 |
| 7 | 28.996655 | 53.081414 | 10,125 | 4 | 30 | 28.585194 | 53.191659 | 1,538 | 3 |
| 8 | 29.003597 | 53.110989 | 2,835 | 3 | 31 | 28.514193 | 53.402093 | 1,755 | 3 |
| 9 | 28.967092 | 53.135956 | 730 | 2 | 32 | 28.493349 | 53.454955 | 173 | 2 |
| 10 | 28.980327 | 53.147542 | 0 | 1 | 33 | 28.474944 | 53.494705 | 750 | 2 |
| 11 | 28.986850 | 53.205817 | 555 | 2 | 34 | 28.444957 | 53.519854 | 788 | 2 |
| 12 | 28.916327 | 53.257365 | 2,498 | 3 | 35 | 28.481629 | 53.499258 | 0 | 1 |
| 13 | 28.948801 | 53.312334 | 83 | 2 | 36 | 28.500721 | 53.516178 | 135 | 2 |
| 14 | 28.981959 | 53.184211 | 0 | 1 | 37 | 28.505358 | 53.530622 | 368 | 2 |
| 15 | 28.966185 | 53.168300 | 0 | 1 | 38 | 28.513342 | 53.533937 | 735 | 2 |
| 16 | 28.947530 | 53.194809 | 3,023 | 3 | 39 | 28.523522 | 53.518746 | 255 | 2 |
| 17 | 28.962441 | 53.206915 | 12,483 | 4 | 40 | 28.535712 | 53.546095 | 8,880 | 4 |
| 18 | 28.868347 | 53.133130 | 75 | 2 | 41 | 28.549132 | 53.509364 | 0 | 1 |
| 19 | 28.779141 | 53.259646 | 2,325 | 3 | 42 | 28.567053 | 53.532719 | 0 | 1 |
| 20 | 28.770289 | 53.296342 | 998 | 3 | 43 | 28.570218 | 53.457169 | 83 | 2 |
| 21 | 28.683328 | 53.530932 | 195 | 2 | 44 | 28.618094 | 53.397301 | 0 | 1 |
| 22 | 28.507193 | 53.612112 | 2,700 | 3 | 45 | 28.617202 | 53.362431 | 0 | 1 |
| 23 | 28.518237 | 53.667010 | 0 | 1 | 46 | 28.524671 | 53.553364 | 15 | 2 |
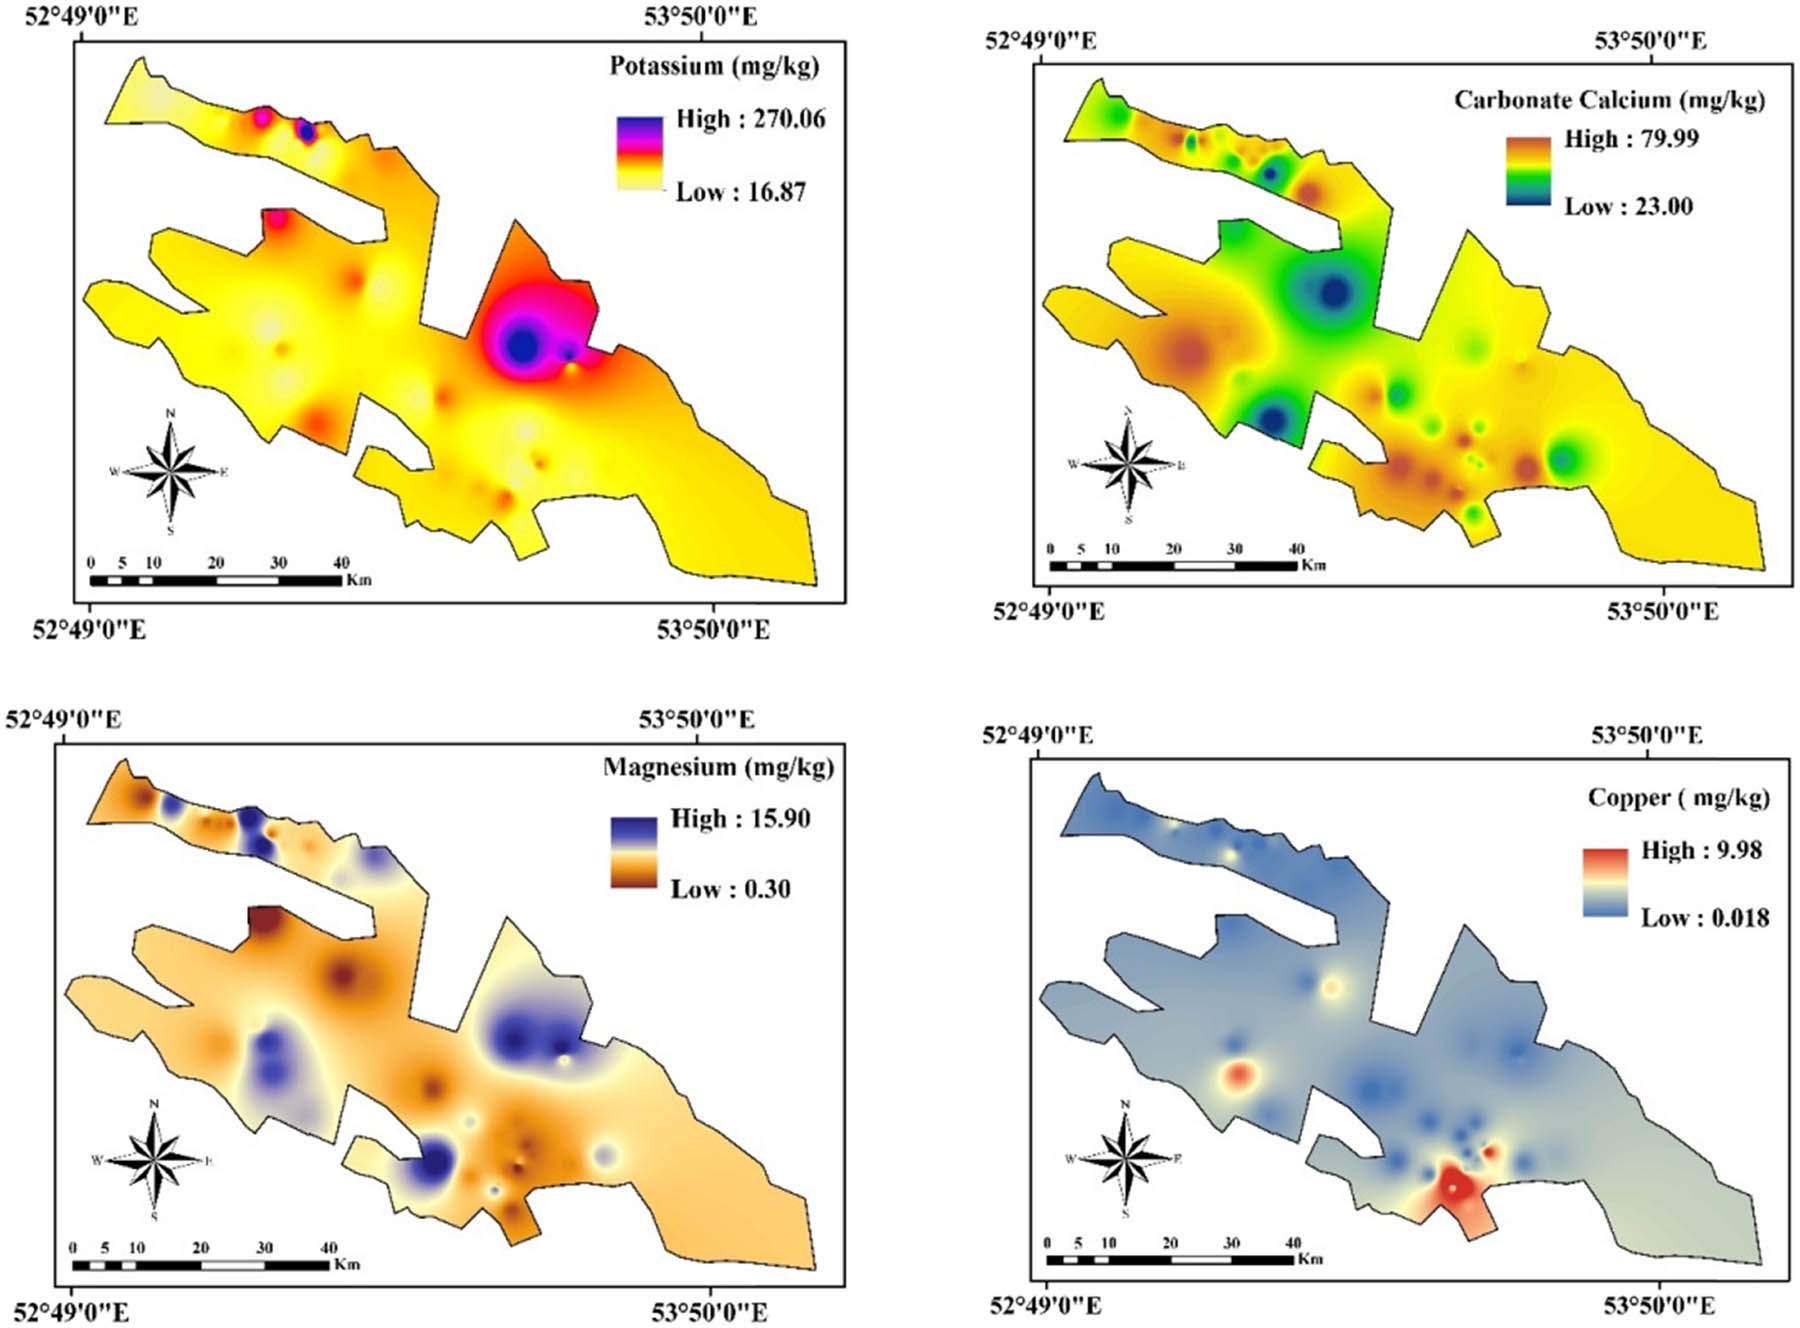
Figure 2
GIS-based spatial distribution maps of soil potassium, calcium carbonate, magnesium, and copper in citrus orchards of Jahrom County, Fars Province.
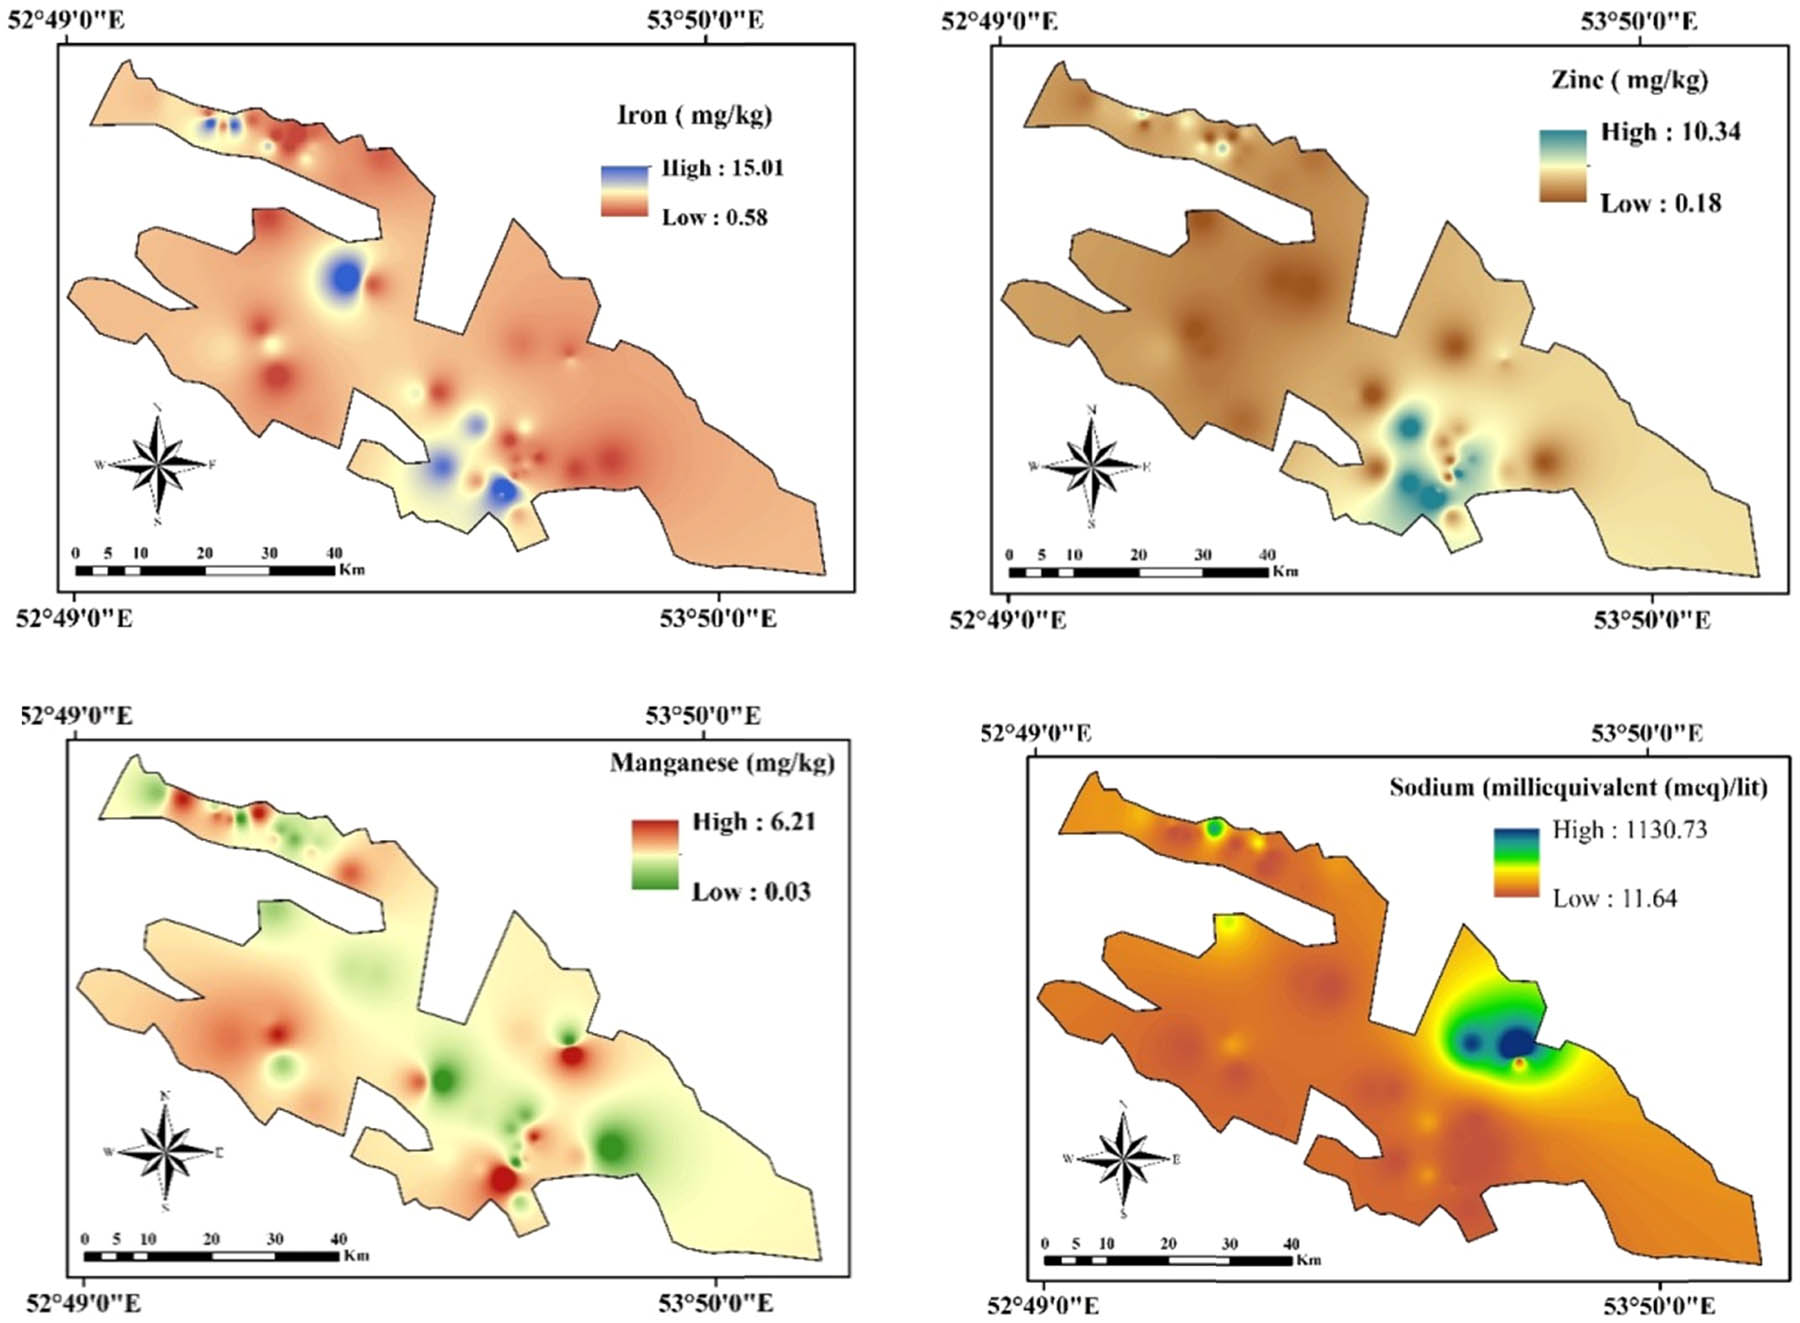
Figure 3
GIS-based distribution maps of soil iron, zinc, manganese, and sodium in citrus orchards of Jahrom County, Fars Province.
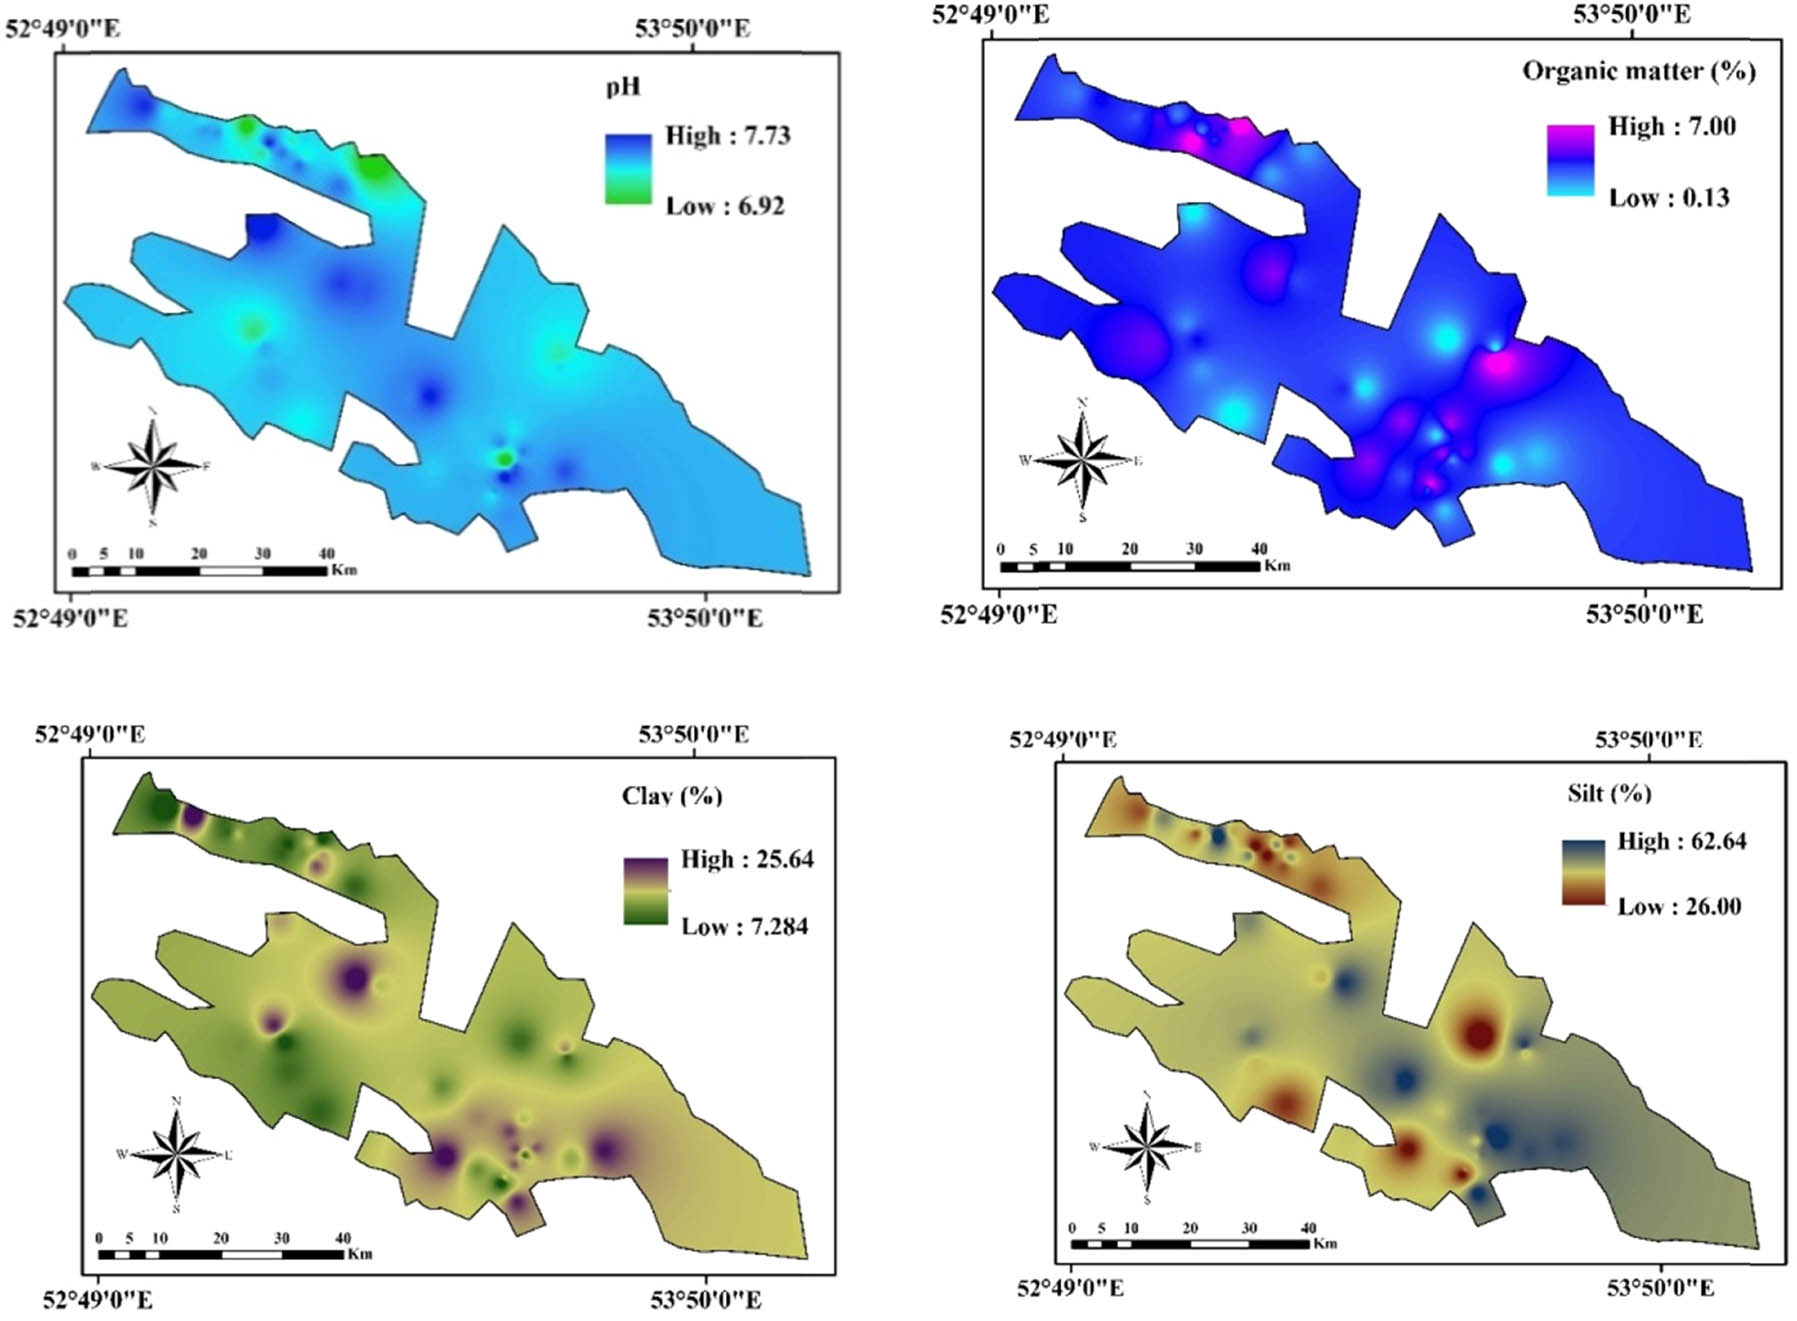
Figure 4
GIS-based spatial distribution maps of soil pH, organic matter, clay, and silt in citrus orchards of Jahrom County, Fars Province.
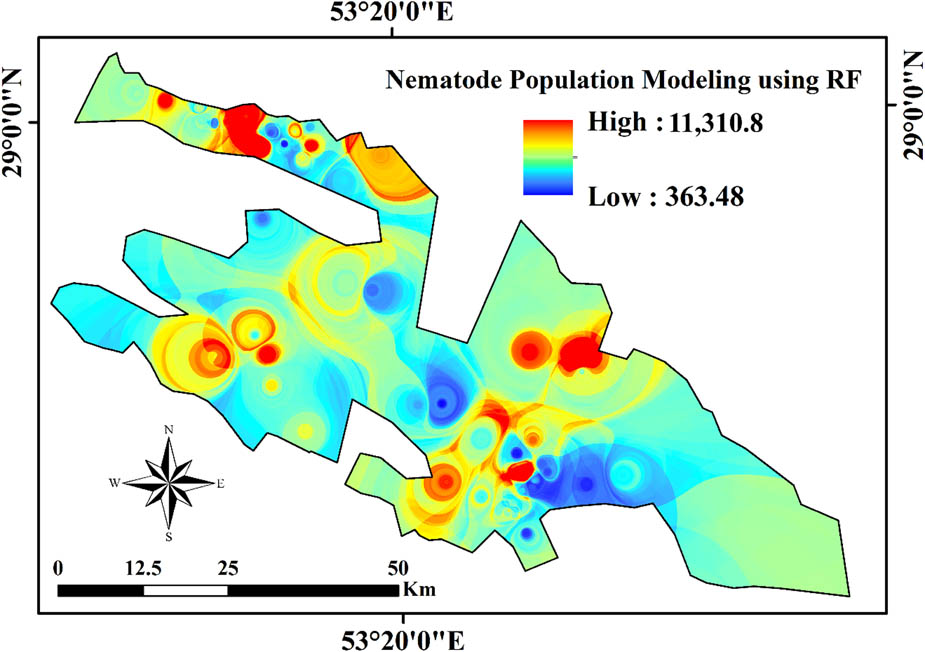
Figure 5
Spatial distribution model of Tylenchulus semipenetrans in citrus orchard soils of Jahrom County, Fars Province, using the Random Forest (RF) machine learning algorithm.
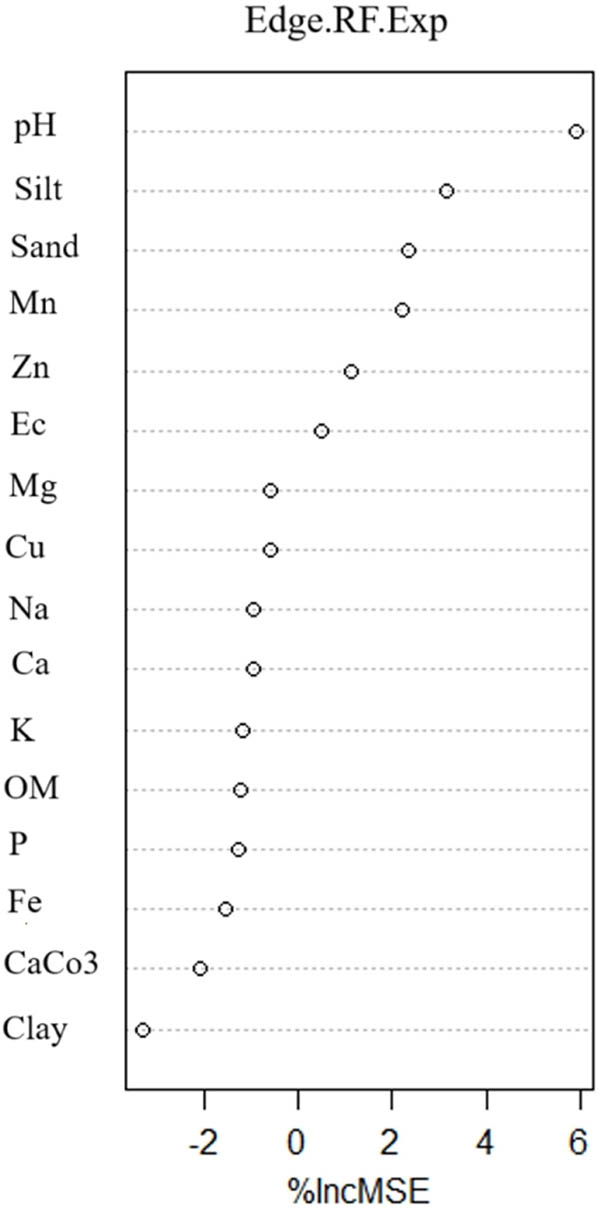
Figure 6
Relative importance of soil physicochemical properties influencing the distribution of Tylenchulus semipenetrans in citrus orchard soils of Jahrom County, Fars Province, based on Random Forest (RF) model. Soil variables included pH, silt, sand, manganese, zinc, EC, magnesium, copper, sodium, calcium, potassium, organic matter, phosphorus, iron, calcium carbonate, and clay. Edge.RF.Exp refers to the experimental RF model used to evaluate the effects of soil properties within the defined study area. “%IncMSE” represents the percentage increase in the mean squared error (MSE) following random permutation of each variable, higher values indicate greater influence on nematode distribution.
Table 3
Reproduction of 19 Tylenchulus semipenetrans populations on differential host plants [olive (Olea europaea), grapevine (Vitis vinifera), sour orange (Citrus aurantium), and trifoliate orange (Poncirus trifoliata] 8 months after inoculation
| Population codes | Nematode counts on differential hosts 8 months after inoculationa | |||
|---|---|---|---|---|
| Olive | Grapevine | Sour orange | Trifoliate orange | |
| 411 | 0 | n.d. | 310 | 0 |
| 828 | 0 | n.d. | 2,200 | 0 |
| 830 | 0 | n.d. | 4,410 | 0 |
| 835 | 0 | n.d. | 2,820 | 0 |
| 843 | 0 | n.d. | 560 | 0 |
| 898 | 0 | n.d. | 1,500 | 0 |
| 908 | 75 | 120 | 2,100 | 0 |
| 921 | 90 | 735 | 9,315 | 0 |
| 942 | 45 | 105 | 5,505 | 15 |
| 969 | 0 | 0 | 220 | 0 |
| 993 | 30 | 90 | 5,115 | 75 |
| 1001 | 0 | 70 | 510 | 105 |
| 1033 | 0 | 90 | 135 | 0 |
| 313 A | 0 | 0 | 1,550 | 0 |
| 37 A | 0 | 0 | 780 | 0 |
| 411 A | 0 | n.d. | 3,240 | 0 |
| 42B | 0 | n.d. | 2,460 | 0 |
| AA-1 | 75 | n.d. | 21,160 | 0 |
| Gre P | 0 | 0 | 8,220 | 30 |