
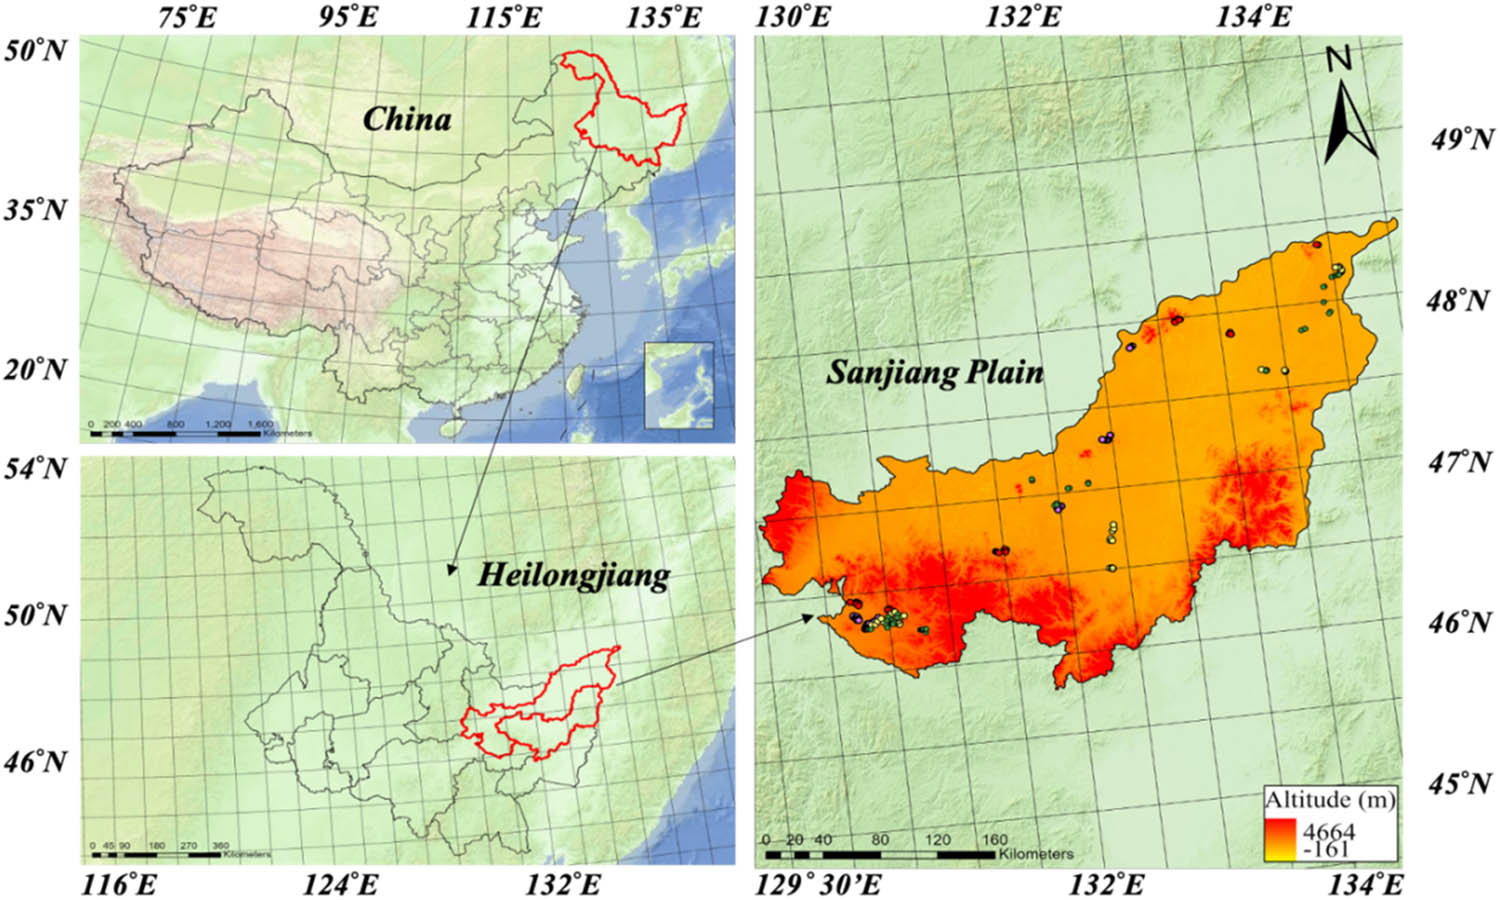
Figure 1
Geographic distribution of sampling sites in 2024 in the Sanjiang Plain. Symbols indicate soil type at each sampling location: pink circle, black soil (Phaeozem); blue circle, meadow soil; yellow circle, albic soil; red circle, dark brown soil (Cambisol).
Table 1
Heterodera glycines distribution and population density across six counties in the Sanjiang Plain of Heilongjiang Province, China
| Region | County | Soil samples | Positive (%) | Empty cysts (%) | Cysts per 100 g soil | Eggs and juveniles per 100 g soil | |
|---|---|---|---|---|---|---|---|
| Mean value ± SE | Maximum | Mean value ± SE | |||||
| Shuangyashan | Baoqing | 42 | 92.9 | 74.9 | 3 ± 0.5 | 17 | 288 ± 57.5 |
| Raohe | 12 | 100 | 61.0 | 4 ± 0.8 | 14 | 579 ± 178.2 | |
| Jiamusi | Tongjiang | 6 | 83.3 | 80.9 | 6 ± 3.0 | 47 | 386 ± 284.9 |
| Fuyuan | 14 | 92.9 | 88.5 | 8 ± 2.7 | 59 | 318 ± 107.5 | |
| Fujin | 16 | 25.0 | 82.2 | 2 ± 0.5 | 17 | 122 ± 68.4 | |
| Huanan | 96 | 96.9 | 95.2 | 10 ± 1.4 | 165 | 174 ± 29.8 | |
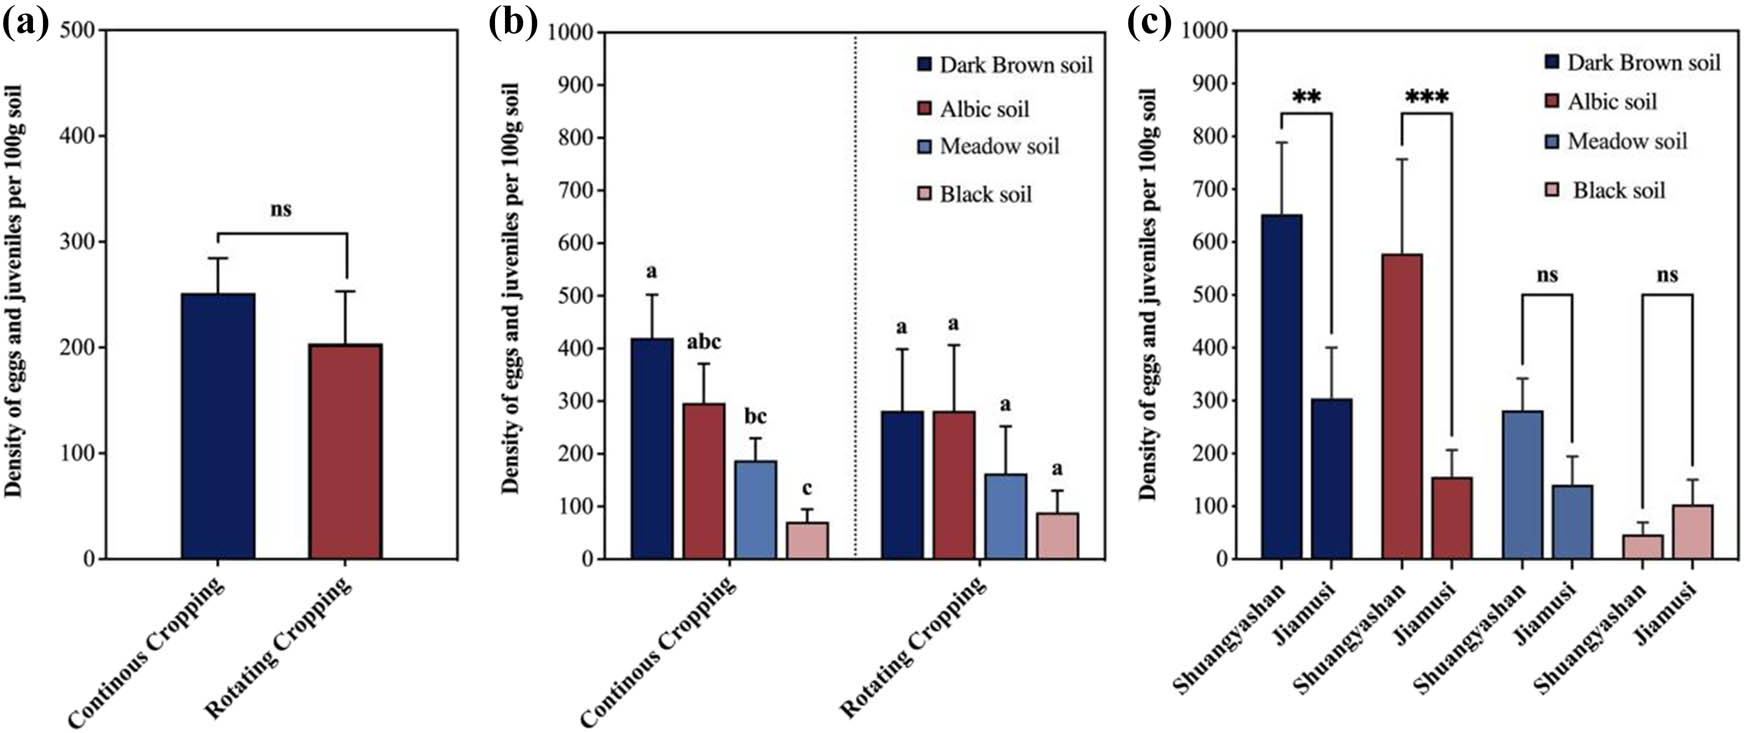
Figure 2
Population density of Heterodera glycines by cropping system and different soil types in the Sanjiang Plain. (a) Population density under different cropping systems. The bars represent the mean values ± SE (ns represents not significant, P > 0.05). (b) Population density across soil types under continuous soybean cultivation vs crop rotation. The bars represent the mean values ± SE. The same lowercase letters indicate no significant differences among soil types within the same farm system (Tukey’s HSD test, P > 0.05). (c) Population density across soil types under continuous soybean cultivation by prefecture (Shuangyashan and Jiamusi). The bars represent the mean values ± SE (**, P < 0.01; ***, P < 0.001; ns represents not significant, P > 0.05).
Table 2
Virulence phenotypes of Heterodera glycines populations from the Sanjiang Plain determined using standard differential hosts
| Region | Population | Lee 74 females | FI (%)a | Raceb | |||
|---|---|---|---|---|---|---|---|
| PI 548402 | PI 88788 | PI 90763 | Pickett | ||||
| Shuangyashan | Raohe #1 | 79 ± 17.7 | 3.8 ± 1.4 | 4.4 ± 1.8 | 1.3 ± 0.7 | 1.9 ± 0.5 | 3 |
| Raohe #2 | 87 ± 18.7 | 2.6 ± 0.6 | 2.3 ± 0.4 | 1.1 ± 0.7 | 3.4 ± 0.7 | 3 | |
| Raohe #3 | 172 ± 17.4 | 0.7 ± 0.3 | 2.5 ± 0.8 | 0.4 ± 0.2 | 3.2 ± 0.6 | 3 | |
| Baoqing #1 | 66 ± 3.8 | 2.7 ± 1.1 | 2.7 ± 1.5 | 3.0 ± 1.2 | 4.2 ± 2.0 | 3 | |
| Baoqing #2 | 94 ± 7.8 | 3.5 ± 1.3 | 6.1 ± 1.0 | 3.2 ± 1.0 | 4.5 ± 2.8 | 3 | |
| Jiamusi | Fujin | 163 ± 10.6 | 4.3 ± 0.6 | 4.4 ± 1.2 | 3.7 ± 0.7 | 2.1 ± 0.6 | 3 |
| Fuyuan | 135 ± 6.7 | 2.8 ± 0.9 | 3.6 ± 1.0 | 3.0 ± 1.2 | 4.1 ± 1.0 | 3 | |
| Huanan #1 | 92 ± 3.2 | 4.3 ± 1.2 | 2.7 ± 1.0 | 2.7 ± 1.0 | 4.1 ± 1.6 | 3 | |
| Huanan #2 | 158 ± 22.3 | 3.5 ± 1.3 | 4.4 ± 0.8 | 2.1 ± 0.5 | 3.2 ± 0.8 | 3 | |
Notes: Female counts represent mean values from six biological replicates per population.
[ii] bRace assignment follows Riggs and Schmitt (1988): FI ≥ 10% indicates susceptibility, FI < 10% indicates resistance. All populations showed FI < 10% on PI 88788, PI 90763, and Pickett, indicating race 3.