
Due to their high abundance, their multilevel trophic connections and worldwide distribution, soil nematodes have been used to address various ecological questions. For over 40 years nematode communities have been investigated in relation to: soil quality assessments, nematode population dynamics analyses, or biological controls of nematode pests (e.g. Bird et al., 1974; Ritz and Trudgill, 1999; Thornton and Matlack, 2002; Ali et al., 2017; Treonis et al., 2018). Although classical morphological identification of nematodes remains important, it requires specialized skills and time. Consequently, different molecular techniques such as polymerase chain reaction – denaturing gradient gel electrophoresis (PCR-DGGE), terminal restriction fragment length polymorphism (T-RFLP), quantitative PCR (qPCR) or high throughput sequencing (HTS; metabarcoding) were proposed to facilitate nematode diversity studies (Okada and Oba, 2008; Porazinska et al., 2009; Donn et al., 2012; Vervoort et al., 2012; Gendron et al., 2023). Over the past 15 years, the potential of DNA metabarcoding approaches has remained a focal point of sustained scientific interest (Porazinska et al., 2010; Darby et al., 2013; Sapkota and Nicolaisen, 2015; Peham et al., 2017; Griffiths et al., 2018; Waeyenberge et al., 2019; Ahmed et al., 2019; Kawanobe et al., 2021; Zapałowska et al., 2023; Ren et al., 2024, Akanwari et al., 2025, Hayden et al., 2025). However, its suitability for DESS-preserved (Yoder et al., 2006) samples has not been fully explored. This is especially important, as many diversity studies require preservation of nematological material before molecular analyses, which often cannot be performed immediately after nematode extraction from soil. The ability of metabarcoding approaches to identify actual nematode species compositions in the soil remains a challenge and in studies focused on plant parasitic nematode detection, identifications other than to the species level (i.e. operational taxonomic units [OTUs], feeding guilds, nematode families, or even genera) can be insufficient. Within a single nematode genus comprising dozens of nematode species, there are cases where only some of them are significantly harmful to plants (i.e. Dobosz et al., 2020; Rybarczyk-Mydłowska et al., 2012). Therefore, precise information on the occurrence of an agriculturally important (e.g. quarantine) nematode pest in an analysed soil sample, ideally also in relation to other coexisting nematode species, is invaluable.
Soil environments are inhabited by diverse nematodes that occur at different levels of soil food web and are involved in soil processes. That is why, nematode species can occur locally in various abundances differing considerably in their morphology, e.g. in size or cuticle structure. This might affect the process of DNA extraction, and as a consequence enlarge discrepancies between nematode abundances obtained by morphological and metabarcoding methods. Therefore, to help choose the most suitable metabarcoding procedures, it is still important that mock communities used for metabarcoding tests represented the highest possible nematode diversities that occur in real environments.
A major limitation of amplicon sequencing DNA-metabarcoding approaches is still the short read length of the next-generation sequencing (NGS) platforms. Although, the taxonomic resolution problems might be overcome in the future by the long-read HTS sequencing methods (Hayden et al., 2025), the still frequently used Illumina MiSeq system gives the possibility to analyse genomic regions not longer than approximately 500–550 bp. This may limit the possibility of nematode species identification based on a single nuclear ribosomal marker, especially the less variable 18S rDNA. To properly identify nematode species, 1–1.5 kb long sequence of 18S rDNA is required, and 600–1,000 bp long sequence is required for the more variable 28 rDNA, which is easily achievable using the standard Sanger sequencing. Various 18S rDNA primer pairs have been proposed with slightly different taxonomic resolution, coverage, and specificity (Ficetola et al., 2024). Earlier studies by Porazinska et al. (2009) showed that using both, the 18S rDNA and 28S rDNA may significantly improve the detection level of nematode species. The use of markers within these two rDNA regions and an attempt at amplifying an even more variable gene from soil nematode community samples, such as mitochondrial regions was tested in the work of Ahmed et al. (2019). Although the mitochondrial DNA of nematodes is highly variable and amplifying a region of 400–500 bp would give a sufficient resolution to identify most nematode species, due to the same high interspecific variability, there are no mitochondrial DNA primers with universal coverage for the whole phylum Nematoda. There were already several attempts made to employ mitochondrial cytochrome oxidase 1 (mtCOI) primers (that proved to be working well for several nematode groups) in metabarcoding studies of nematodes (Ahmed et al., 2019; Sikder et al., 2020; Ren et al., 2024). However, only the primer pair COIFGED/JB5GED proposed by Ren et al. (2024) showed an improved taxa recovery in comparison to other mtCOI primers, and was recommended for further use in assessing of nematode biodiversity as supplementary or alternative to the conventional 18S rDNA metabarcoding. An alternative to the problem of using mitochondrial DNA (mtDNA) in research on nematode biodiversity studies could be the use of primer-free mitochondrial metagenomics (Gendron et al., 2023). However, currently the major limitation of the barcoding studies based on the mtCOI is the breadth of the reference mitogenomic database.
The development of a metabarcoding protocol that would allow for the identification of soil nematode communities to the species level is still in progress. The purpose of this study was to assess the recoverability of constituent taxa from two artificially assembled nematode communities. These communities consisted of morphologically identified taxa (either DESS pretreated or freshly extracted from soil), representing diverse trophic groups, as well as taxa often underrepresented in previous metabarcoding studies. These include the representatives of spiral nematodes (family Hoplolaimidae), that are cosmopolitan and ubiquitous in many environments. The complementary hypotheses of this research were: (H1) samples composed of fresh nematodes would recover greater nematode diversity than the DESS-treated ones, (H2) there would be no substantial differences in taxa read recovery between samples extracted with two different DNA isolation methods, (H3) combining amplifications of the 18S and 28S rDNA sequences would yield higher taxa diversity and would allow for better taxa resolution than using either marker alone.
1. Materials and methods
1.1. Sampling and nematode extraction
Nematode samples were collected mostly in years 2019 and 2020, from various environments and localities in Poland and laboratory cultures, which are specified in Table 1. The nematodes were extracted from the soil samples by decantation and sieving method followed by the centrifugal flotation method (van Bezooijen, 2006). In the case of fresh leaf and tomato root samples, the material was cut into smaller pieces and left on moist nematode filters in an extraction sieve until sufficient nematodes migrated into the water.
Table 1
Taxonomical and quantitative composition of the two artificially composed sample sets (Set 1 and 2)
| Taxon (order, family, feeding strategy) | Set 1 (nematode treated with DESS, replicates: 1aCD-1cCD and 1dQ-1fQ) | Set 2 (freshly extracted nematodes, replicates: 2aCD-2cCD and 2dQ-2fQ) | |||
|---|---|---|---|---|---|
| Sampling details: locality, environment, associated plant, sampling year | # Individuals per each replicate | Sampling details: locality, environment, associated plant, sampling year | # Individuals per each replicate | ||
| 1 | Meloidogyne hapla (Rhabditida, Meloidogynidae, plant parasite) | Solanum lycopersicum L. (culture),a 2019 | 100 | Solanum lycopersicum L. (culture),a 2020 | 100 |
| 2 | Aphelenchoides ritzemabosi (Rhabditida, Aphelenchoididae, fungivore) | Brunnera sp. C. Steven (culture),b 2018 | 20 | Clematis sp. L. (culture 2018),b 2020 | 20 |
| 3 | Acrobeles sp. (Rhabditida, Cephalobidae, bacterivore) | Mistrzewice, meadow, Berteroa incana (L.) DC., 2019 | 20 | Mistrzewice, meadow, Berteroa incana (L.) DC., 2020 | 20 |
| 4 | Anaplectus sp. (Plectida, Plectidae, bacterivore) | Mistrzewice, Bzura river bank plants, Rubus caesius L., 2019 | 10 | Mistrzewice, Bzura river bank plants, Rubus caesius L., 2020 | 10 |
| 5 | Rotylenchus uniformis (Rhabditida, Hoplolaimidae, plant parasite) | Dziekanów Leśny, garden, Ribes sp. L., 2010 | 10 | Dziekanów Leśny, garden, Ribes sp. L., 2020 | 10 |
| 6 | Helicotylenchus sp. (Rhabditida, Hoplolaimidae, plant parasite) | Mistrzewice, meadow, Berteroa incana (L.) DC., 2019 | 25 | Mistrzewice, meadow, Berteroa incana (L.) DC., 2020 | 20 |
| 7 | Qudsianematidae (Dorylaimida, omnivore) | Mistrzewice, forest, Quercus robur L., 2019 | 20 | Mistrzewice, forest, Quercus robur L., 2020 | 10 |
| 8 | Longidorus sp. (Dorylaimida, Longidoridae, plant parasite) | Augustów, herbaceus plants near Alnus Mill., 2019 | 5 | Mistrzewice, field cultivation, Zea mays L., 2020 | 2 |
| 9 | Mesocriconema xenoplax (Rhabditida, Criconematidae, plant parasite) | Mistrzewice, Bzura river bank plants, Rubus caesius L., 2019 | 4 | Mistrzewice, Bzura river bank plants, Rubus caesius L., 2020 | 20 |
| 10 | Paratylenchus projectus (Rhabditida, Tylenchulidae, plant parasite) | Augustów, meadow, Trifolium arvense L., 2019 | 20 | — | |
| 11 | Tylenchorhynchus sp. (Rhabditida, Dolichodoridae, plant parasite) | Mistrzewice, meadow, Linaria vulgaris Mill., 2019 | 10 | — | |
| 12 | Tripylina cf. arenicola (Enoplida, Trefusiidae, predaceous) | Mistrzewice, meadow, Berteroa incana (L.) DC., 2019 | 10 | — | |
| 13 | Plectus sp. (Plectida, Plectidae, bacterivore) | Augustów, herbaceus plants near Alnus Mill., 2019; Mistrzewice, Bzura river bank plants, Rubus caesius L., 2019 | 10 | — | |
| 14 | Aporcelaimidae (Dorylaimida, omnivore) | Mistrzewice, Bzura river bank plants, Rubus caesius L., 2019 | 5 | — | |
| 15 | Tylocephalus auriculatus (Plectida, Plectidae, bacterivore) | Augustów, meadow, Trifolium arvense L., 2019 | 2 | — | |
| 16 | Coomansus parvus (Mononchida, Mononchidae, predaceaus) | Mistrzewice, meadow, Berteroa incana (L.) DC., 2019 | 2 | — | |
| 17 | Helicotylenchus pseudorobustus (Rhabditida, Hoplolaimidae, plant parasite) | — | Łomna, wasteland, Juncus sp. L., 2020 | 20 | |
| 18 | Pratylenchus sp. (Rhabditida, Pratylenchidae, plant parasite) | — | Łomna, wasteland, Pyrus sp. L., 2020 | 20 | |
| 19 | Paratrichodorus pachydermus (Triplonchida, Trichodoridae, plant parasite) | — | Mistrzewice, forest, Quercus robur L., 2020 | 20 | |
| 20 | Rotylenchus goodeyi (Rhabditida, Hoplolaimidae, plant parasite) | — | Łomna, wasteland, Juncus sp. L., 2020 | 10 | |
| 21 | Geocenamus longus (Rhabditida, Dolichodoridae, plant parasite) | — | Mistrzewice, forest, Quercus robur L., 2020 | 10 | |
| 22 | Alaimidae (Enoplida, bacterivore) | — | Mistrzewice, forest, Quercus robur L., 2020 | 5 | |
| 23 | Discolaimus major (Dorylaimida, Qudsianematidae, omnivore) | — | Mistrzewice, field cultivation, Zea mays L., 2020 | 5 | |
| 24 | Mylonchulus sp. (Mononchida, Mylonchulidae, predaceaus) | — | Dziekanów Leśny, garden, Ribes sp. L., 2020 | 2 | |
| ∑ | 273 | 304 | |||
Note: Each sample set was prepared in six replicates: aCD-cCD (destined for the DNA isolation with the “CD” kit) and dQ-fQ (destined for DNA isolation with “Q” kit). Systematics according to Nemys: World Database of Nematodes (Bezerra et al. 2023). Origins of each nematode species are given in column with the sampling details.
anematodes were extracted from roots, courtesy of Dr. Łukasz Flis (Museum and Institute of Zoology PAS, Poland).
bnematodes were extracted from leaves, courtesy of Dr. Aneta Chałańska (NEFscience, Skierniewice, Poland).
1.2. Morphological identification and preservation
After the nematodes were extracted from soil, roots, or leaves and placed in water suspensions, they were heat-killed in tap water. Subsequently, they were observed and sorted using a stereoscopic microscope. Sorted and labelled nematodes were either fixed in a triethanolamine formalin (TAF) water solution or in a DESS mixture (Yoder et al., 2006), or placed directly in composed (mock) community test samples used for metabarcoding analyses. Temporary (DESS) and permanent (TAF) slides were made for further detailed morphological identification according to the method of Seinhorst (1959). After the photographic documentation was prepared using Leica DFC 500 camera on a Leica DM 5000B microscope (Leica Microsystems, Wetzlar, Germany) and after identification of the family, genus, or species levels, the nematodes from the temporary slides were rinsed of the preservative solution and placed in the freezer (the washing procedure as in Rybarczyk-Mydłowska et al., 2022). They constituted the base of reserve material for additional molecular analyses including the acquisition of new DNA fragments for reference sequence databases as well as for supplementary molecular identification. The permanent slide specimens are stored at the Laboratory of Nematology at the Museum and Institute of Zoology PAS.
1.3. Composition of artificial nematode community samples
After the preliminary identification of selected nematode taxa, two nematode sets (Set 1 and Set 2), composed of DESS-treated (at least for a year) and DESS-untreated (fresh) individuals, were prepared (Fig. 1, Table 1). These sets differed in taxa composition and number of individuals and were composed by transferring each nematode into 2 ml Eppendorf tube containing 150 µl of Milli-Q water or 180 µl of ATL buffer (Qiagen, Hilden, Germany), depending on the DNA extraction method used. Six replicates of each set, DESS-treated and untreated communities, were prepared: three were suspended in Milli-Q water (a–c) and three in the ATL buffer (d–f). Prior to the DNA isolation procedures, these DESS-treated mock communities (Set 1) were washed with phosphate buffered saline (PBS) solution and Milli-Q water as in the study by Rybarczyk-Mydłowska et al. (2022). The second set (Set 2) of the mock communities consisted of nematodes picked from water suspensions, directly after they were extracted from soil (roots or leaves), heat-treated, and sorted under a stereo microscope.
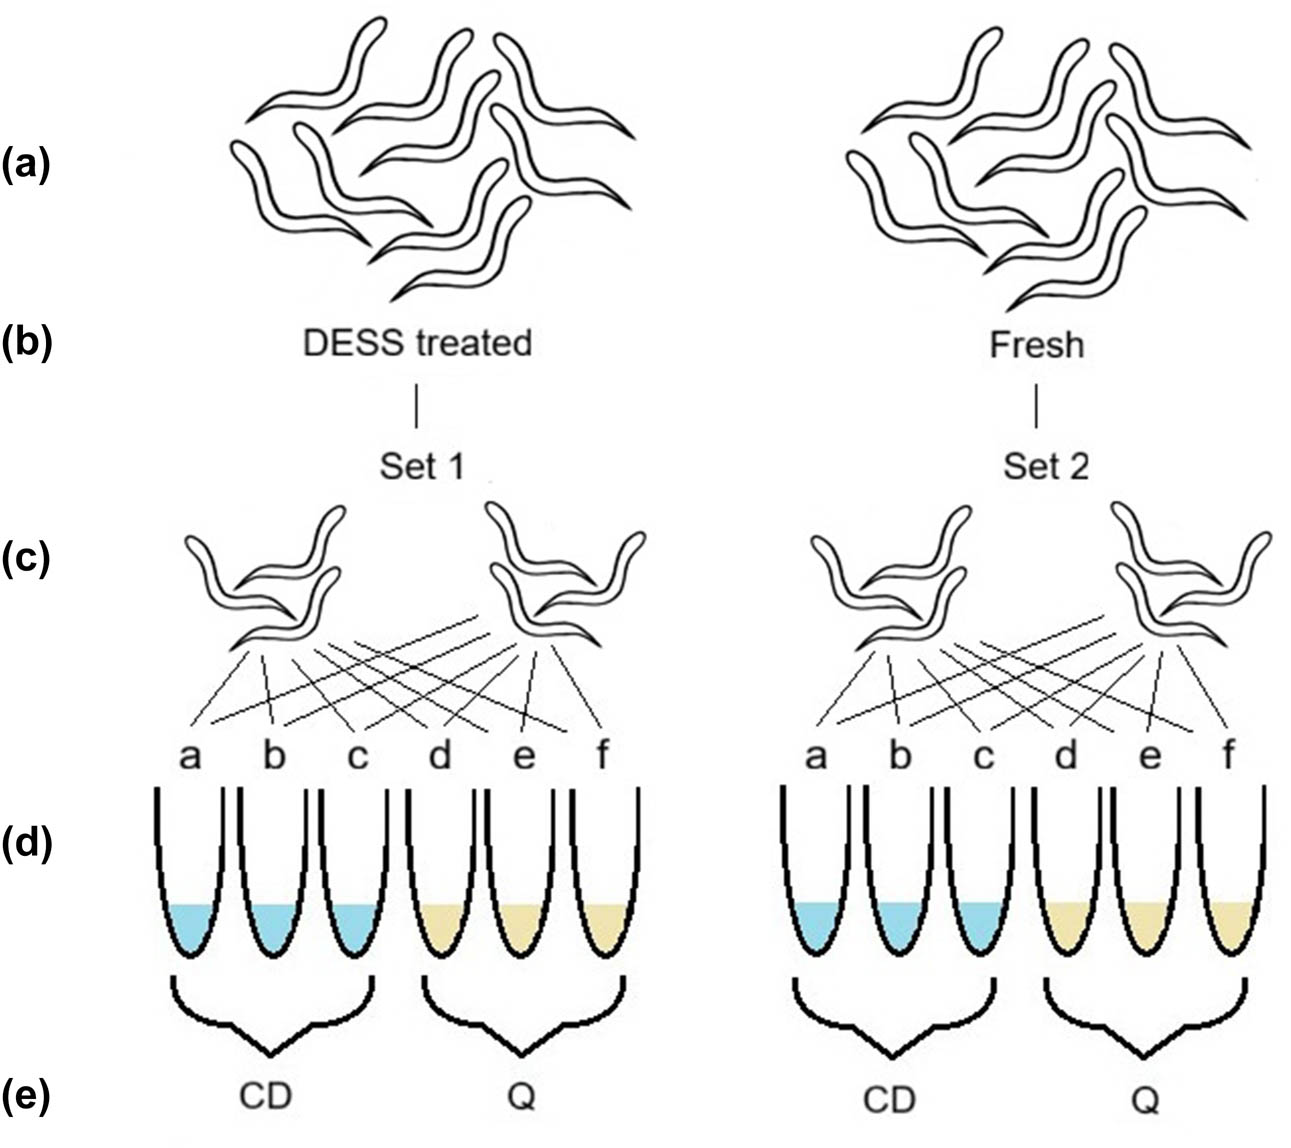
Figure 1
Simplified scheme of (mock) community sample preparation used for metabarcoding analyses. (a) Extracted heat-killed nematodes. (b) DESS preservative treatment or lack of treatment. (c) Transfer of the individual representatives of the segregated and identified nematode taxa into the test tubes. (d) Replicates containing milliQ water (marked in blue) or ATL buffer (yellow). Sets 1 and 2 differed in taxa composition (Table 1). Each replicate within the same set comprised of the same taxa and their amounts. (e) DNA isolation either with “CD” or “Q” method. As a result, 12 DNA samples were prepared and further analysed: 1aCD-1cCD, 1dQ-1fQ, 2aCD-2cCD, and 2dQ-2fQ.
Three replicates of each nematode set were used for DNA isolation using one of the two tested isolation kits (“CD” – ClearDetections, Wageningen, The Netherlands or “Q” – Qiagen, Hilden, Germany; Fig. 1). As a result, 12 samples were prepared (representing 2 sets of soil nematode taxa, isolated with 2 methods in 3 replicates each): 1aCD-1cCD, 1dQ-1fQ, 2aCD-2cCD, and 2dQ-2fQ, which were subsequently stored in a freezer (−20oC) until the total DNA isolation process. Five nematode taxa (Acrobeles sp., Anaplectus sp., Aphelenchoides ritzemabosi, Meloidogyne hapla, and Rotylenchus uniformis) having the same number of individuals were included in both of the mock community sets (see the first five nematode taxa in Table 1) in order to better assess the influence of DESS on the tested metabarcoding approach. Four additional nematode taxa, with different abundances, were also included in both sets (see the nematode taxa from 6 to 9 in Table 1). As we aimed for the biggest nematode diversity possible, and the repeated sampling after 1 year allowed us to obtain the same taxa only partially, the remaining nematode taxa varied in both their identities and abundances across the two sets. However, these set up was sufficient to test the efficiency of the method itself and to evaluate if a specific nematode taxon, represented by a specific number of individuals, will be retrieved. The total number of individuals for Set 1 and Set 2 were similar (273 and 304, respectively). Finally, to compare the efficiency of the two chosen DNA isolation methods combined with the metabarcoding approach, the nematode sets were constituted in a way that included representatives of all trophic groups, varying in numbers, sizes, and cuticle structures. Our aim was not to test all possible DNA extraction kits, as it would further complicate the complex set up of the experiment. The selection of the two kits was subjective and chosen as one of them (“Q”) was successfully used in previous research (Ahmed et al., 2019, Waeyenberge et al., 2019) and the other one is specifically designed by the manufacturer for works with nematode suspensions (“CD”).
1.4. DNA isolation
Isolation of DNA from the two sets of the artificially composed samples destined for metabarcoding studies (Table 1 and Fig. 1) was done using either the “Nematode DNA extraction & purification kit for nematode suspensions and multiple cysts” (Clear®Detections, “CD”) or the “DNeasy® Blood & Tissue Kit” (Qiagen, “Q”), following manufacturers’ instructions, with minor modifications to the original protocols. Previous results of our studies (data not published) showed that the initial direct resuspension of nematodes in the buffer ATL, instead of water, increases the efficiency of tissue lysis for the “Q” method. For this reason, the samples destined for the DNA isolation with this kit (1dQ-1fQ and 2dQ-2fQ) were transferred to ATL buffer prior to the extraction. In the “CD” method, instead of the recommended 200 μl, the total nematode lysate (300 μl) was transferred to the “pre-purification tube.” Additionally, due to such increased sample volume, two (instead of one) extraction columns were used per sample so that the final volume of the obtained sample was 200 μl. Similarly, the final eluate volume for the Q method was changed from 400 to 200 μl by adding half of the recommended amounts of the AE buffer in the last two elution steps. During the enzymatic lysis phase of both methods (200 rpm; 56°C or 65°C depending on the method), the incubation of the samples in the lysis buffers was prolonged to 24 h; however, it was interrupted several times for short periods of observations to examine the degree of nematode tissue degradation. These observations were conducted under a stereomicroscope, through plastic wall of a sample tube, without opening the lid. After the isolation process, DNA concentration was measured using the NanoDropTM instrument.
Single nematode individuals selected for additional molecular studies, for the purpose of supplementing the reference sequence database or confirming the morphological identifications, were transferred to separate 0.2 ml PCR tubes containing 25 μl of sterile water. An equal volume of the lysis buffer (Holterman et al., 2006) was added to each tube. The lysis conditions were 65°C for 3 h followed by a 5 min incubation at 100°C.
1.5. Preparation of reference sequence databases
Two reference sequence databases were created: 18S rDNA and 28S rDNA. They included GenBank available nematode sequences as well as sequences acquired in this study (Accessed: 14 September 2022). The search term used for the 28S rDNA was: “((“Nematoda”[Organism] OR nematode[All Fields]) AND 28S[All Fields]) NOT 5.8S[All Fields] NOT uncultured[All Fields] NOT (“unidentified”[Organism] OR unidentified[All Fields]) OR ((“Nematoda”[Organism] OR nematode[All Fields]) AND lsu[All Fields]) NOT 5.8S[All Fields] NOT uncultured[All Fields] NOT (“unidentified”[Organism] OR unidentified[All Fields]) NOT chromosome[All Fields] NOT wgs[All Fields] NOT refseq[All Fields] AND (“300”[SLEN]: “3500”[SLEN]).” A similar search term was used for the 18S rDNA, with 28S and LSU (large subunit) replaced with 18S and SSU (small subunit), respectively. Sequences of the selected single nematodes and GenBank-downloaded sequences together formed the databases comprising of 38,955 18 rDNA and 12,733 28S rDNA sequences in total.
1.6. PCR and sequencing conditions for single nematode DNA amplification
In order to improve the reference databases, rDNA was amplified from the four investigated Hoplolaimidae taxa (H. pseudorobustus, Helicotylenchus sp., Rotylenchus goodeyi and R. uniformis), Geocenamus longus, Mylonchulus brachyuris, and Tylocephalus auriculatus (Table 1). The detailed DNA amplification and sequencing conditions are described in previous studies focusing on characterizations of G. longus and R. goodeyi (Rybarczyk-Mydłowska et al., 2022; Singh et al., 2022). The DNA sequences obtained for the rest of the mentioned species were submitted under the GenBank accession numbers: OQ377005-OQ377012 (18S rDNA) and OQ377013-OQ377022 (28S rDNA).
1.7. NGS
From each of the isolated DNA sample replicates (1aCD-1cCD, 1dQ-1fQ, 2aCD-2cCD, 2dQ-2fQ), two amplicons were generated using primer combinations targeting 18S and 28S rDNA genomic regions (Table 2). The D2A/D2 primer combination was chosen in this study (and for the first time for metabarcoding applications) as it targets approximately 100 bp longer region in comparison to the frequently used D3FA/D3BR combination (Ahmed et al., 2019, Waeyenberge et al., 2019, Zapałowska et al., 2023). Each primer was ligated at its 5′ end either with the 5′-TCGTCGGCAGCGTCAGATGTGTATAAGAGACAG-3′ (forward) or the 5′-GTCTCGTGGGCTCGGAGATGTGTATAAGAGACAG-3′ (reverse) Illumina adapter sequence. Each reaction mix contained 12.5 μl of 2× KAPA HiFi HotStart ReadyMix, 2.5 µl of each primer (5 µM), 2 μl of DNA, and 5.5 µl of Milli-Q water. The cycling conditions were 95°C for 3 min, followed by a specific number of cycles at 95°C for 30 s, 62°C for 30 s, 72°C for 30 s, and a final step of 72°C for 5 min. The specific number of cycles was determined via an optimization qPCR, which identified 30 cycles as the optimal for samples that were isolated with the “CD” kit and 25 cycles for samples that were isolated with the Q method. The optimization qPCR reaction contained 10 µL of Sso Advanced Universal SYBR Green Supermix (Bio-Rad), 1.5 µl of each primer (5 µM), and 2 μl of DNA. The qPCR conditions were 98°C for 3 min, (95°C for 15 s, 62°C for 30 s, and 72°C for 30 s) ×40 and 60–95°C for the melting curve.
Table 2
Information on the primer combinations used in this metabarcoding study
| Primer pair codes | Genomic region | Nucleotide primer sequences (bolded) including the Illumina adapter (5′–3′) | Approx. amplicon length (bp) | Reference |
|---|---|---|---|---|
| NemFopt 18Sr2bRopt | 18S rDNA | 5′-TCGTCGGCAGCGTCAGATGTGTATAAGAGACAG-GGGGWAGTATGGTTGCAAA-3′5′-GTCTCGTGGGCTCGGAGATGTGTATAAGAGACAG-TGTGTACAAAKGRCAGGGAC-3′ | 500 | Waeyenberge et al. (2019) |
| D2A D2 | 28S rDNA | 5′-TCGTCGGCAGCGTCAGATGTGTATAAGAGACAG-ACAAGTACCGTGAGGGAAAGTTG-3′5′-GTCTCGTGGGCTCGGAGATGTGTATAAGAGACAG-TCCGTGTTTCAAGACGGG-3′ | 400 | Nunn (1992); Chombard, et al. (1998) |
After the amplicon PCR was performed, the acquired products were sent for NGS sequencing to Genomed company (Warsaw, Poland). The PCR products containing the adapter sequences were purified and indexed with the Nextera XT indexes. Reaction conditions were based on manufacturer’s recommendations. Sequencing was conducted on the Illumina MiSeq 2× 300 sequencer, using a paired-end approach. Automatic preliminary data analysis was carried out on the MiSeq using the MiSeq Reporter v2.6 software. The analysis consisted of two stages: automatic sample demultiplexing and generating FASTQ files containing raw reads. The obtained sequencing data are available from NCBI SRA database under the Bioproject PRJNA940653.
1.8. Bioinformatics and statistical analyses of the mock community diversity
Bioinformatic analysis was carried out using USEARCH v11.0.667 (Edgar, 2010). The paired raw reads were first merged using the command -fastq_mergepairs. Pairs with more than 10 base mismatches within their region of overlap were discarded. The resulting contigs were filtered using the command -fastq_filter, to remove ones with “expected error” of more than 1 or contig lengths shorter than 250 bp. Before clustering, the filtered reads were reduced to unique sequences (dereplicated) using the command -fastx_uniques. The dereplicated sequences each have their number of copies appended to their description lines in the dereplicated FASTA file. Clustering was performed using the -unoise3 command, which is based on the UNOISE algorithm (Edgar, 2016). This method clusters reads into amplicon sequence variants-like groups referred to as Zero-radius Operational Taxonomic Units (ZOTUs), instead of the traditional OTUs. ZOTU-based clustering results in the recovery of a higher number of correct biological sequences than the OTU-based approach (Edgar, 2016). Taxonomy assignments of the ZOTUs were performed using blast matches against the two custom reference databases described above, one for the 18S rDNA and the other for the 28S rDNA (suppl. data S1).
All statistical analyses were conducted using R and RStudio software (R Core Team 2023; Posit team 2024, v. 2024.4.2.764). For the mock community diversity analyses, mainly ggplot2 (Wickham, 2016) and phyloseq (McMurdie and Holmes, 2013) R packages were used. The 18S and 28S rDNA ZOTUs tables, the taxonomy (including information on trophic preferences) tables and the samples table (supp. data S1) were transformed into phyloseq objects. The number of reads from each of the two sets and each of the two primer combination sequencings were normalized using the median sequencing depth ) before the calculation of the abundances of the retrieved taxa, creating heatmaps of the most abundant sequences, the determination of the ZOTU richness, and the ordination plots. The latter were created using the non-metric multidimensional scaling and Bray-Curtis dissimilarity index.
Finally, tables of the summarized reads, recovered from each taxon and all taxa in total, comparisons of sample means, and the relative abundance table were created (suppl. data S2). To evaluate the possible influence of factors such as DESS treatment, different primer combination use, and the method of the DNA extraction on the obtained number of reads, the PERMANOVA tests were performed, using the lmPerm (Wheeler and Torchiano, 2025) package in R. Based on whether the reads were derived from a sample that was DESS-treated or untreated, an amplification of the 18S or 28S rDNA and the “CD” or the “Q” DNA extraction, eight possible treatment combinations were established, with three replicates each. Prior to running the PERMANOVA tests, the reads were transformed by dividing the number of reads designated to the taxon by the specific number of nematodes placed in samples (as specified in Table 1 and the suppl. data S2). The untransformed data were used only for the total read PERMANOVA analyses. The default 5,000 permutations were used for all tests. The test for indication of significant differences between the eight treatments, as well the combinations of four and two treatments, was performed for the taxa that were present in both the sets (see the first 9 taxa in Table 1) and for the total amount of reads obtained for all taxa together. This test aimed to check for joint and separate influence of the three applied factors (DESS preservative treatment, primers, and isolation) on the number of the obtained reads (results are given in Table 3A). Five additional tests were performed for each taxon separately that was present either in the Set 1 (DESS-treated) or Set 2 (fresh) and for the total amount of reads obtained for all taxa together (results are given in Table 3B and 3C, respectively). Significant differences were tested considering either all four treatments, that could correspond to the effects of joint influence of primers and isolation, or two of them in all possible combinations that would correspond with the influence of isolation within the 18S rDNA or the 28S rDNA and the influence of primers where the “CD” or the “Q” method was applied. In some cases, M. hapla, A. ritzemabosi, and M. xenoplax were excluded from the analyses due to the absence of reads for these taxa.
Table 3
PERMANOVA test results for differences in number of reads obtained for various nematode taxa, that were: (A) both, the DESS-treated and DESS-untreated (Fresh), (B) DESS-treated, and (C) DESS-untreated (Fresh)
| A | ||||||||||
|---|---|---|---|---|---|---|---|---|---|---|
| Taxon | DESS-treated and DESS-untreated (Fresh) | |||||||||
| Influence of all factors: preservation, primers, and isolation | Joint influence of preservation and isolation | Joint influence of preservation and primers | Influence of preservation | |||||||
| All treatments | 18S treatments | 28S treatments | CD treatments | Q treatments | 18S/CD treatments | 18S/Q treatments | 28S/CD treatments | 28S/Q treatments | ||
| 1 | M. hapla | <2.2 × 10⁻¹⁶*** | <2.2 × 10⁻¹⁶*** | 2 × 10⁻⁴*** | <2.2 × 10⁻¹⁶*** | <2.2 × 10⁻¹⁶*** | 0.001389** | 0.001389** | 0.1 | 1 |
| 2 | A. ritzemabosi | <2.2 × 10⁻¹⁶*** | <2.2 × 10⁻¹⁶*** | <2.2 × 10⁻¹⁶*** | <2.2 × 10⁻¹⁶*** | 2 × 10⁻⁴*** | 0.001389** | 0.001389** | 1 | 1 |
| 3 | Acrobeles sp. | <2.2 × 10⁻¹⁶*** | <2.2 × 10⁻¹⁶*** | <2.2 × 10⁻¹⁶*** | 0.0082** | 6 × 10⁻⁴*** | 0.7014 | 0.001389** | 0.3014 | 0.001389** |
| 4 | Anaplectus sp. | <2.2 × 10⁻¹⁶*** | 8 × 10⁻⁴*** | 6 × 10⁻⁴*** | 0.003** | <2.2 × 10⁻¹⁶*** | 0.001389** | 0.2014 | 0.001389** | 0.8014 |
| 5 | R. uniformis | <2.2 × 10⁻¹⁶*** | <2.2 × 10⁻¹⁶*** | <2.2 × 10⁻¹⁶*** | <2.2 × 10⁻¹⁶*** | 0.006** | 0.001389** | 0.001389** | 0.001389** | 0.001389** |
| 6 | Helicotylenchus sp. | <2.2 × 10⁻¹⁶*** | 0.0172* | <2.2 × 10⁻¹⁶*** | <2.2 × 10⁻¹⁶*** | <2.2 × 10⁻¹⁶*** | 0.001389** | 0.001389** | 0.001389** | 0.001389** |
| 7 | Qudsianematidae | <2.2 × 10⁻¹⁶*** | 0.0012** | 6 × 10⁻⁴*** | 0.0034** | 2 × 10⁻⁴*** | 0.001389** | 0.001389** | 0.001389** | 0.1014 |
| 8 | Longidorus sp. | 0.0036** | 0.0018** | 0.0044** | 0.0078** | 0.0102* | 0.5014 | 0.7014 | 0.2014 | 0.5014 |
| 9 | M. xenoplax | <2.2 × 10⁻¹⁶*** | 0.002** | 0.0034** | 2 × 10⁻⁴*** | 0.011* | 0.001389** | 0.4 | 0.001389** | 0.001389** |
| Total | <2.2 × 10⁻¹⁶*** | 0.0048** | 0.0048** | <2.2 × 10⁻¹⁶*** | 2 × 10⁻⁴*** | 0.001389** | 0.2014 | 0.4014 | 0.1014 | |
| B | ||||||
|---|---|---|---|---|---|---|
| Taxon | DESS-treated | |||||
| Joint influence of primers and isolation | Influence of isolation | Influence of primers | ||||
| All treatments | 18S treatments | 28S treatments | CD treatments | Q treatments | ||
| 1 | M. hapla | 0.005** | 0.1014 | NRO | 0.001389** | 0.001389** |
| 2 | A. ritzemabosi | 4 × 10⁻⁴*** | 0.001389** | NRO | 0.001389** | 0.001389** |
| 3 | Acrobeles sp. | 0.003** | 0.001389** | 0.001389** | 0.9014 | 0.5014 |
| 4 | Anaplectus sp. | <2.2 × 10⁻¹⁶*** | 0.001389** | 0.1014 | 0.4014 | 0.001389** |
| 5 | R. uniformis | 0.001*** | 0.001389** | 0.001389** | 0.001389** | 0.001389** |
| 6 | Helicotylenchus sp. | 4 × 10⁻⁴*** | 0.001389** | 0.001389** | 0.001389** | 0.001389** |
| 7 | Qudsianematidae | 4 × 10⁻⁴*** | 0.001389** | 0.001389** | 0.6014 | 0.001389** |
| 8 | Longidorus sp. | 2 × 10⁻⁴*** | 0.001389** | 0.001389** | 0.001389** | 0.2014 |
| 9 | M. xenoplax | NRO | NRO | NRO | NRO | NRO |
| 10 | P. projectus | 6 × 10⁻⁴*** | 0.001389** | 0.001389** | 0.1014 | 0.001389** |
| 11 | Tylenchorhynchus sp. | 0.0014** | 0.1014 | 0.3014 | 0.1014 | 0.001389** |
| 12 | T. arenicola | 0.8061 | 0.7014 | 0.3014 | 0.5014 | 0.4014 |
| 13 | Plectus sp. | 2 × 10⁻⁴*** | 0.001389** | 0.5014 | 0.001389** | 0.001389** |
| 14 | Aporcelaimidae | 0.0088** | 0.3014 | 0.2014 | 0.5014 | 0.9014 |
| 15 | T. auriculatus | 0.0054** | 0.9014 | 0.9014 | 0.001389** | 0.001389** |
| 16 | C. parvus | 0.002** | 0.001389** | 0.001389** | 0.5014 | 0.4014 |
| Total | 8 × 10⁻⁴*** | 0.6014 | 0.001389** | 0.001389** | 0.001389** | |
| C | ||||||
|---|---|---|---|---|---|---|
| Taxon | DESS-untreated (Fresh) | |||||
| Joint influence of primers and isolation | Influence of isolation | Influence of primers | ||||
| All treatments | 18S treatments | 28S treatments | CD treatments | Q treatments | ||
| 1 | M. hapla | 0.0036** | 0.3014 | 1 | 0.001389** | 0.001389** |
| 2 | A. ritzemabosi | <2.2 × 10⁻¹⁶*** | 0.001389** | 1 | 0.001389** | 0.001389** |
| 3 | Acrobeles sp. | <2.2 × 10⁻¹⁶*** | 0.001389** | 0.001389** | 0.001389** | 0.3014 |
| 4 | Anaplectus sp. | 8 × 10⁻⁴*** | 0.001389** | 0.001389** | 0.5014 | 0.001389** |
| 5 | R. uniformis | <2.2 × 10⁻¹⁶*** | 0.001389** | 0.001389** | 0.001389** | 0.001389** |
| 6 | Helicotylenchus sp. | <2.2 × 10⁻¹⁶*** | 0.001389** | 0.8014 | 0.001389** | 0.001389** |
| 7 | Qudsianematidae | 0.0064** | 0.1014 | 0.7014 | 0.6014 | 0.001389** |
| 8 | Longidorus sp. | 0.0014** | 0.1014 | 0.001389** | 0.9014 | 0.5014 |
| 9 | M. xenoplax | 4 × 10⁻⁴*** | 0.001389** | 0.001389** | 0.001389** | 0.2014 |
| 17 | H. pseudorobustus | <2.2 × 10⁻¹⁶*** | 0.001389** | 0.3014 | 0.001389** | 0.001389** |
| 18 | Pratylenchus sp. | 0.0024** | 0.001389** | 0.001389** | 0.4014 | 0.001389** |
| 19 | P. pachydermus | <2.2 × 10⁻¹⁶*** | 0.001389** | 0.001389** | 0.001389** | 0.6014 |
| 20 | R. goodeyi | <2.2 × 10⁻¹⁶*** | 0.001389** | 0.001389** | 0.001389** | 0.001389** |
| 21 | G. longus | <2.2 × 10⁻¹⁶*** | 0.001389** | 0.001389** | 0.4014 | 0.2014 |
| 22 | Alaimidae | 6 × 10⁻⁴*** | 0.001389** | 0.001389** | 0.5014 | 0.001389** |
| 23 | D. major | <2.2 × 10⁻¹⁶*** | 0.001389** | 0.001389** | 0.001389** | 0.1014 |
| 24 | M. brachyuris | <2.2 × 10⁻¹⁶*** | 0.001389** | 0.001389** | 0.001389** | 0.001389** |
| Total | <2.2 × 10⁻¹⁶*** | 0.001389** | 0.4014 | 0.001389** | 0.001389** | |
Various treatments were defined and compared (see suppl. data S2), which may indicate joined and separate influence of three investigated factors: preservation (DESS treatment), primers (18S or 28S rDNA), and isolation method (“CD” or “Q”). Statistical significance codes: 0 “***”, 0.001 “**”, 0.01 “*”, NRO: “No reads obtained.” Taxa numeration corresponds with the one of Table 1.
Bioinformatics procedures and the R code are available from the corresponding author upon reasonable request.
2. Results
2.1. Nematode taxa identification and nematode tissue lyses
Twenty-four nematode taxa were chosen for this study (Table 1). Morphological observations, and in some cases, the molecular analyses as well, resulted in the identification of 13 taxa to the species level, 8 to the genus, and the other 3 to the family level.
After the mock samples were composed (Fig. 1, Table 1), the DNA extraction using two different DNA isolation methods (“CD” and “Q”) was performed. Initial observations of tissue breakdown during the lysis step showed that the most difficult individuals to disintegrate were the very large nematodes such as the representatives of Dorylaimida as well as the nematodes with thick cuticular structures (Hoplolaimidae and Criconematidae). Based on the microscopic observations, a slightly stronger digestive effect was observed in the case of the “CD” isolation kit. However, the observations showed that none of the kits guaranteed 100% lysis efficiency of the prepared mixtures of about 300 nematodes after 24 h of incubation in the two tested lysis buffers. The DNA isolations resulted in substantially higher DNA concentrations for the “CD” method (suppl. data S3). Additionally, the results of the performed qPCRs showed that the amplification of rDNA fragments from the samples isolated with the “CD” kit was delayed by about 5–8 cycles in comparison to the samples isolated with the “Q” method, where the Ct values were relatively lower (data not shown).
2.2. Metabarcoding results
Approximately 80,000–100,000 reads were obtained for the 18S rDNA and 40,000–80,000 for the 28S rDNA samples (suppl. data S2; suppl. Fig. S1). The obtained relative abundance for both the 18S and 28S rDNA regions did not exactly reflect the number of individuals put in the samples. The obtained reads for the particular taxa in the tested replicates constituted different fractions of the total amounts (Fig. 2). All the taxa were represented by reads from multiple ZOTUs (Fig. 2; suppl. data S1). Regardless of whether the nematodes were treated with DESS prior to DNA isolation or not, reads were recovered from almost all taxa tested (Fig. 2; suppl. data S1 and S2). Nevertheless, instead of the assumed Qudsianematidae (other than Discolaimus), the current representatives of the Dorylaimidae family (Labronema – 28S rDNA, earlier also in Qudsianematidae; Mesodorylaimus – 18S rDNA; Prodorylaimus – 18S rDNA) were detected (Figs 2 and 3, suppl. data S1). Therefore, they were treated as misidentification, and these reads were counted in as the taxon initially defined as Qudsianematidae for the read summary table (suppl. data S2). Moreover, the reads were not recovered from every genomic region to the same degree. For the five nematode taxa represented in both sets in similar amounts (Table 1), the recovery was usually higher in case of 18S rDNA from fresh nematode samples (Fig. 2; suppl. data S2). The lowest amounts of reads or no detection at all was obtained in case of the 28S rDNA from M. hapla or A. ritzemabosi in the DESS-treated samples (suppl. data S2). M. xenoplax was not detected from any of the samples where only four individuals of this species were placed. In fresh samples where 20 M. xenoplax were included, this species was detected in most of the samples (suppl. data S2). The strongest read recovery in comparison to other taxa was obtained from large-sized nematodes of the order Dorylaimida (e.g. identified as Aporcelaimellus, Labronema, Longidorus, Mesodorylaimus, and Sectonema), even with only few of them present in the sample, especially in the DESS-treated samples (Fig. 3; suppl. data S2). However, the number of reads obtained for some taxa showed an association with the method of DNA isolation. For example, the recovery from thick-sheathed nematodes such as Mesocriconema or Rotylenchus was stronger in the samples isolated with the “CD” kit (suppl. data S2) than in the ones isolated with the Q method. The “CD” method recovered more than expected reads of Longidorus, Mylonchulus, or Paratylenchus, while Acrobeles, Alaimidae, Anaplectus, Aporcelaimidae, Coomansus, Discolaimus, Geocenamus, or Paratrichodorus were recovered better with the “Q” method. At the same time, the mean overall number of reads for the samples isolated with the “CD” and “Q” methods remained close; however, in most cases, slightly higher for the “Q” method: ∼97,000 vs ∼95,000 (18S rDNA, DESS-treated), ∼57,000 vs 70,000 (28S rDNA, DESS-treated), 85,000 vs 90,000 (18S rDNA, fresh), and 53,000 vs 58,000 (28S rDNA, fresh). False positive reads were recorded for four taxa: Aporcelaimidae, Discolaimus major, Paratrichodorus pachydermus, and Tylenchorhynchus sp. (suppl. data S2).
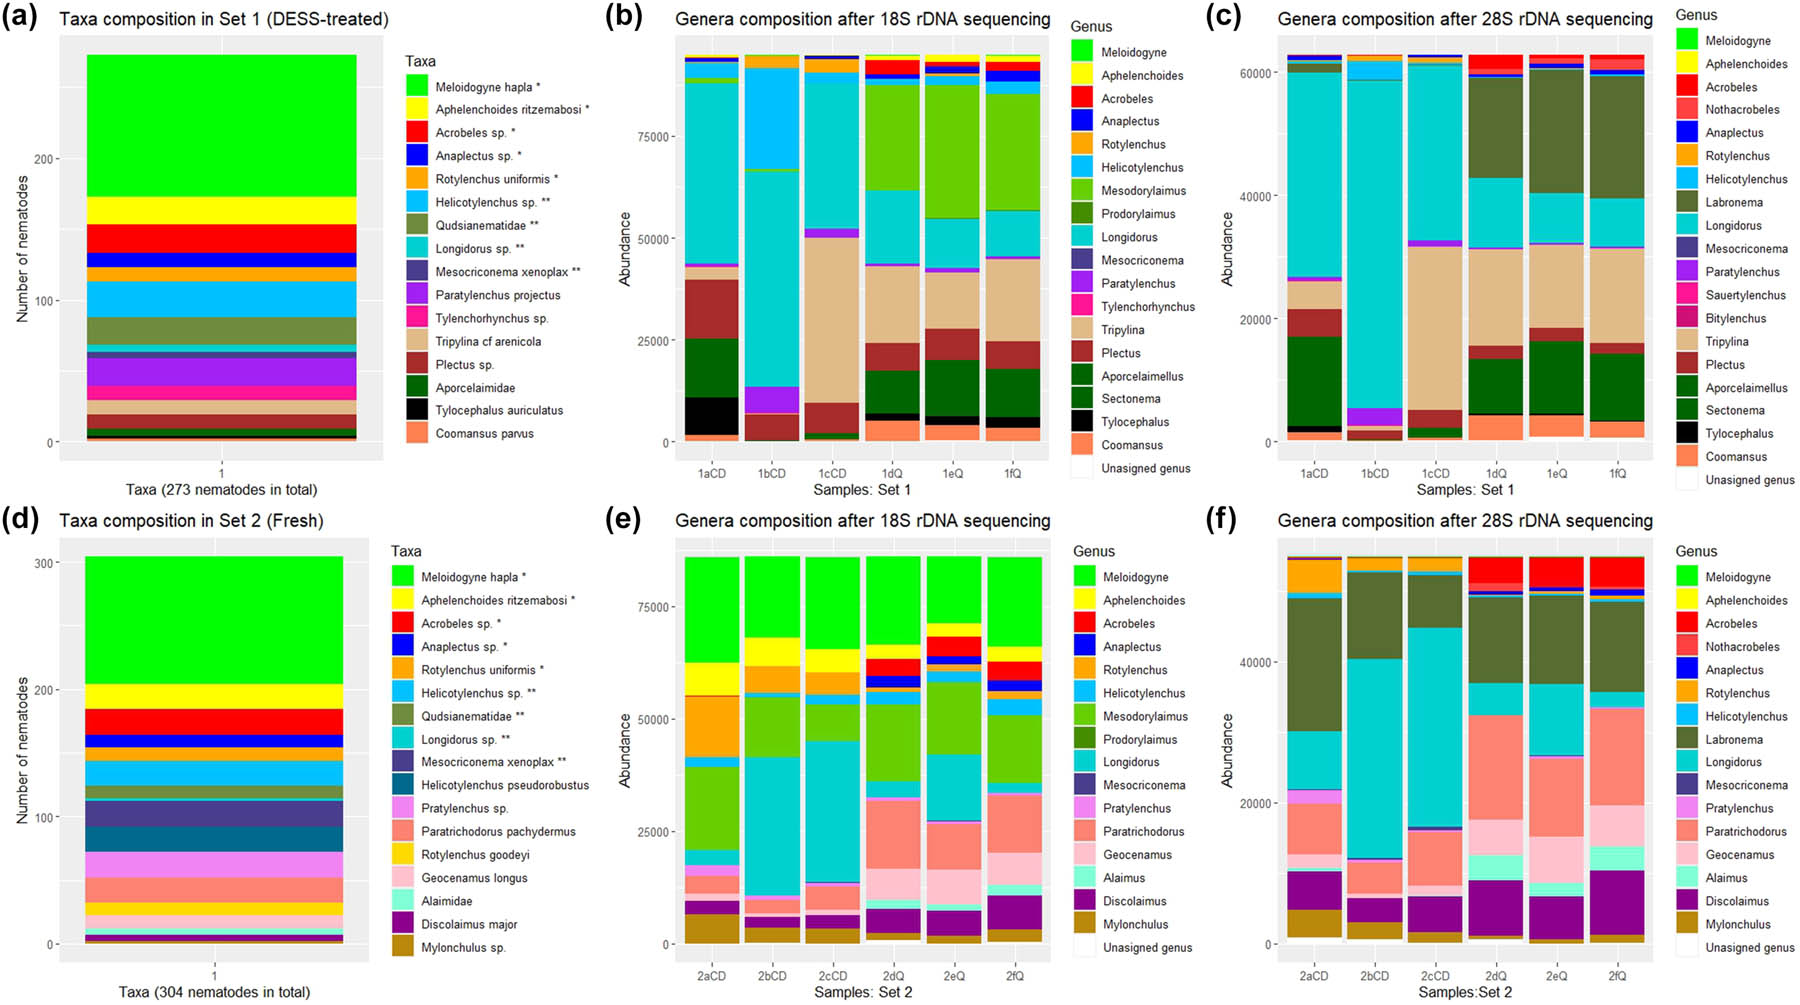
Figure 2
Taxa abundance and composition in two mock nematode community sets. (a–c) Set 1, DESS-pretreated nematodes. (d–f) Set 2, DESS-untreated, freshly extracted nematodes. (a) Exact numbers of nematode taxa included in the samples 1aCD-1cCD and 1dQ-1fQ. (d) Exact numbers of nematode taxa, included into the samples 2aCD-2cCD and 2dQ-2fQ. Taxa initially occurring in the two nematode community sets in the same amounts (Table 1) are marked with an asterisk. Taxa occurring in the two nematode community sets in the different amounts are marked with two asterisks. (b and e) Read numbers and retrieved genera after 18S rDNA sequencing. (c and f) Read numbers and retrieved genera after 28S rDNA sequencing. The obtained false-positive reads were not included into the visualization and the corresponding data are available in the suppl. data S1. “CD” and “Q” samples were isolated with the Clear Detection or Qiagen DNA extraction kits, respectively.
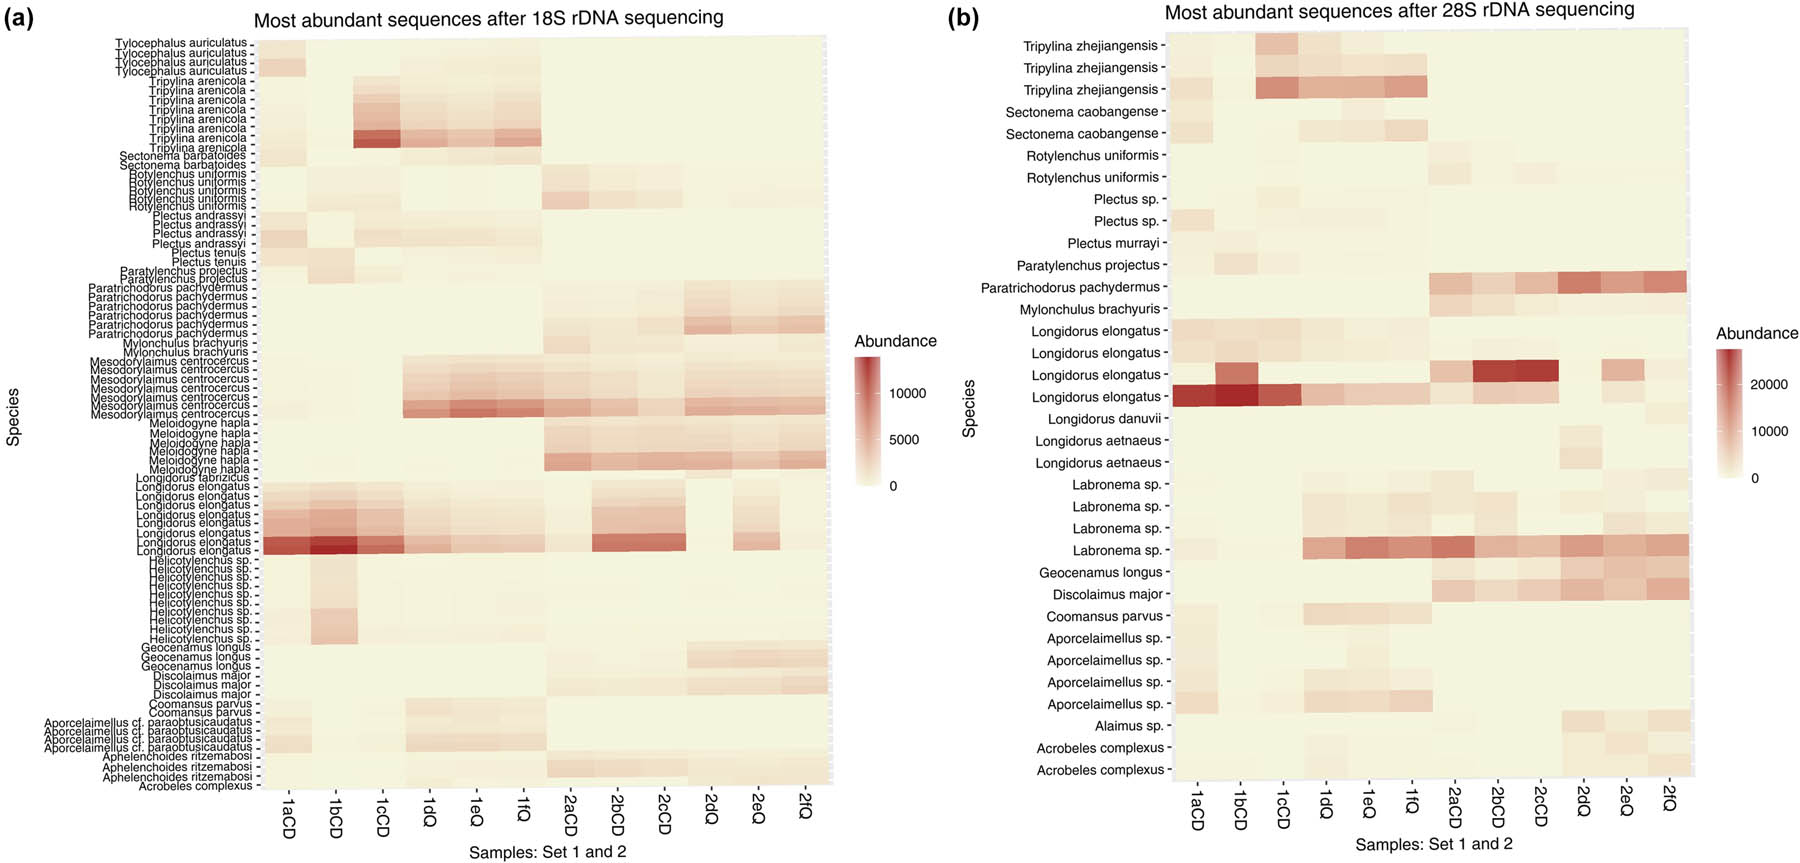
Figure 3
Heatmaps of the most abundant sequences obtained after metabarcoding sequencing of sample replicates (a–f), representing two mock nematode communities (Sets 1 and 2), isolated with two DNA extraction kits (“CD” and “Q”). (a) Most abundant nematode species sequences after 18S rDNA sequencing. (b) Most abundant nematode species sequences after 28S rDNA sequencing.
The total 18S and 28S rDNA sequence (ZOTUs) richness among the 12 analysed samples, representing the two analysed sets of species (and preservation), was estimated with Chao1 and Shannon indices (Fig. 4). The latter balances richness with evenness. The obtained alpha diversity measures were similar for the samples representing the two sets. Mean Chao1 values for 18S rDNA were: 189.33 (Set 1 isolated with “CD”), 293.48 (Set 1 isolated with “Q”), 238.13 (Set 2 isolated with “CD”), and 299.93 (Set 2 isolated with “Q”); and for 28S rDNA: 85.57, 142.69, 67.67, and 200.25, respectively. Correspondingly, mean Shannon values for 18S rDNA were: 3.53, 4.15, 4.04, and 4.37; and for 28S rDNA: 2.15, 2.78, 2.23, and 2.46. However, the sequence diversity (ZOTUs richness) was generally lower in case of the 28S rDNA data and was strongly influenced by the extraction method, in both the 18S and the 28S rDNA. The samples isolated with the Q method exhibited higher diversity and more uniform results among the three replicates. This was also confirmed with the ordination analysis of the particular samples (suppl. Fig. S1).
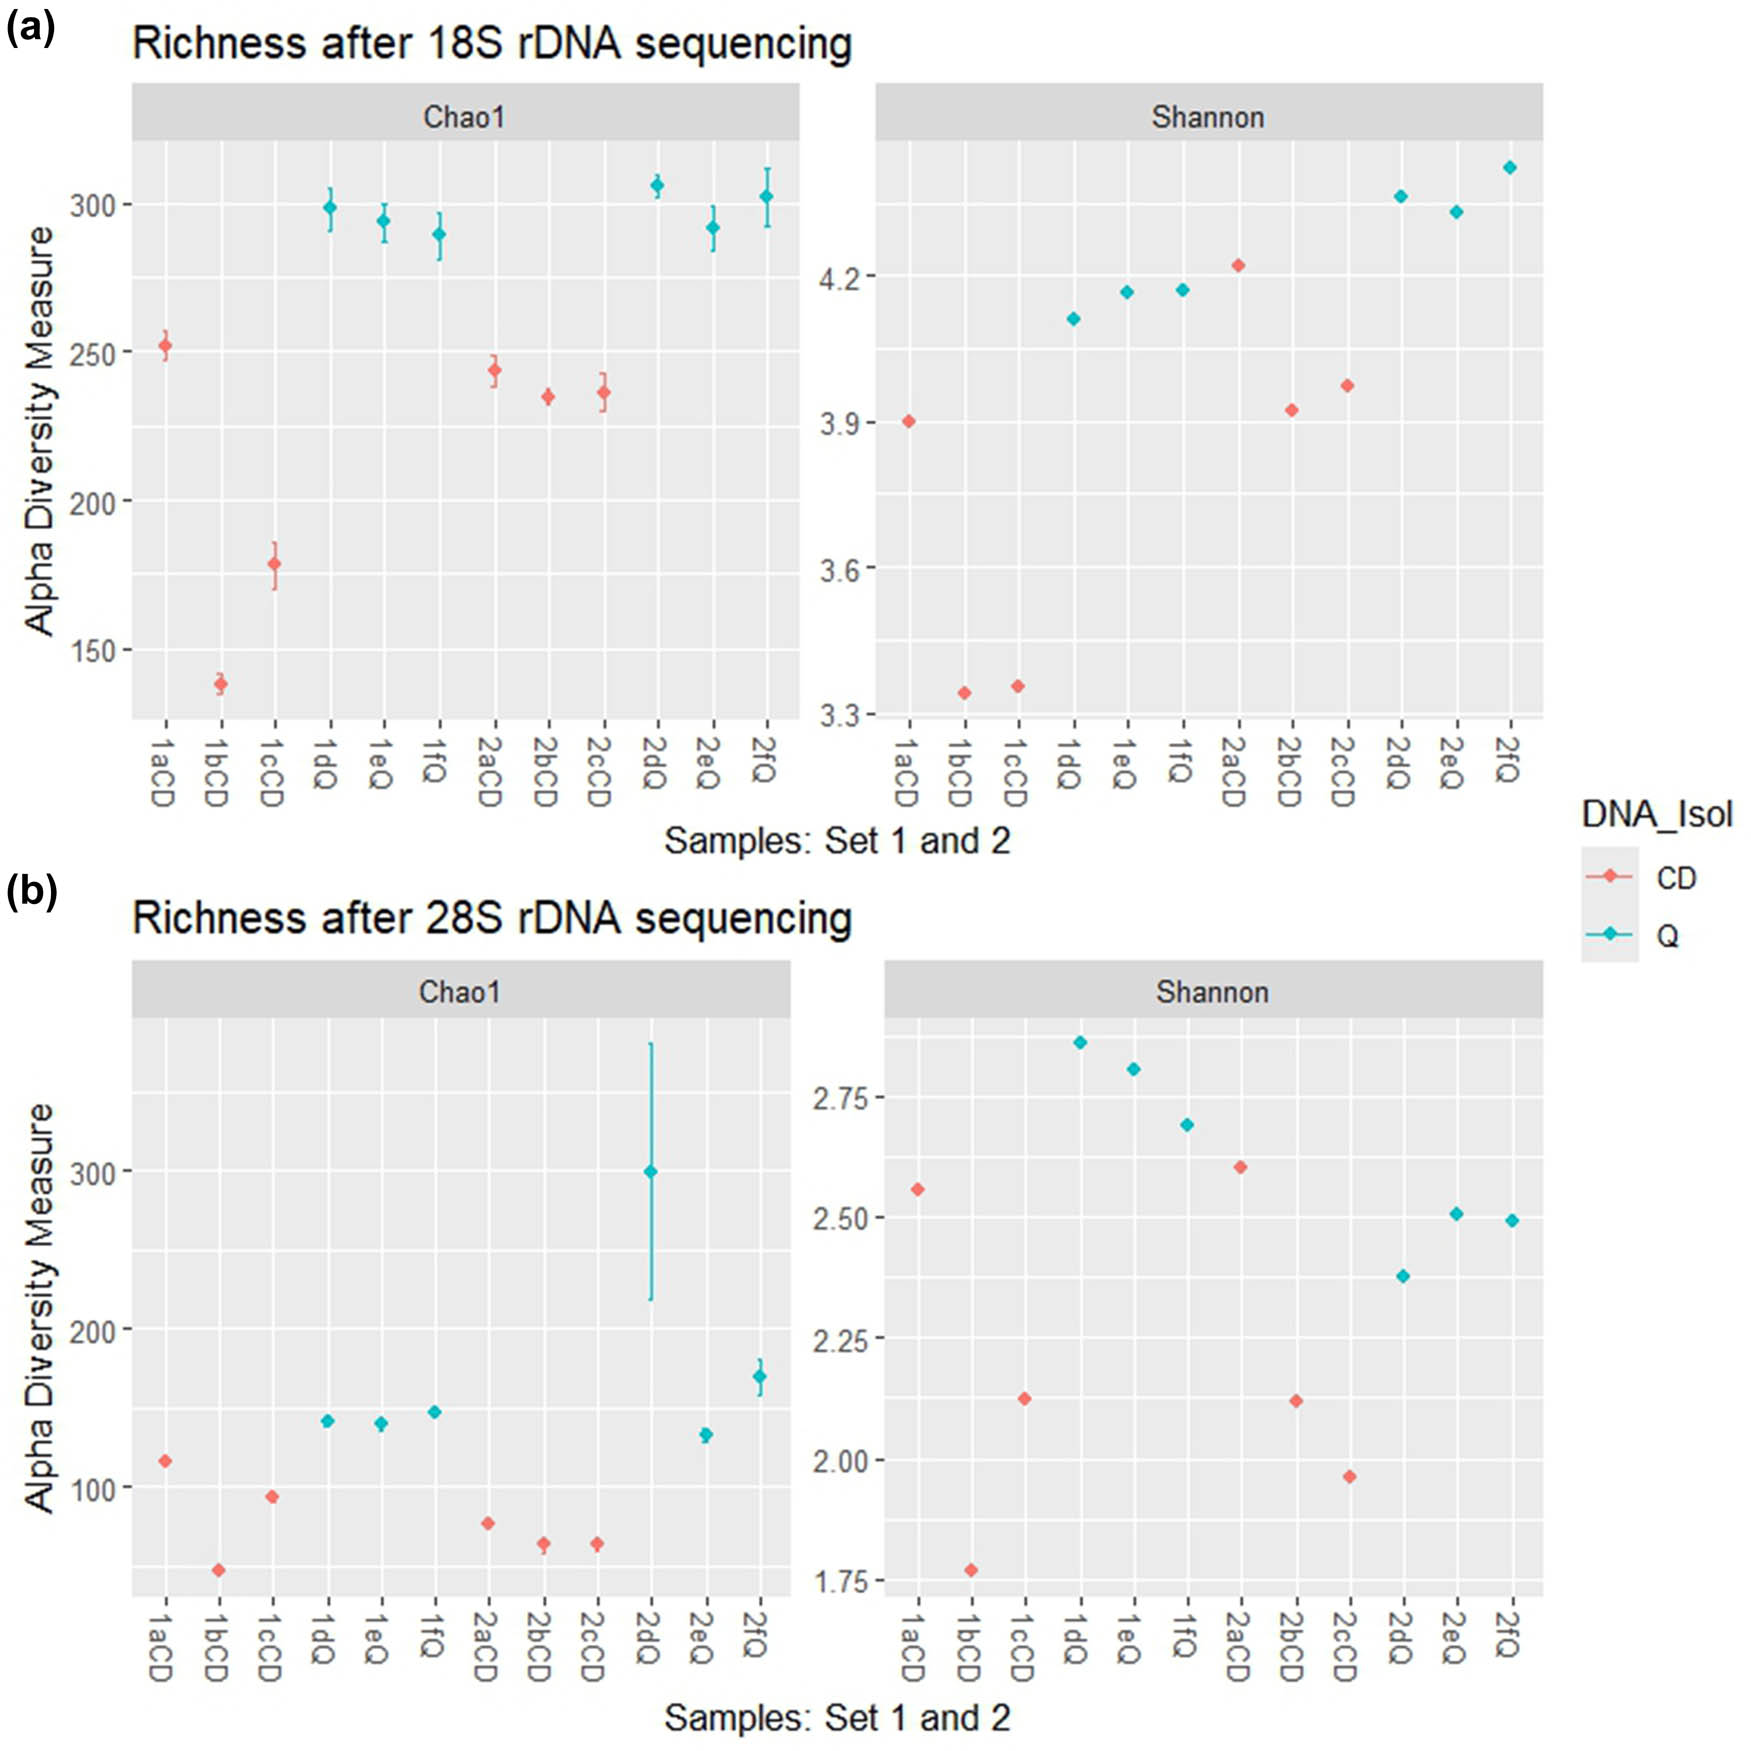
Figure 4
ZOTUs richness estimated with Chao1 and Shannon indices obtained after 18S (a) and 28S rDNA (b) metabarcoding sequencing of sample replicates (a–f), representing two mock nematode communities (Sets 1 and 2), isolated with two DNA extraction kits (“CD” and “Q”).
The reads obtained for each taxon separately and for all taxa together (the total amount) were used for PERMANOVA tests (suppl. data S2; Table 3). Combinations of up to eight treatments, with three replicates each, were tested to examine joint or separate effects of: DESS preservative treatment, primers used, and the isolation method applied. Consequently, the obtained statistically significant results of the PERMANOVA tests indicate significant differences between the tested treatments, suggesting possible influences of the tested factors on the retrieved amounts of reads.
The initial PERMANOVA tests performed for each of the nine taxa, that were included in both of the prepared sets, indicated significant differences among the eight and four treatment groups (Table 3A; suppl. data S2). This suggests the joint influence of preservation and isolation method, preservation and primers, and all three of these factors on the read abundance. However, for the main effect of the DESS preservation, some of the tests did not indicate significant differences for all taxa except the representatives of Hoplolaimdae (Helicotylenchus sp. and R. uniformis).
PERMANOVA tests performed on the reads obtained from the taxa derived from the DESS-treated Set 1, indicated a significant difference in at least one among the five treatment groups for all the taxa except for T. arenicola (Table 3B). Significant results that might indicate the influence of the isolation method were observed for all taxa except: Aporcelaimidae, M. hapla, T. arenicola, T. auriculatus, and Tylenchorhynchus, in case of the amplification with the 18S rDNA primers, and Acrobeles sp., C. parvus, Helicotylenchus sp., Longidorus sp., P. projectus, Qudsianematidae, and R. uniformis, in case of the amplification with the 28S rDNA primers. The results indicating the type of primer combination used might have had an influence on the reads obtained for A. ritzemabosi, Helicotylenchus sp., Longidorus sp., M. hapla, Plectus sp., R. uniformis, and T. auriculatus when DNA was extracted using the “CD” method, and for all taxa except: Aporcelaimidae, Acrobeles, C. parvus, Longidorus sp., and T. arenicola, when “Q” extraction method was used.
PERMANOVA tests performed on the reads obtained from the taxa of Set 2 mock community samples indicated a significant difference in at least one among the five treatment groups for all of the taxa. For the 18S marker treatments, no differences were found between the isolation method region only as far as M. hapla, Longidorus sp., and Qudsianematidae are concerned. Likewise, for the 28S marker, no differences were found between the isolation methods for A. ritzemabosi, Helicotylenchus, H. pseudorobustus, M. hapla, and Qudsianematidae. When “CD” method was used for the extraction, the marker used had no influence on Alaimidae, Anaplectus sp., G. longus, Longidorus sp., Pratylenchus sp., and Qudsianematidae. For mock community samples extracted using the “Q” method, Acrobeles, D. major, G. longus, Longidorus, M. xenoplax, and P. pachydermus were the taxa for which the marker region used for the amplification had no effect at all.
3. Discussion
The aim of this study was to investigate the recovery of various groups of soil nematodes from two, DESS-treated and -untreated, artificially composed nematode communities. It is important to note that in this work, a particular emphasis was put into acquisition of most versatile representation of soil nematodes as some of the earlier metabarcoding research performed on mock nematode community samples were biased towards taxa more easily maintained in laboratory conditions (i.e. Aphelenchoididae, Cephalobidae, Diplogastridae, Plectidae, Rhabditidae) (Porazinska et al. 2009; Waeyenberge et al. 2019). They excluded some of the frequently occurring soil dwellers, such as predaceous nematodes, other free-living species, or plant parasites of minor economic concern, although cosmopolitan in nature, like representatives of the family Hoplolaimidae (other than Hoplolaimus) for instance, which have previously been shown to be difficult to recover in sequence reads in metabarcoding studies (Geisen et al., 2018). Such biased composition of calibration samples does not sufficiently reflect the potential soil nematode biodiversity. The importance of a proper taxonomic coverage was already highlighted in the study by Ahmed et al. (2019) and the importance of using known species communities in metabarcoding analyses in the study by Hilário et al (2023).
Although not to the same degree for every treatment, all the taxa analysed in this study were successfully recovered, with unexpected appearance of some false positive reads (suppl. data S2). The obtained false positive reads of Discolaimus major and of Aporcelaimidae could be the result of some of the Dorylaimida individuals misidentification during the preparation of the mock samples, which was before the taxa were properly identified on microscopic slides, or a result of erroneous identification in the reference database. Another explanation, especially for the few false positive reads of Paratrichodorus pachydermus and Tylenchorhynchus sp. could include predaceous nematode unidentified gut content or relic DNA (extracellular DNA; i.e. Carini et al., 2017; Rodriguez-Martinez et al., 2023) that was impossible to detect during the morphological studies. However, the introduction of the relic DNA was minimalized in this study by using only nematode individuals directly extracted from soil (and also subsequently washed from the DESS preservative) prior to the DNA isolation (details in the study by Hayden et al. 2025). The false positive reads as well as the observed discrepancies between morphological and molecular abundance could also be a result of technical problems like unspecific primer annealing during PCR amplifications or tag jumping during library preparation (Rodriguez-Martinez et al., 2023). Other factors influencing differences in the obtained reads might include partial degradation of tissue and DNA during mock sample preparation or mistakes in morphological evaluations caused by variations in sex and life stages of the collected individuals. Moreover, an intragenomic variation of rDNA could play a role in obtaining the more sequence variants of the 18S rDNA than the 28S rDNA per particular taxa (i.e. Rodriguez-Martinez et al., 2023). Nevertheless, most importantly, read abundance is dependent on community composition, DNA concentration, and marker (Hilário et al. 2023), as well as on database selection (Hayden et al. 2025) and filtering parameters (Drake et al., 2022).
The first hypothesis formulated for this work, assuming greater read recovery from the fresh nematode diversity than from the DESS-treated nematodes, was partially supported by the obtained results. Our findings show that the metabarcoding approach can be successfully applied for environmental samples stored in this preservative as all the taxa preserved in DESS (Set 1), for minimum a year prior to the DNA extraction, were successfully recovered and that this recovery could result in much lower total read abundance compared to the fresh nematodes (Fig. 2, suppl. data S2). Nevertheless, the mean read abundance obtained for the taxa included in both the sets did not decrease equally (and did not decrease at all in some cases for Acrobeles sp., Anaplectus sp., and Helicotylenchus sp.) for the DESS-treated samples. Therefore, the DESS preservative can be preferably used for a qualitative species assessment. Additionally, the PERMANOVA tests confirmed the possible influence of the DESS treatment on read retrieval for all the taxa that were placed in both sets, especially on the representatives of the family Hoplolaimidae (Table 3A). However, the preservation treatment did not influence Longidorus sp., sequences of which were found among the most abundant in most samples (Fig. 3). This might be an effect of the more than sufficient number of nematode individuals (reaching the minimum required biomass) of this taxon included in the samples. The biomass effect and the predominance of reads from large body sized nematodes were also noted and discussed by Hayden et al. (2025). This is especially interesting as our observations showed that the largest nematodes were not necessarily completely degraded during the lysis step and on the other hand, the most abundant M. hapla, was barely recovered, except the fresh nematode set after the 18S sequencing (Fig. 2; suppl. data S2).
There is a paucity of information on the influence of the DESS (Yoder et al., 2006) fixation on the recovery of nematode taxa in metabarcoding studies. However, the application of DESS was recommended in the review concerning metabarcoding of marine communities by van der Loos and Nijland (2021), especially to replace sample preservation in ethanol. So far, only the marine (Macheriotou et al., 2019) and soil nematodes studies on the very specific compost environments by Zapałowska et al. (2023) reported the use of the DESS preservation step prior to metabarcoding analyses. Nevertheless, the authors do not provide information about how long the samples were stored in the preservative before the DNA isolation and they do not discuss the possible effect of this preservative on the recovery of the nematode communities.
The second hypothesis of this study concerned no substantial differences in taxa read recovery between samples extracted with the “Nematode DNA extraction & purification kit for nematode suspensions and multiple cysts” (the “CD” method) and the DNeasy Blood and Tissue Kit (the “Q” method). As expected, both of the DNA isolation kits recovered reads from all tested nematode taxa, even those introduced in small numbers (two individuals). However, the ZOTU richness was greater for the samples isolated with the “Q” method with more uniform results among the replicates and from fresh nematodes to resemble the original sample the most (Figs 2 and 4). The more variable results obtained for the replicates extracted with the “CD” method could be related to the modifications applied to the isolation protocol (refer Section 1) or the differences in the obtained DNA concentrations after DNA isolation (suppl. data S3). Therefore, the use of this method for the metabarcoding purposes should be further optimized.
We confirm and recommend the practical use of the slightly modified “Q” method for metabarcoding. However, it should be noted that the “CD” and “Q” methods might have different effects on some particular nematode groups (suppl. data S2). This could be associated with nematode anatomy, including the cuticle structure and should be investigated further. The weak performance of the “Q” method on taxa of rigid cuticle structures such as Criconema, Mesocriconema or with a very small (0.2–0.5 m) body size, closely related Paratylenchus, was already shown by Waeyenberge et al. (2019) and Ahmed et al. (2019). These results were confirmed in our study showing poor recovery of M. xenoplax and P. projectus when the “Q” isolation method was used. However, unlike in the case of previous studies (Waeyenberge et al., 2019; Ahmed et al., 2019), the reads from those species were also obtained using the “Q” method, albeit in much lower numbers. These might be associated with the amounts of the nematode individuals present in the investigated sample. Waeyenberge et al. (2019) used 10 Mesocriconema sp. individuals per sample while 1 individual of Criconema sp. (and 1) was used by Ahmed et al. (2019). In this study, 4 M. xenoplax were used in the DESS-treated samples and 20 in case of the fresh set. None of the two isolation methods recovered M. xenoplax sequence reads when few individuals were used in samples. Both methods recovered reads when 20 individuals were used in the sample, although the “CD” method resulted in a higher number of reads (suppl. data S2). Therefore, a detectable threshold value, represented as the minimal number of nematode representatives in a sample (minimum biomass needed), may differ for each species and DNA isolation method. For instance, the representatives of Coomansus parvus, Longidorus sp., Mylonchulus brachyuris, and Tylocephalus auriculatus of which only two representatives were included in the samples, were successfully recovered. This might be connected to their size or cuticle permeability. The PERMANOVA test results indicated that the differences in the isolation methods between the tested samples had a significant effect for half of the tested taxa (suppl. data S2), including Acrobeles sp., R. uniformis, M. xenoplax, P. projectus, and others. For the rest of the species, the test results were not statistically significant for at least one combination of the treatments. The isolation method used did not seem to have any significant effect on the total amount of reads either.
Our last hypothesis assumed that combining amplifications of the 18S and 28S rDNA sequences would yield higher taxa diversity and allow for better taxa resolution than using sequences from either marker alone. So far, many 18S rDNA primer combinations have been tested, optimized, and analysed for the study of soil nematode biodiversity (Sapkota and Nicolaisen 2015; Peham et al., 2017; Waeyenberge et al., 2019; Ahmed et al., 2019; Skider et al., 2020; Kawanobe et al., 2021; Ficetola et al., 2024). Based on its good performance, we chose the NemFopt/18Sr2bRopt (Waeyenberge et al., 2019) primer combination, targeting the 18S rDNA region, for our study. The D2A/D3B primer combination developed by Nunn (1992) is probably the most frequently used one for the amplification of the partial 28S rDNA region in nematodes. The resulting DNA fragment is approximately 700 bp. So far, in the nematode metabarcoding research, the D3B reverse primer was used in a combination with the universal forward primer D3A, which gives a product of about 300 bp (Porazinska et al., 2009; Ahmed et al., 2019; Zapałowska et al., 2023). To obtain a slightly longer sequence that would allow for more sequence variability and consequently to obtain better taxonomic resolution, we decided to use the reverse version of the D3A primer, proposed by Chombard et al. (1998) under the name D2, and combine it with the Nunn’s D2A primer. Thus, the amplified PCR product constituted the more upstream part of the 28S rDNA region and was approximately 400 bp. Using both primer combinations (Table 2), we managed to recover all the tested taxa from the prepared mock community samples. In this study, we confirm the practical use of the NemFopt/18Sr2bRopt (Waeyenberge et al., 2019) on the wider range of taxa and recommend the D2A/D2 28S rDNA-based primer pair as alternative to the D3A/D3B pair, targeting a longer part of the 28S rDNA region. The PERMANOVA significant test results suggested that the NemFopt/18Sr2bRopt or the D2A/D2 primer pair use had the potential influence on the total read abundances (Table 3B and C). However, when the tests were performed for particular taxa, the statistically significant results were obtained for approximately 50–70% of the cases. The number of the obtained reads provided indication of the difference in the recovery of the different taxa, while the analysis of the two targeted DNA regions allowed for their more precise identification, which confirms our hypothesis. While most metabarcoding studies employ only the amplification of the 18S rDNA region, the advantage of additional use (or preference) of the 28S rDNA is the recovery of sequences from a more variable molecular region, which allows for a better taxa resolution. In other words, it is more useful in identifying taxa at lower taxonomic ranks: to the genus and species levels. For instance, our initial morphological studies indicated the presence of two different Pratylenchus species. Although the ZOTUs richness was generally higher for the obtained 18S rDNA data (Fig. 4) and consequently, a BLASTn search of some of the obtained 18S rDNA sequences indicated the similarity to five different Pratylenchus species: P. capsici, P. crenatus, P. fallax (99%), P. neglectus (99–100%), and P. penetrans (99–100%), the obtained 28S rDNA sequences allowed us to narrow them down and matched with two species: P. flakkensis (99–100%) and P. neglectus (99–100%). Moreover, despite the initial morphological identification of Qudsianematidae, the 18S rDNA sequencing revealed the presence of Mesodorylaimus and Prodorylaimus (Dorylaimidae) in the investigated samples, while the 28SrDNA indicated for Labronema (Dorylaimidae, earlier also in Qudsianematidae), confirming that 18S rDNA marker (and especially of such shorth length) does not have sufficient resolution for describing many representatives of Dorylaimida (refer Holterman et al., 2008). This is especially important in regard to the limitation of the amplicon length as well as to the database. Some species are represented only by 18S rDNA or only the 28S rDNA sequence data, others are still not represented at all. This suggests that the process of transitioning from DNA-based identification from barcoding individual species to metabarcoding of entire communities will remain reliant on morphological studies and on sequencing single nematode individuals for the identification of new or not yet molecularly characterized species.
4. Conclusion
Our findings contribute to a better understanding and analyses of the results of metabarcoding experiments conducted on soil nematode communities and demonstrate that these experiments can be performed on material preserved in DESS. To obtain a better resolution and more accurate identification of the constituent taxa, the use of both the NemFopt/18Sr2bRopt and the D2A/D2 primer pair (for the first time used in a metabarcoding study), targeting the 18S and the 28S rDNA regions, respectively, are recommended. Each of the isolation methods tested might influence the number of reads recovered for the constituent taxa differently.
Acknowledgements
The authors wish to acknowledge the help of M. Sc. Magdalena Kubicz (molecular) and Dr. Łukasz Flis (morphological) in the nematode identification process and the technical support of M. Sc. Grzegorz Sikora. The authors wish to thank Dr. Aneta Chałańska (NEFscience) for providing samples of A. ritzemabosi, Dr. Łukasz Flis for M. hapla samples and Dr. Ewa Dmowska for soil samples from Dziekanów Leśny. The authors also acknowledge Dr. Oleksandr Holovachov for providing the computing resource for data analysis, particularly with USEARCH.
Funding information
The presented studies were supported by the grant from the National Science Centre (Poland): 2019/03/X/NZ8/00220.
Author contributions
The presented research was designed and largely performed by KRM who accordingly: acquired soil samples, sorted out extracted nematode material, composed artificial nematode community samples, performed molecular laboratory procedures (DNA extractions and observations of the tissue degradation, rDNA amplifications for NGS sequencing and optimization of qPCRs), statistically analyzed the metabarcoding data, prepared the first and following drafts of the manuscript. MA performed the bioinformatic data analyzes and contributed to the preparation of the manuscript. GW identified nematode taxa, supervised the identifications made by KRM and revised the manuscript. All authors read and approved the final manuscript.
Conflict of interest statement
Authors state no conflict of interest.