
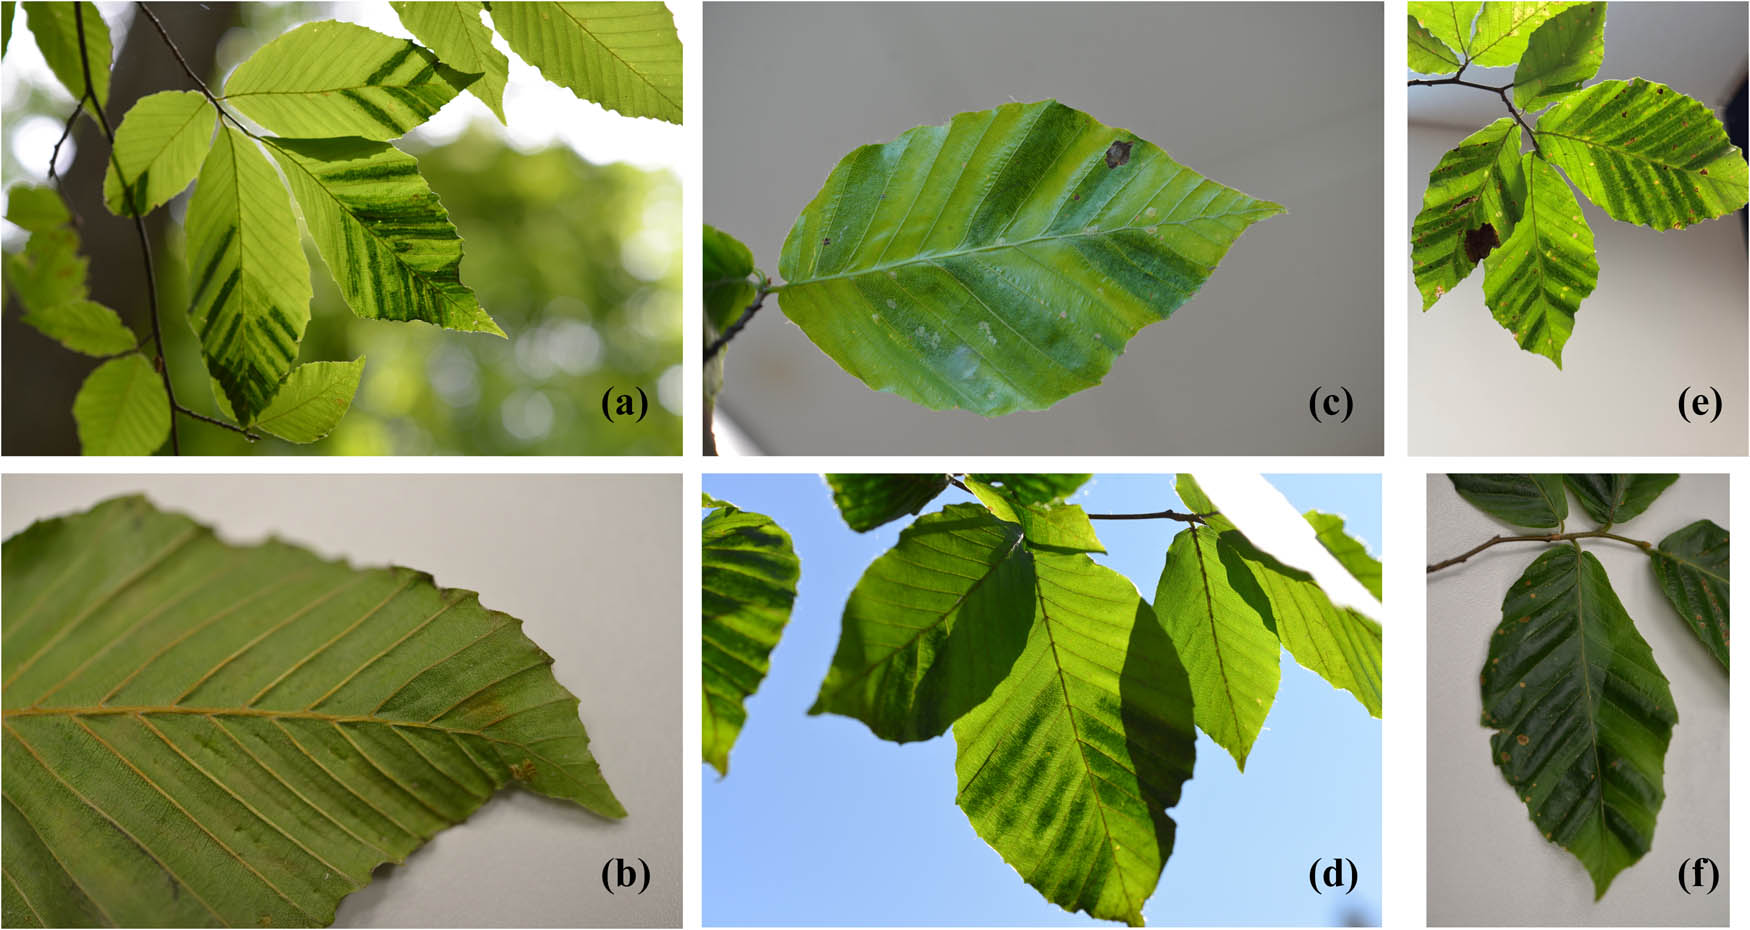
Figure 1
Image examples from beech leaf disease (BLD) Dataset I displaying various banding symptoms across multiple environments. (a) BLD symptomatic leaves in the forest imaged with a digital camera. (b) Abaxial surface of the BLD leaf imaged in the laboratory with a digital camera. (c) BLD leaf in the laboratory imaged with a digital camera. (d) BLD leaves detached from a tree outdoors imaged with a digital camera. (e) BLD leaves in the laboratory imaged with a smartphone. (f) BLD leaves imaged on the laboratory bench with a digital camera.
Table 1
Dataset I test evaluation metrics of EfficientNetV2-S, InceptionV3, MobileNetV3-L, and ResNet50 pre-trained convolutional neural network models trained to distinguish leaves symptomatic and asymptomatic for beech leaf disease.
| Model | Accuracy | Precision | Recall | F1 | AUC–ROC |
|---|---|---|---|---|---|
| EfficientNetV2-S | 100 | 100 | 100 | 100 | 100 |
| InceptionV3 | 94.88 | 93.33 | 94.12 | 93.72 | 99.17 |
| MobileNetV3-L | 97.95 | 98.29 | 96.64 | 97.46 | 99.88 |
| ResNet50 | 99.32 | 100 | 98.32 | 99.15 | 99.99 |
All values are percent (%).
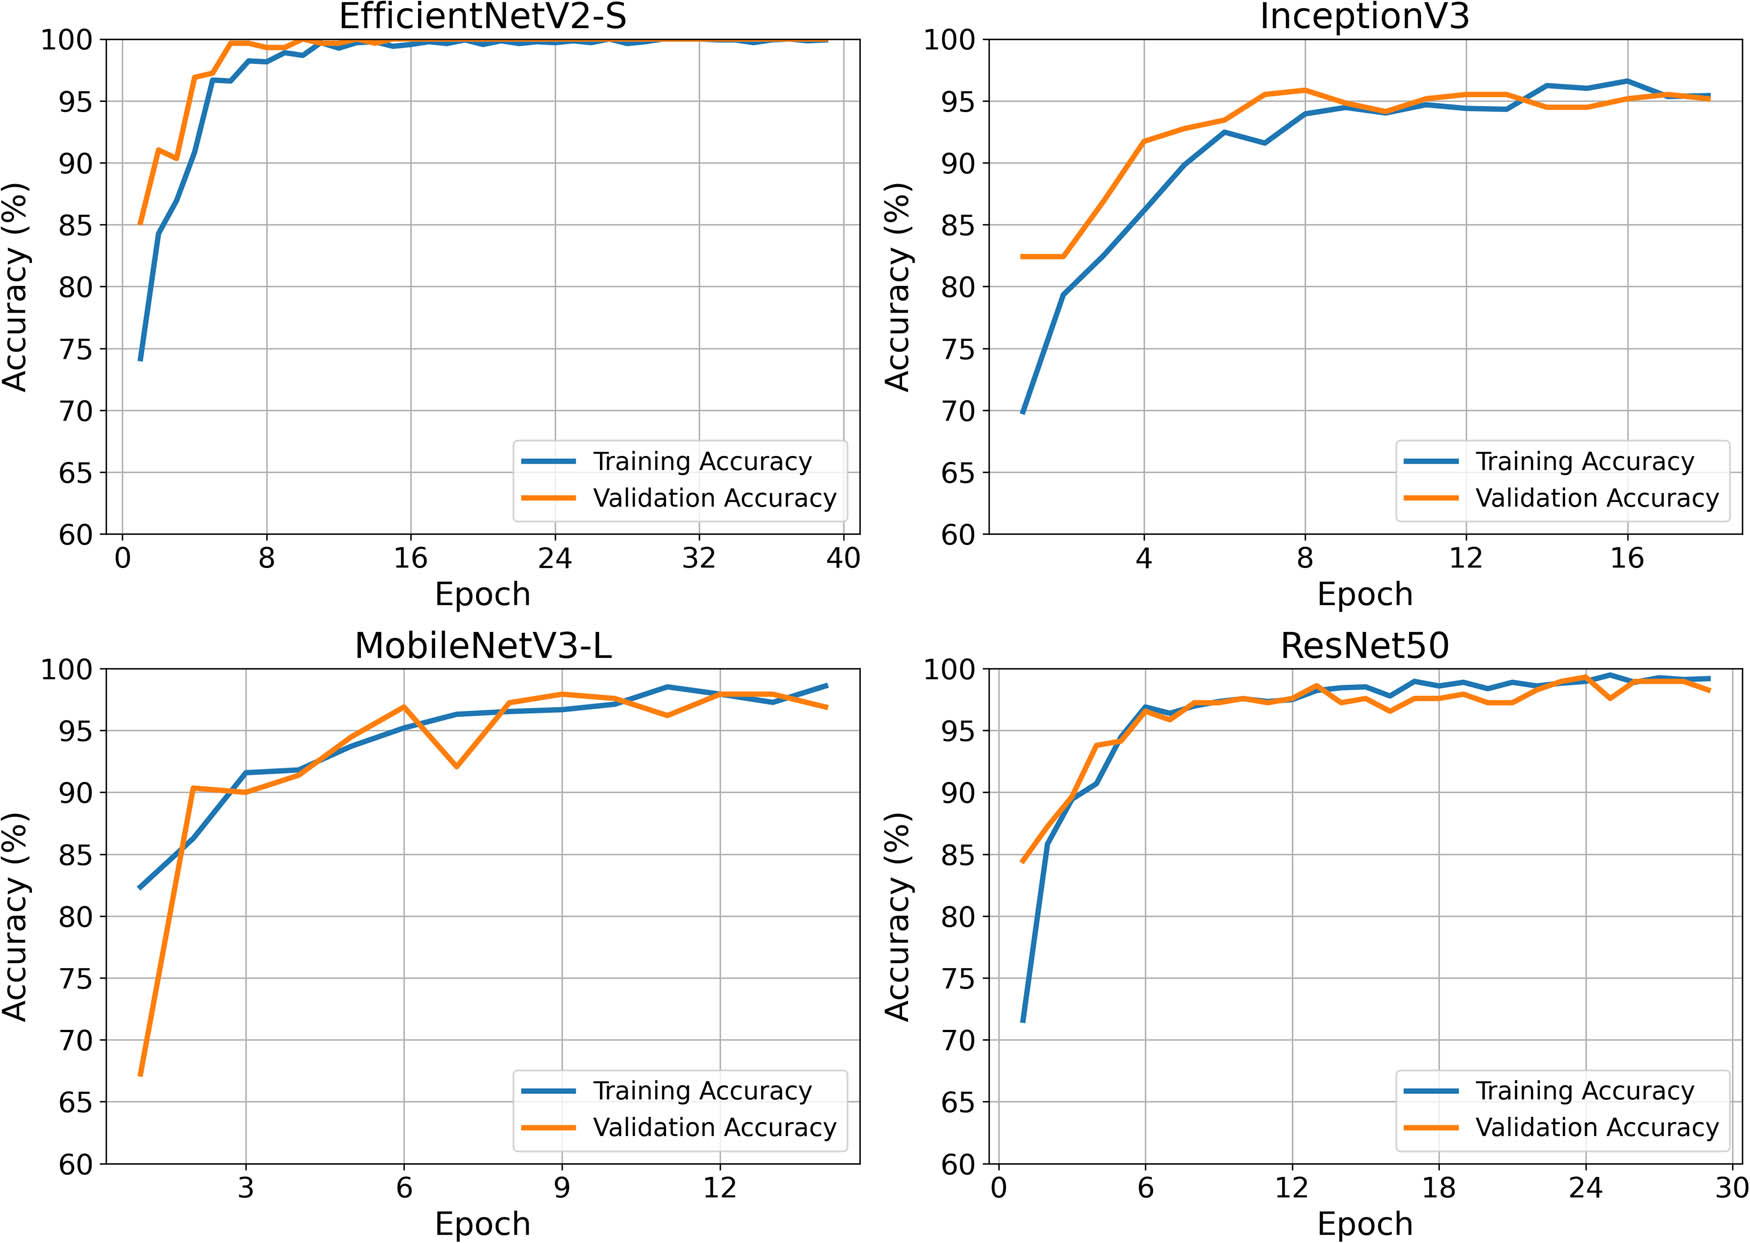
Figure 2
Training and validation accuracy of EfficientNetV2-S, InceptionV3, MobileNetV3-L, and ResNet50 models at distinguishing leaves with beech leaf disease and without beech leaf disease.
Table 2
Dataset II test evaluation metrics of EfficientNetV2-S, InceptionV3, MobileNetV3-L, and ResNet50 pre-trained convolutional neural network models trained to distinguish leaves symptomatic and asymptomatic for beech leaf disease.
| Model | Accuracy | Precision | Recall | F1 | AUC–ROC |
|---|---|---|---|---|---|
| EfficientNetV2-S | 96.55 | 91.84 | 100 | 95.74 | 99.87 |
| InceptionV3 | 86.21 | 93.94 | 68.89 | 79.49 | 96.28 |
| MobileNetV3-L | 87.93 | 84.44 | 84.44 | 84.44 | 93.93 |
| ResNet50 | 85.34 | 76.92 | 88.89 | 82.47 | 93.80 |
All values are percent (%).
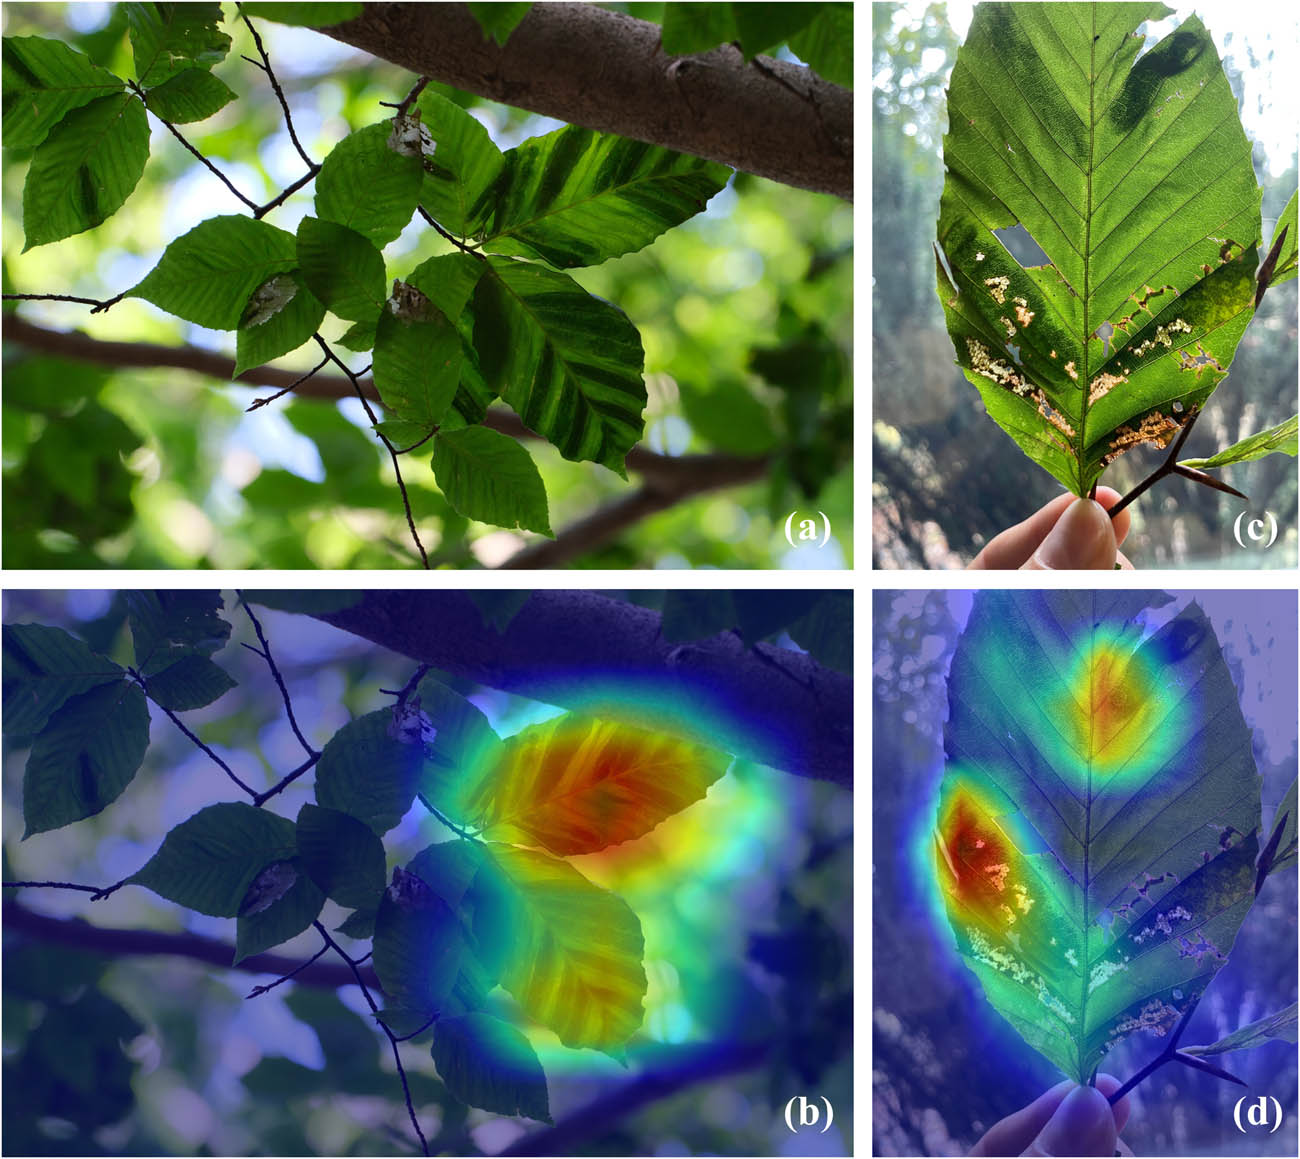
Figure 3
Heatmaps of discriminative regions for top-performing model EfficientNetV2-S at detecting beech leaf disease symptoms on Dataset II images. Heatmap generated with Gradient-weighted Class Activation Mapping (Grad-CAM). (a) An image collected in a forest and (b) its corresponding Grad-CAM heat map visualization. (c) A representative image of a detached leaf and (d) the associated Grad-CAM visualization. Red areas are strongly discriminative, and blue areas are weakly discriminative.