
Beech leaf disease (BLD) is an emerging concern in forests in the eastern United States and Canada (Ewing et al., 2019). This disease is caused by a new invasive foliar nematode, Litylenchus crenatae (family Anguinidae), originally described from Japan (Kanzaki et al., 2019; Carta et al., 2020). Since its first detection in Ohio in 2012, BLD has spread rapidly to at least 16 U.S. states and Ontario, Canada (Ewing et al., 2019; Martin, 2026). This rapid geographic spread represents a significant threat to American beech (Fagus grandifolia), a dominant and ecologically important forest species throughout North America (Burke et al., 2020). Several non-native beech species commonly planted in landscapes and arboreta, including European beech (F. sylvatica), Chinese beech (F. engleriana), and Oriental beech (F. orientalis), have also been shown to be highly susceptible to BLD, raising concerns about potential impacts should the disease reach their native ranges (Burke et al., 2020; Borden et al., 2025; Colbert-Pitts et al., 2025).
Beech leaf disease symptoms first appear as dark banding running along secondary veins in leaves that emerge in the spring, resulting from abnormal cell division induced by L. crenatae activity within developing buds the previous fall (Ewing et al., 2019; Vieira et al., 2023). Symptom severity varies widely, from a few narrow bands to extensive banding covering more than two-thirds of the leaf (Ewing et al., 2019; Carta et al., 2020). The severity of these symptoms is closely associated with the level of nematode infestation within developing buds. Heavily infested leaves exhibit more pronounced disease manifestations, including abnormal crinkling, deformation, and overall distortion of normal leaf structure (Ewing et al., 2019; Carta et al., 2020; Reed et al., 2020; Fearer et al., 2022; Vieira et al., 2023). As the disease progresses over successive years, repeated bud abortion leads to canopy thinning, physiological decline, and ultimately tree mortality (Reed et al., 2020; Reed et al., 2022; Shepherd et al., 2025; McIntire and Vieira, 2025).
One of the primary challenges associated with BLD is the early detection of symptomatic leaves. Although symptoms often become apparent in the lower canopy as the disease becomes established in new localized areas, early signs of symptoms higher in the canopy are more difficult to identify, and diagnosis relies primarily on human visual assessment, which can be hampered by site accessibility and beech density. This method is prone to overlooking early-stage infections or sparsely symptomatic leaves, allowing disease spread to go undetected.
Machine learning has become an important tool for plant health monitoring in both agriculture and forestry (Liakos et al., 2018; Estrada et al., 2023; Amoah-Nuamah et al., 2025). By learning patterns from large datasets, machine learning models can identify complex patterns and generate predictions to support management decisions (Najafabadi et al., 2015; Brodrick et al., 2019; Mahmud et al., 2021). In forest disease detection, most applications have relied on spectral data, which capture physiological stress signals invisible to the human eye (Qin et al., 2021; You et al., 2022; Duarte et al., 2022; Mngadi et al., 2024). Spectral analysis approaches have shown promise; for example, Zhang et al. (2022) detected pine wilt disease with an accuracy exceeding 98%, and in agricultural cropping systems, nematode-induced stress has been detected with accuracies up to 80% in potato cyst nematode infection detection (Santos et al., 2022; Della-Silva et al., 2025; Lapajne et al., 2025). However, spectral data require specialized sensors and calibration, making field development costly and logistically difficult. Additionally, identifying disease-specific signatures for individual hosts is often challenging because spectral signals are inherently complex (Zarco-Tejada et al., 2021; Sapes et al., 2024).
Computer vision offers a practical alternative by enabling models to extract and interpret visual information directly from visible light red, green, blue (RGB) images. Although forest applications are more limited, RGB imagery has been used to detect fungal diseases, insect pests, and pine wilt disease with accuracies up to 99% (Oide et al., 2022; Mngadi et al., 2024). In agriculture, computer vision is widely used for plant, pest, and disease identification and for monitoring crop development and quality (Mavridou et al., 2019; Sharma et al., 2020; Molina-Rotger et al., 2023; Sapkota et al., 2023; Dang et al., 2024). Because BLD produces distinct visible symptoms, image-based machine learning is well-suited for its detection. RGB images are easy to collect with consumer-grade cameras, smartphones, or unmanned aerial vehicles (UAVs), making them scalable for forest managers and citizen scientists and readily deployable in mobile apps, drone workflows, and automated monitoring systems.
As forests face increasing threats from emerging diseases, incorporating machine learning and computer vision into forest health monitoring offers a promising path toward earlier detection and sustainable management. In this study, we evaluated the performance of four common pre-trained deep learning models EfficientNetV2-Small, InceptionV3, MobileNetV3-Large, and ResNet50, for distinguishing between leaves affected by BLD and asymptomatic leaves using a custom image dataset. To our knowledge, this is the first application of convolutional neural networks for BLD symptom detection, demonstrating the potential of image-based machine learning to improve foliar nematode disease diagnostics.
1. Materials and methods
1.1. Dataset
A custom image Dataset I of 1,938 images was collected in Maryland of BLD symptomatic and asymptomatic leaves from American beech trees from May to June 2025. Symptomatic leaf images were collected from a previously confirmed BLD area. Images were collected in a range of conditions to increase data complexity, which included natural beech forest stands, detached leaves photographed within forest environment, and both detached leaves and leaves attached to twigs imaged under laboratory conditions (Fig. 1). For each set of leaves collected, adaxial and abaxial leaf surfaces were imaged. Images were collected using both a digital camera and a smartphone to represent devices commonly available to potential users. Because device type was not expected to strongly influence model performance, images from both sources were combined for model development and evaluation. The digital camera used was a Nikon D600 camera with an image resolution of 24.3 effective megapixels. An AF Nikkor 85 mm ƒ/1.8 G lens was used to take images of leaves in the forest, and an AF Micro-Nikkor 60 mm ƒ/2.8 G lens was used for close-up images in the laboratory. Smartphone images were collected in a laboratory and outdoors, not in a forest, with an Apple iPhone 15 Pro equipped with a triple rear camera system. Lenses included a 48 megapixel wide-angle lens (24 mm equivalent, ƒ/1.78, second-generation sensor-shift optical image stabilization), a 12 megapixel ultra-wide-angle lens (13 mm equivalent, ƒ/2.2, 120° field of view, macro capability), and a 12 megapixel telephoto lens (77 mm equivalent, ƒ/2.8, optical image stabilization, 3× optical zoom).
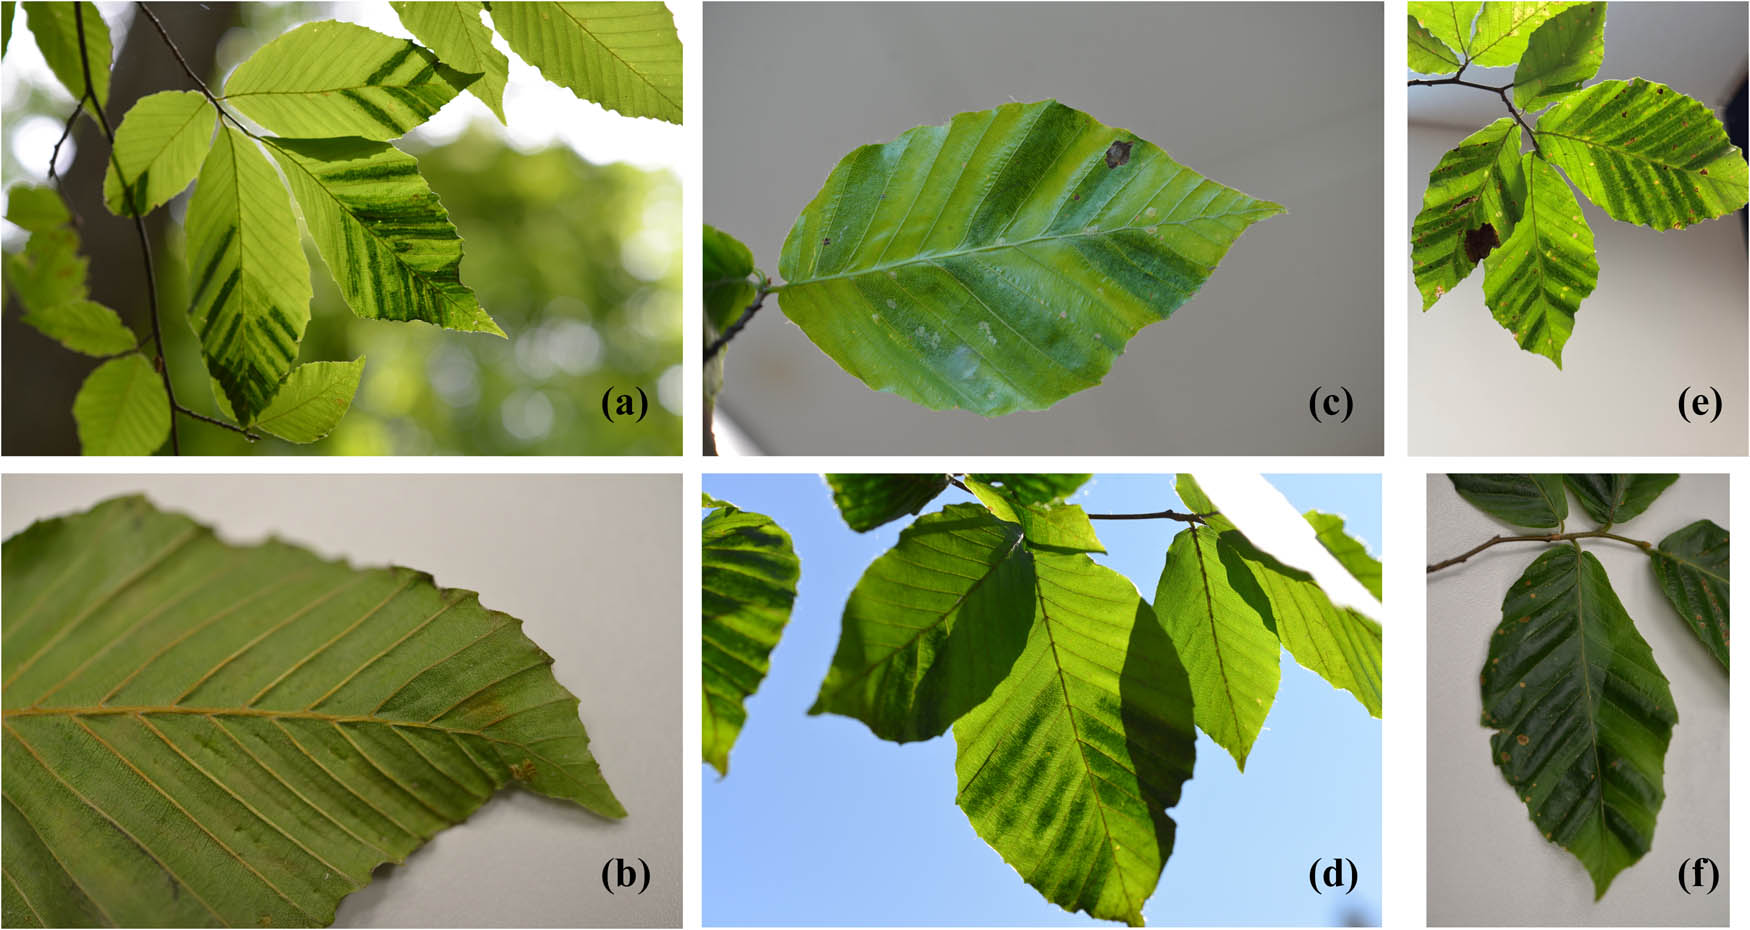
Figure 1
Image examples from beech leaf disease (BLD) Dataset I displaying various banding symptoms across multiple environments. (a) BLD symptomatic leaves in the forest imaged with a digital camera. (b) Abaxial surface of the BLD leaf imaged in the laboratory with a digital camera. (c) BLD leaf in the laboratory imaged with a digital camera. (d) BLD leaves detached from a tree outdoors imaged with a digital camera. (e) BLD leaves in the laboratory imaged with a smartphone. (f) BLD leaves imaged on the laboratory bench with a digital camera.
1.2. Image pre-processing and data augmentation
Collected images were resized based on pre-trained model requirements: 384 × 384 for EfficientNetV2-Small, 299 × 299 for InceptionV3, 224 × 224 for MobileNetV3-Large, and 224 × 224 for ResNet50. In order to increase the size of the dataset, data augmentation was performed on images in the training set. We implemented random resized cropping, random horizontal flipping, random affine transformations, random grayscale conversion, and random adjustments to brightness, contrast, and saturation using Torchvision transforms v2 (https://pytorch.org/vision/stable/transforms.html). The image Dataset I was split 70% for training, 15% for validation, and 15% for testing. Training data were used to teach the model the BLD identification task, validation data were used to monitor performance during training, and test data were held out entirely to provide an independent assessment of final model performance. Supplemental Note 1 contains additional information on dataset preprocessing and augmentation.
1.3. Pre-trained models and training
Pre-trained convolutional neural networks were fine-tuned to distinguish between binary categories (classes) of symptomatic vs. asymptomatic beech leaves. Model architectures used in this study were EfficientNetV2-Small (EfficientNetV2-S), InceptionV3, MobileNetV3-Large (MobileNetV3-L), and ResNet50. Supplemental Note 2 contains further details on the use of pre-trained models through transfer learning and on the model architectures used in this study. Pre-trained default weights were used to tune each model and were imported using Torchvision. Layers prior to the fully connected output layer were kept constant (frozen) for the first three epochs. After three epochs, the backbone was unfrozen to allow updates to the weight and bias parameters. We modified the fully connected output layer in each model to accommodate a binary classification output prediction (symptomatic or asymptomatic) with a sigmoid activation function. The loss function employed for this study was Binary Cross Entropy with logits, and AdamW was selected as the optimizer. Model training was performed using SCINet Atlas high-performance computing on NVIDIA V100 GPU nodes (https://www.hpc.msstate.edu/computing/atlas/).
1.4. Hyperparameter fine-tuning
Model hyperparameters, including progressive layer unfreezing, differential learning rates for backbone and classifier layers, early stopping, and gradient clipping, were fine-tuned to improve model performance. Different learning rates were used for the model backbone and the classification head. The backbone learning rate was lower, initially set at 1 × 10⁻⁴ whereas the classification head layer was initially larger at 1 × 10⁻³. The batch size was 16. Models were each set for training up to a maximum of 100 epochs, with early stopping if the model validation loss did not improve for five consecutive epochs, and gradient clipping was used to prevent exploding gradients. Additional information on hyperparameter fine-tuning used in our study can be found in Supplemental Note 3.
1.5. Model evaluation
Models were evaluated with accuracy, precision, recall, F-score, and receiver operating characteristic–area under the curve (ROC–AUC) (Hanley and McNeil, 1982; Powers, 2011). Accuracy was computed as the number of correct predictions divided by the total number of predictions (equation 1), which provides an overall measure of model performance. Values of 100% indicate all predictions were correct, while values of 0% indicate no predictions were correct.
To further evaluate model performance beyond overall accuracy, we also evaluated precision and recall. Precision measures the proportion of predicted positive samples that are truly positive (equation 2). A precision of 1.0 indicates every sample predicted as positive was correctly identified. This metric is particularly important when false positives carry a high cost and can aid in determining if a model has learned or is making the same prediction for every sample. Recall, also known as true positive rate, measures the proportion of actual positive samples that were correctly identified (equation 3). A recall value of 1.0 indicates all the positive cases were detected, making this metric valuable when missing true positives (disease) is of concern.
F1-score combines precision and recall by calculating their harmonic mean (equation 4). It penalizes models that perform well on one metric, but poorly on the other. An F1 score of 1.0 indicates perfect precision and recall, whereas a score of 0.0 indicates complete failure to identify positive cases. ROC–AUC summarizes the ability of a model to discriminate between positive and negative classes (Hanley and McNeil, 1982). A value of 1.0 indicates perfect discrimination, 0.5 reflects performance equivalent to random guessing, and 0.0 indicates the model is wrong for every prediction.
1.6. Additional dataset II
An additional dataset was collected to further validate model results, referred to as Dataset II. Beech leaf disease images were collected from infested forests in New England and Ohio using both a digital camera and a smartphone, along with non-BLD samples collected from a BLD-naïve region of North Carolina of American beech and European beech (Fagus sylvatica) trees using a digital camera. Digital camera images were collected of leaves outdoors in the forest and of detached leaves in outdoor environments using a Fujifilm X-T3 mirrorless interchangeable-lens system with a 26.1 megapixels X-Trans CMOS IV sensor. Lenses included a Fujifilm XF 35 mm f/1.4 R lens, and a Canon 100 mm f/2.8 L IS USM lens mounted on a Fringer EF-FX Pro II converter. Smartphone images were collected in a laboratory and outdoors in a forest using an Apple iPhone 15 Pro equipped with a triple rear camera system, as described in Dataset I collection. To further challenge the model and assess its ability to distinguish BLD from visually similar leaf stress symptoms, 13 images of woolly aphid feeding injury on American beech collected in Maryland using an iPhone 15 Pro were also incorporated into Dataset II. Woolly aphid injury is a common source of misdiagnosis because its foliar injury (chlorotic banding and leaf-edge curling) can resemble early BLD symptoms.
Following training, the top-performing model was further evaluated using gradient-weighted Class Activation Mapping (Grad-CAM) to highlight regions of images that were most influential for predicting BLD symptoms from Dataset II (Selvaraju et al., 2017). This visualization step provided additional interpretability by revealing which foliar features the model relied on during classification. The top-performing model of the study was hosted with Hugging Face Spaces and deployed for public demonstration with a Gradio web application at https://huggingface.co/spaces/bdwaldo/BLD.
2. Results
A total of 1,938 images were collected in Dataset I, with 787 symptomatic and 1,151 asymptomatic images. Training was performed using 1,355 images, validation was performed using 290 images, and 293 images were held out for testing. Across models, EfficientNetV2-S achieved the highest test accuracy (100%), followed by ResNet50 (99.32%), MobileNetV3-L (97.95%), and InceptionV3 (94.88%) (Table 1). Precision values ranged 100% (EfficientNetV2-S) to 93.33% (InceptionV3), and recall scores ranged 100% (EfficientNetV2-S) to 94.12% (InceptionV3) (Table 1). F1 scores were again highest for EfficientNetV2-S (100%) and followed by ResNet50 (99.15%), MobileNetV3-L (97.46%), and InceptionV3 (93.72%). AUC–ROC values were 100% for EfficientNetV2-S, 99.99% for ResNet50, 99.88% for MobileNetV3-L, and 99.17% for InceptionV3 (Table 1).
Table 1
Dataset I test evaluation metrics of EfficientNetV2-S, InceptionV3, MobileNetV3-L, and ResNet50 pre-trained convolutional neural network models trained to distinguish leaves symptomatic and asymptomatic for beech leaf disease.
| Model | Accuracy | Precision | Recall | F1 | AUC–ROC |
|---|---|---|---|---|---|
| EfficientNetV2-S | 100 | 100 | 100 | 100 | 100 |
| InceptionV3 | 94.88 | 93.33 | 94.12 | 93.72 | 99.17 |
| MobileNetV3-L | 97.95 | 98.29 | 96.64 | 97.46 | 99.88 |
| ResNet50 | 99.32 | 100 | 98.32 | 99.15 | 99.99 |
All values are percent (%).
Early stopping was used to determine model convergence. Accuracy plotted across epochs showed that MobileNetV3-L converged the fastest at epoch 14 with an accuracy of 99.67% (Fig. 2). InceptionV3 converged next at 18 epochs with an accuracy of 99.36% while ResNet50 and EfficientNetV2-S converged at 29 and 39 epochs with accuracies of 99.92 and 100%, respectively.
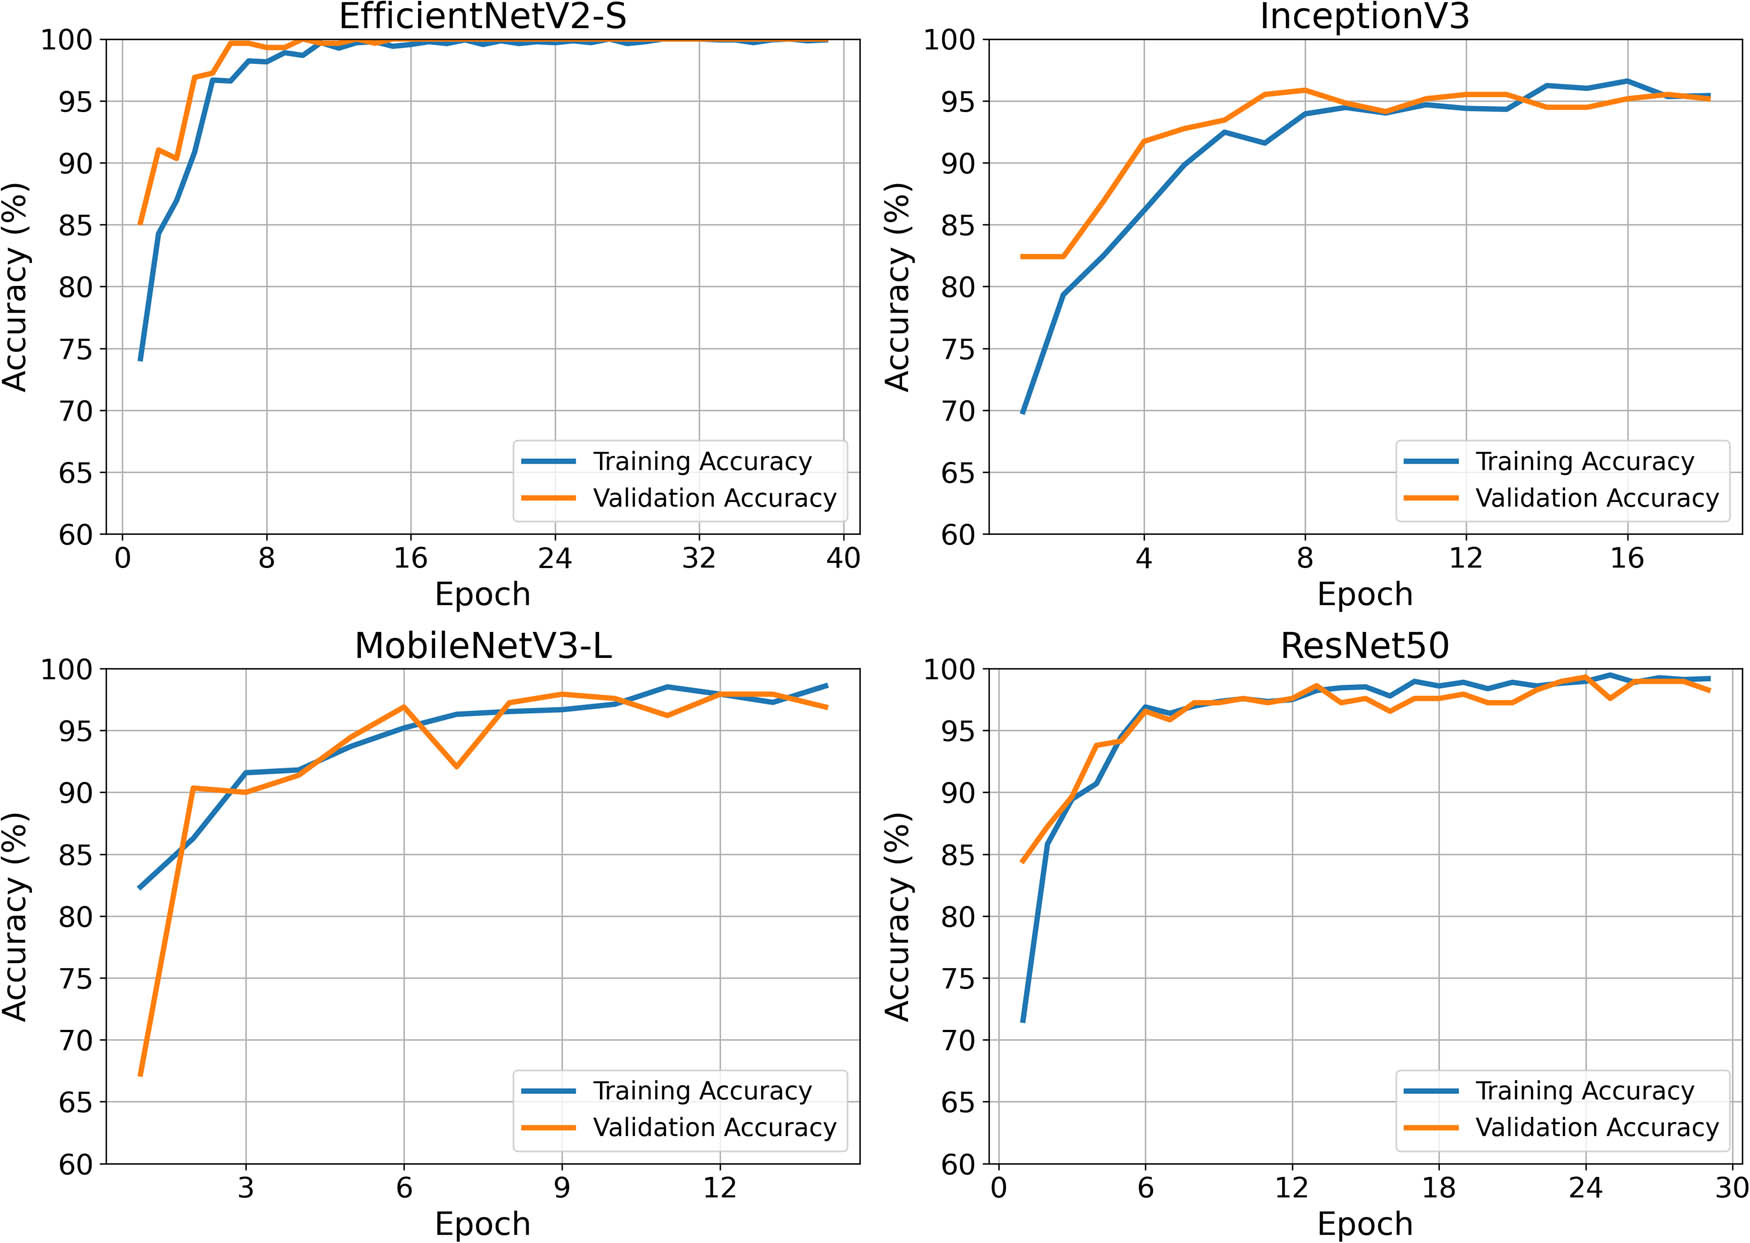
Figure 2
Training and validation accuracy of EfficientNetV2-S, InceptionV3, MobileNetV3-L, and ResNet50 models at distinguishing leaves with beech leaf disease and without beech leaf disease.
A second dataset (Dataset II) comprised of 117 images (45 BLD symptomatic and 72 No BLD) was used as an additional validation step. Test accuracy was similarly highest for EfficientNetV2-S (96.55%), followed by MobileNetV3-L (87.93%), InceptionV3 (86.21%), and ResNet50 (85.34%) (Table 2). Precision ranged from 93.94% (InceptionV3) to 76.92% (ResNet50) while recall scores ranged 100% (EfficientNetV2-S) to 68.89% (InceptionV3) (Table 2). F1 scores were 95.74% for EfficientNetV2-S, 84.44% for MobileNetV3-L, 82.47% for ResNet50, and 79.49% for InceptionV3 (Table 2). AUC–ROC scores were highest for EfficientNetV2-S (99.87%), followed by InceptionV3 (96.28%), MobileNetV3-L (93.93%), and ResNet50 (93.80%) (Table 2). Gradient-weighted Class Activation Mapping (Grad-CAM) was used to visualize regions of images that were important for predicting BLD symptoms by EfficientNetV2-S from Dataset II validation images (Fig. 3) Red areas in Fig. 3 indicate areas most important for predictions, while blue areas indicate the least important areas.
Table 2
Dataset II test evaluation metrics of EfficientNetV2-S, InceptionV3, MobileNetV3-L, and ResNet50 pre-trained convolutional neural network models trained to distinguish leaves symptomatic and asymptomatic for beech leaf disease.
| Model | Accuracy | Precision | Recall | F1 | AUC–ROC |
|---|---|---|---|---|---|
| EfficientNetV2-S | 96.55 | 91.84 | 100 | 95.74 | 99.87 |
| InceptionV3 | 86.21 | 93.94 | 68.89 | 79.49 | 96.28 |
| MobileNetV3-L | 87.93 | 84.44 | 84.44 | 84.44 | 93.93 |
| ResNet50 | 85.34 | 76.92 | 88.89 | 82.47 | 93.80 |
All values are percent (%).
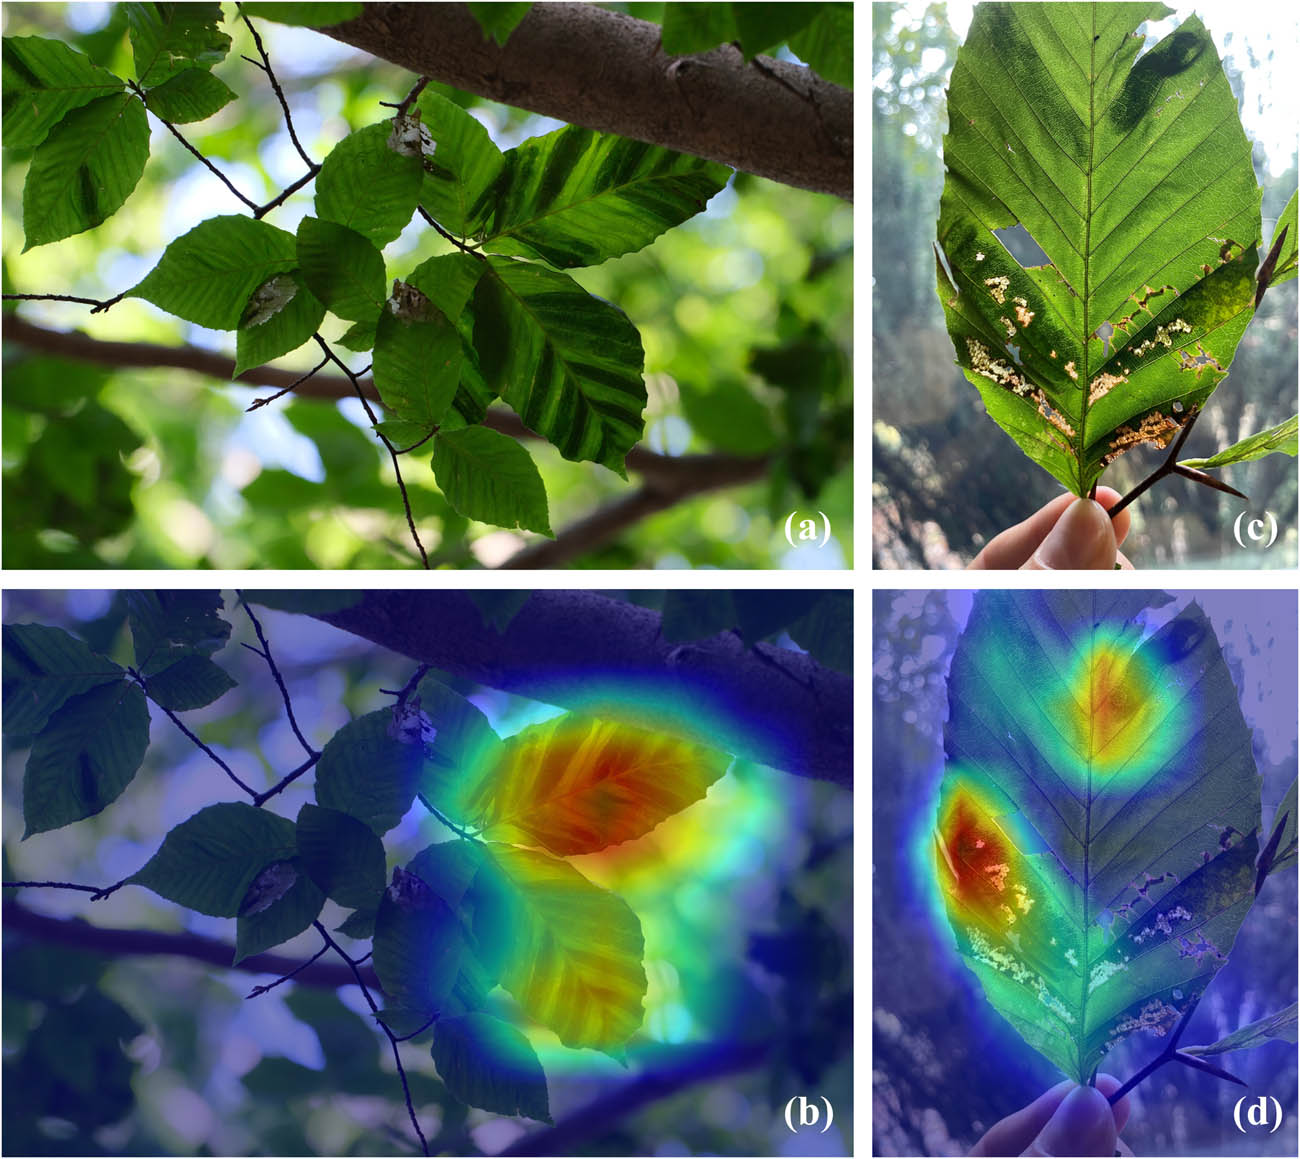
Figure 3
Heatmaps of discriminative regions for top-performing model EfficientNetV2-S at detecting beech leaf disease symptoms on Dataset II images. Heatmap generated with Gradient-weighted Class Activation Mapping (Grad-CAM). (a) An image collected in a forest and (b) its corresponding Grad-CAM heat map visualization. (c) A representative image of a detached leaf and (d) the associated Grad-CAM visualization. Red areas are strongly discriminative, and blue areas are weakly discriminative.
3. Discussion
In this study, we evaluated four pre-trained models, EfficientNetV2-S, InceptionV3, MobileNetV3-L, and ResNet50, for identifying BLD from symptomatic and asymptomatic leaf images using convolutional neural networks. All models distinguished between BLD symptoms from asymptomatic beech leaves with over 94% test accuracy in Dataset I. The dataset generated for the study included leaf images collected both from forest environments and laboratory settings, which incorporated variation in lighting angles and leaf orientations to enhance model generalization. Dataset II further added new sources of variability, including differences in geographic distribution, imaging devices, operator, age of the trees sampled, and disease progression stages.
Among all evaluated models, EfficientNetV2-S emerged as the highest performer in our study. On Dataset I, the model achieved perfect accuracy, F1 score, and AUC–ROC test metrics. Learning was also rapid, reaching nearly perfect validation accuracy by epoch 6. When evaluated on Dataset II, accuracy showed a modest reduction, but remained high. Recall results indicated all positive BLD cases were correctly identified, whereas precision results revealed the model occasionally produced false positives by misidentifying healthy leaves as symptomatic. Model performance was consistent across symptom stages and the amount of banding, underscoring the potential for disease detection even at early stages. Importantly, EfficientNetV2-S consistently distinguished BLD symptoms from woolly aphid feeding injury, which can present visually confusable patterns.
When these findings are compared with results reported in studies on other foliar plant pathogen detections, a consistent pattern emerges. EfficientNet models frequently demonstrate both high classification accuracy and rapid learning, reinforcing their effectiveness for plant disease recognition tasks across different plant types. For instance, Jung et al. (2024) reported that EfficientNetV2-S achieved an F1 score of 92.88% for pine wilt disease identification when trained on a combined dataset of real and synthetic forest images. Similarly, Amin et al. (2025) observed a top F1 score of 92% in pine wilt disease classification using a comparable real and synthetic forest image approach. EfficientNet models have also excelled in agricultural disease detection; for example, EfficientNetB4 outperformed MobileNetV3-L, ResNet50, and Xception in a study identifying foliar rust in sunflower, dry bean, and field pea, achieving an accuracy of 94.29% (Shahoveisi et al., 2023). In maize disease detection, EfficientNet-b0 demonstrated rapid learning, reaching 90% accuracy by epoch 9, surpassing VGG-16, InceptionV3, and ResNet50 models (Liu et al., 2020).
More broadly, EfficientNetV2-S demonstrated superior performance in agriculturally related identification tasks. For example, EfficientNetV2-S reached 94.63% accuracy in a nematode identification study, outperforming MobileNetV3-L, ResNet101, and Swin Transformer V2-B in distinguishing seven plant-parasitic nematode genera (Rangarajan et al., 2026). In a vegetable quality grading study, EfficientNet outperformed VGGNet16, ResNet50, and DenseNet169 with a top-reported accuracy of 95.12% (Wen and He, 2024). The strong performance of EfficientNetV2-S in classification studies is likely attributable to its progressive learning approach, which increases image resolution gradually during training. This enables the model to capture increasingly finer image details while maintaining computational demands, achieving a balance of accuracy and model size relative to older model architectures (Tan and Le 2019, 2021).
Grad-CAM heatmap visualization was conducted for the top-performing model in our study and illustrated that leaf regions with dark color banding, a known feature of BLD, were important for model predictions by EfficientNetV2-S. Grad-CAM is useful for visualizing important regions of images for model predictions, as the interpretability of how convolutional neural networks arrive at predictions is often difficult to understand. Dataset II Grad-CAM visualization revealed hotspots in diagnostic banding areas of BLD leaves. Similar research used Grad-CAM to highlight important regions of leaves to better understand what regions are useful for the identification of a range of diseases on crops, including beans, corn, and sunflowers (Dawod and Dobre, 2022; Shahoveisi et al., 2023; Gopalan et al., 2025). Overall, EfficientNetV2-S showed great potential in our study for use in computer vision classification of BLD.
InceptionV3 achieved the lowest Dataset I test accuracy in our study and was the second least accurate with Dataset II. Precision and recall were relatively balanced for Dataset I, but a large drop in recall with Dataset II indicated that the model struggled to identify positive BLD samples on the new dataset. Although increasing training epochs can improve the performance of models trained with large datasets (Sun et al., 2017; Ajayi and Ashi, 2023), extending training did not greatly improve validation accuracy in our study (data not shown). Prior plant disease identification studies have also reported mixed results of Inception models in plant disease detection. Maeda-Gutiérrez et al. (2020) achieved 98.65% accuracy with InceptionV3 to identify tomato foliar disease, slightly higher than the accuracy in our study, whereas Agarwal et al. (2020) reported considerably lower accuracy of 63.4% for a similar task. More recently, the Inception–Xception model architecture reached higher accuracy than our study, ranging from 98.64% to 100%, and performed with consistently higher accuracy across multiple crop disease datasets (Shafik et al., 2025). While the factorized convolutions used in InceptionV3 represented an important advancement at the time of its development, they are less computationally efficient and slower on modern hardware relative to more modern model architectures like EfficientNet and MobileNet, which may contribute to its comparatively lower performance in our study.
MobileNetV3-L was the third most accurate model in Dataset I, but it ranked second when evaluated on Dataset II. Notably, precision and recall in Dataset II were relatively balanced, suggesting the model was sensitive enough to distinguish BLD-symptomatic from non-symptomatic samples at comparable rates. This performance aligns with the general strengths of MobileNet architectures, which are well-suited for small datasets because their relatively low number of trainable parameters encourages the extraction of distinctive visual cues such as leaf texture or banding patterns, while reducing the risk of overfitting to background noise or incidental variation. Consistent with the relatively strong performance observed in our study, MobileNet has demonstrated strong performance in other plant disease classification tasks, reaching 96% accuracy in a corn seed disease identification study (Alkanan and Gulzar, 2024) and 92% accuracy in a bean disease detection (Elfatimi et al., 2022). In broader agricultural contexts, MobileNet has shown high accuracy for rice seed identification (99.55%) and agricultural products identification (99.96%) (Agustiono et al., 2023; Chen et al., 2024). These collective findings highlight that MobileNet combines both high computational efficiency and strong generalization ability, enabling robust performance in agricultural image classification tasks.
ResNet50 performance achieved high accuracy in Dataset I, but the lowest accuracy with Dataset II. Precision and recall metrics revealed the model struggled to distinguish asymptomatic images from BLD samples by overpredicting BLD in Dataset II. ResNet50 sensitivity to dataset diversity has been observed in previous work. Dawod and Dobre (2022) reported 99% ResNet model accuracy when the sunflower disease test images closely resembled the training dataset, but accuracy dropped to 70% when field images used for testing were more diverse than the training set. The authors attributed the decline to insufficient data diversity for disease progression stages and limited variation in leaf orientation within the training dataset. Additionally, ResNet models are sensitive to class imbalances. Previous research has shown that selective augmentation practices that make classes more evenly represented in the dataset can help address class imbalance sensitivity of ResNet models. These approaches have included the use of generative adversarial networks, oversampling, and Gaussian noise addition practices (Buda et al., 2018; Nafi and Hsu, 2020; Mendoza-Bernal et al., 2024). Publicly available plant disease datasets are commonly imbalanced, which can affect model performance, but due to the overall low number of publicly available images of BLD, incorporating more BLD images during training would likely serve as a better long-term strategy for improving the performance of BLD identification models.
As BLD continues to expand across the United States and Canada, systematically monitoring its geographic spread has become increasingly critical for accurately assessing disease risk and guiding the development and implementation of integrated disease management strategies. This is especially important in forest regions that have only recently been affected and may lack baseline data. Furthermore, synthesizing distributional data with results from multiple pest risk assessment studies (Zhao et al., 2023) would provide substantial value by monitoring the most likely areas for future disease establishment across the entire range of beech in North America, thereby supporting proactive surveillance and management efforts.
In future research, expanding the image training set to include a broader range of leaf symptoms caused by additional biotic and abiotic factors and expanding image capturing conditions and host species may further enhance model generalization for new unseen data. Additionally, incorporating images of leaves collected later in the summer with later stages of BLD would further diversify the image dataset. Additional opportunities include exploring the use of UAVs to capture canopy-level imagery or hyperspectral data and evaluating the capability of convolutional neural networks to distinguish between beech leaf buds infected with L. crenatae and non-infected buds for earlier detection. Expanding the dataset to include symptoms caused by other foliar nematodes in other plant hosts caused by other genera, such as Anguina, Aphelenchoides, and Ditylenchus, could also support the development of a more comprehensive nematode symptom detection framework. Collectively, the findings of this study and the custom dataset presented here provide a foundation for advancing image-based diagnostics of foliar nematode diseases.
Acknowledgments
Mention of trade names or commercial products in this publication is solely for the purpose of providing specific information and does not imply recommendation or endorsement by the USDA. The USDA is an equal opportunity provider and employer.
Funding information
This work was supported by the International Programs of the U.S. Forest Service, Department of Agriculture, under the 23-IA-11132762-169 project (PV), and the United States Department of Agriculture Agricultural Research Service CRIS project number 8042-22000-322-000D (BW, PV, SL).
Author contributions
BDW: Conceptualization, data collection, analysis, writing – original draft. PV: Conceptualization, data collection, writing – review & editing. MAB: Data collection, writing – review & editing. SL: Data collection.
Conflict of interest statement
Authors state no conflict of interest.
Data availability statement
Dataset I image data are publicly available from Ag Data Commons at https://doi.org/10.15482/USDA.ADC/30850214. The EfficientNetV2-S model trained in this study can be accessed through a Gradio application at https://huggingface.co/spaces/bdwaldo/BLD.