
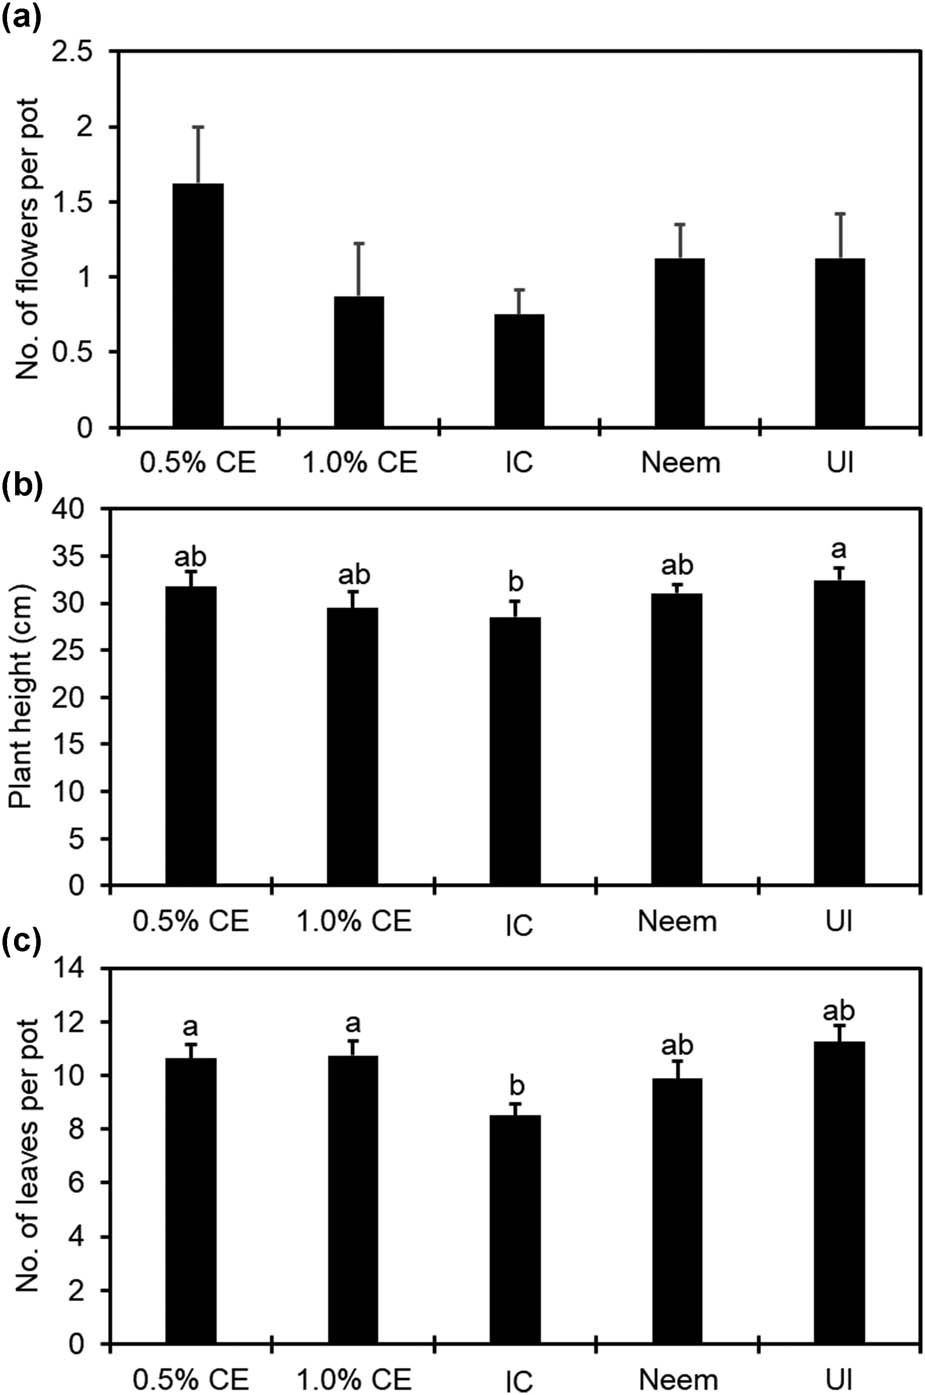
Figure 1
Effect of papaya seed CE at 0.5% and 1.0%, IC, neem, and UI on “Leilani” anthurium plant vigor, measured by (a) number of flowers, (b) plant height, and (c) number of leaves. Mean values (n = 8) followed by the same letter(s) are not different according to Waller–Duncan k-ratio (k = 100) t-test. (IC=inoculated control; UI = un-inoculated)
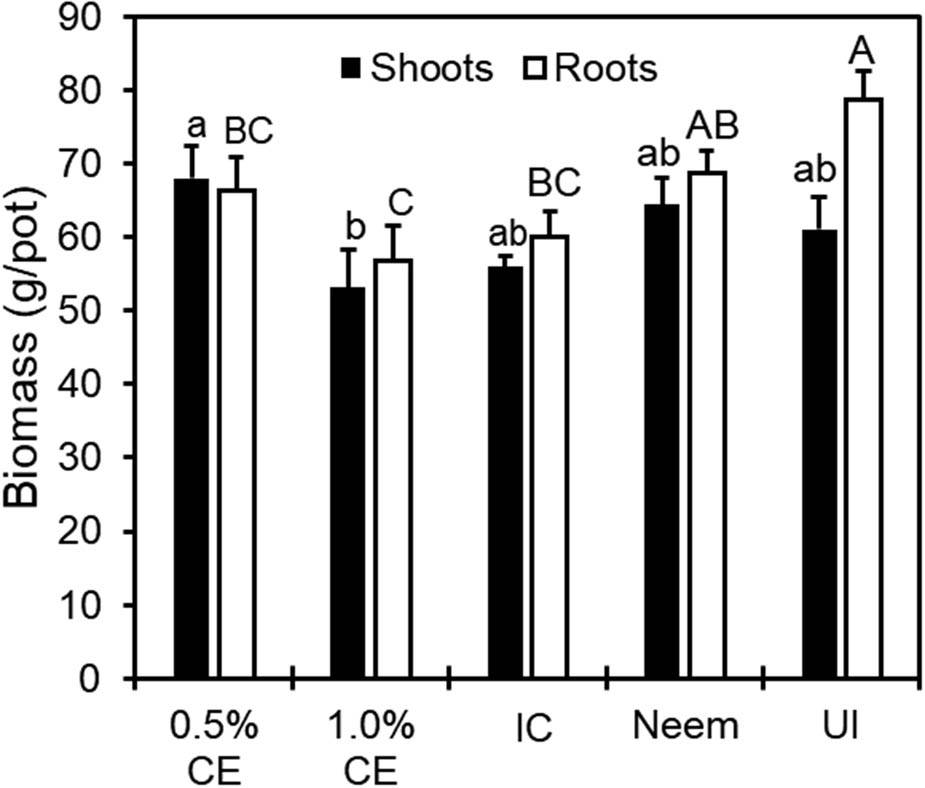
Figure 2
Effect of 0.5% and 1.0% papaya seed C'E, IC, neem, and UI on root and shoot biomass of “Leilani” anthurium. Mean values (n = 8) followed by the same letter(s) are not different according to Waller–Duncan k-ratio (k = 100) t-test. (IC=inoculated control; UI = un-inoculated)
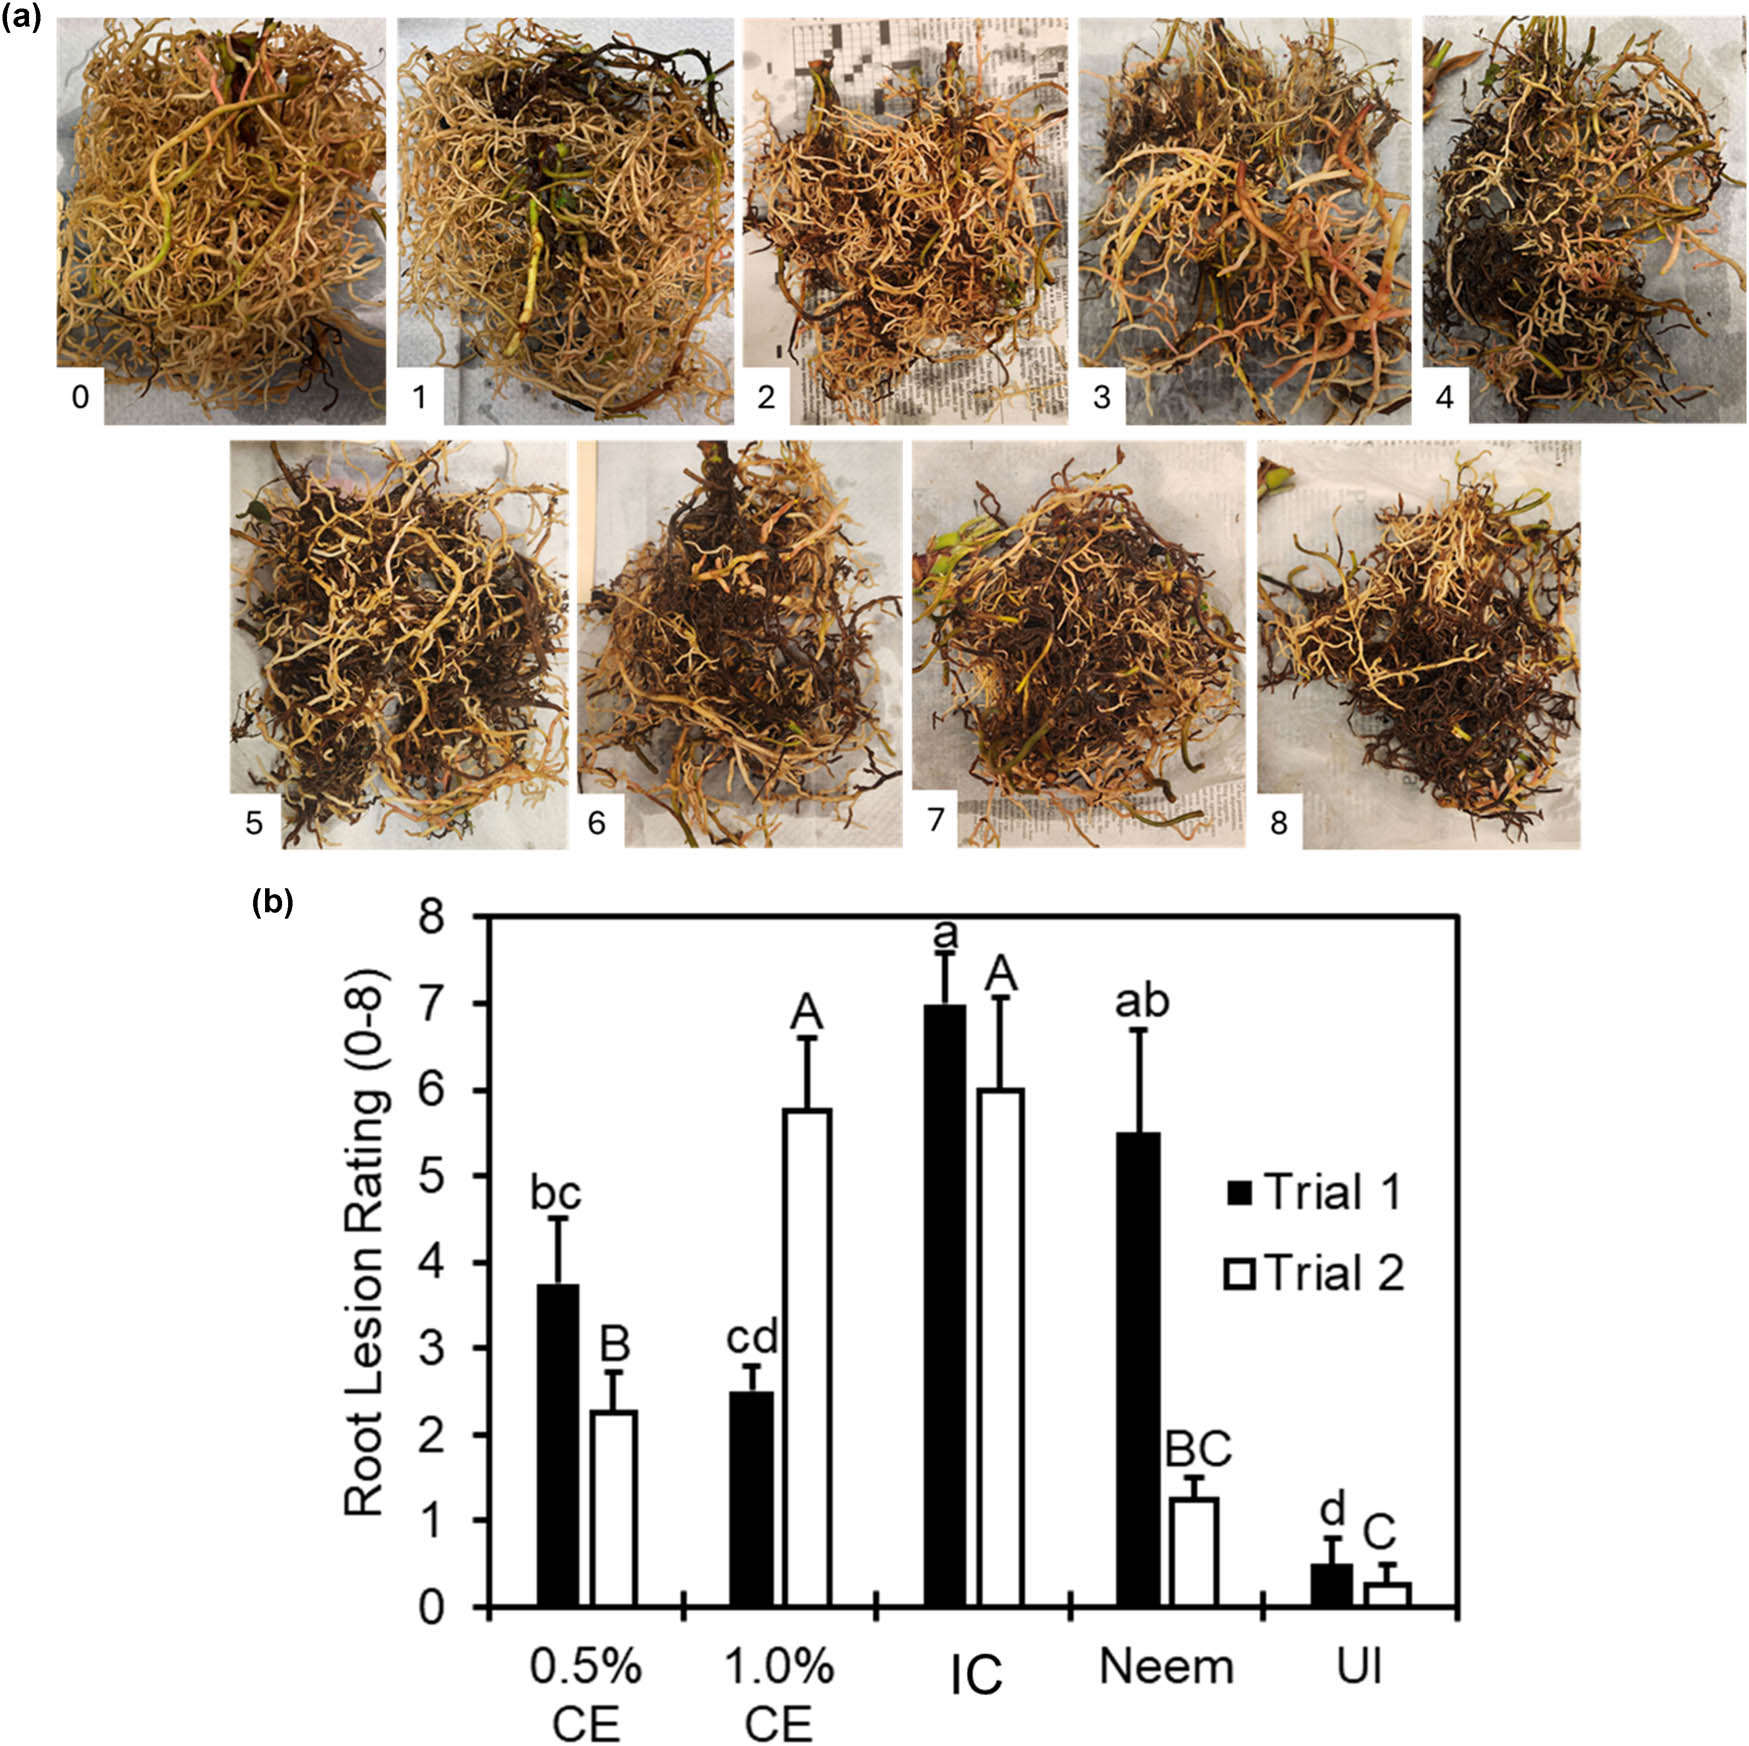
Figure 3
(a) Root lesion rating scale from 0 to 8 where 0 signifies no lesions, and 8 has majority of the root system turning brown with minimal functioning roots, and (b) the effect of 0.5% and 1.0% papaya seed CE, IC, neem, and UI on root lesion caused by Radopholus similis. Mean values (n = 4) followed by the same letter(s) are not different according to Waller–Duncan k-ratio (k = 100) t-test.
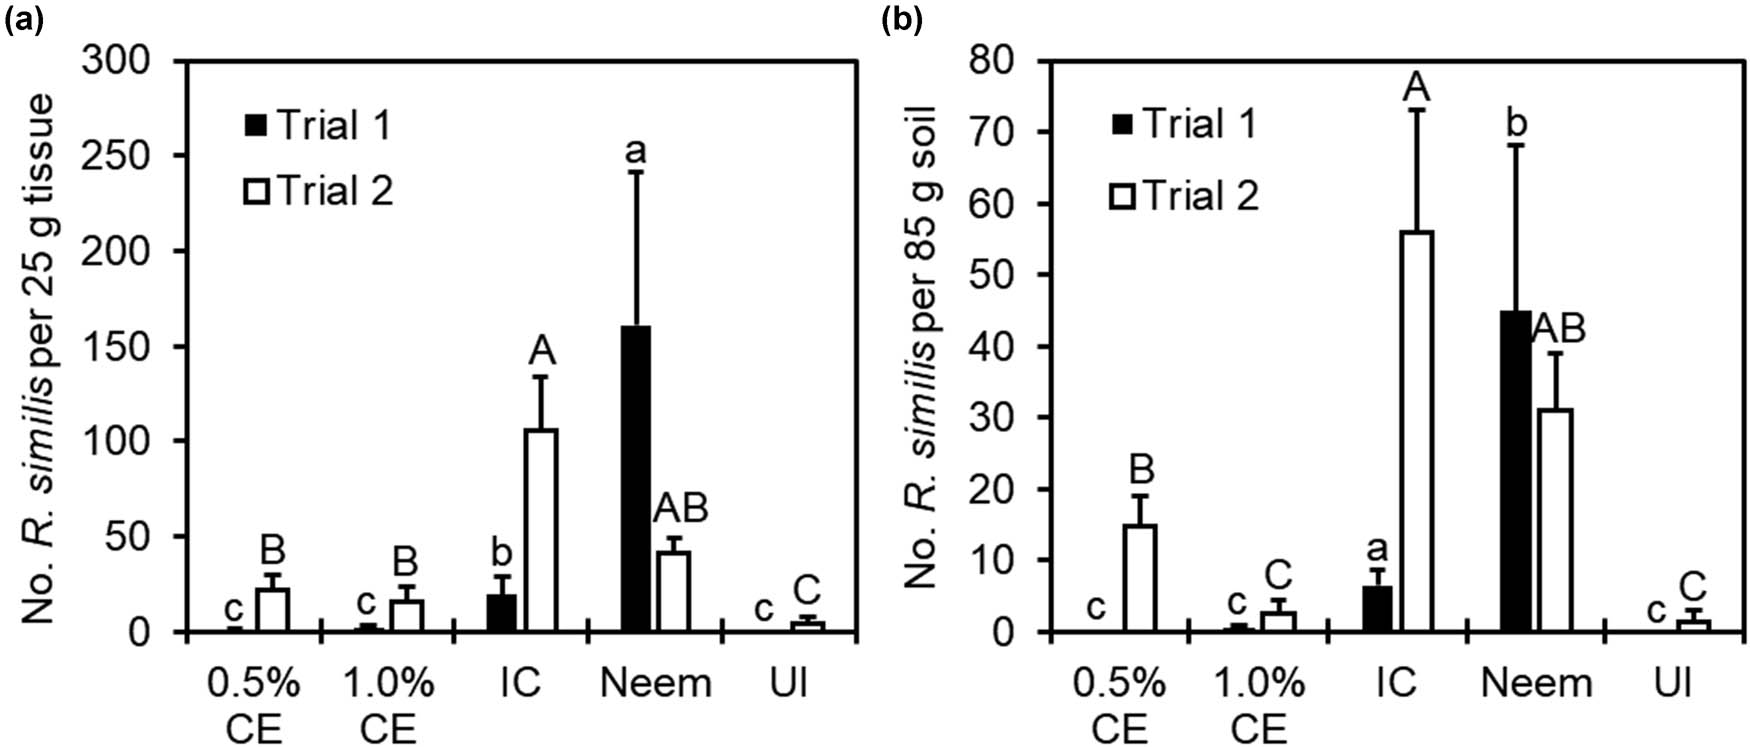
Figure 4
Population of Radopholus similis recovered from “Leilani” anthurium across treatments: 0.5% CE, 1.0% CE, inoculated control, neem, and UI in (a) root and basal shoot tissue and (b) cinder. Mean values (n = 4) followed by the same letter(s) are not different according to Waller–Duncan k-ratio (k = 100) t-test.
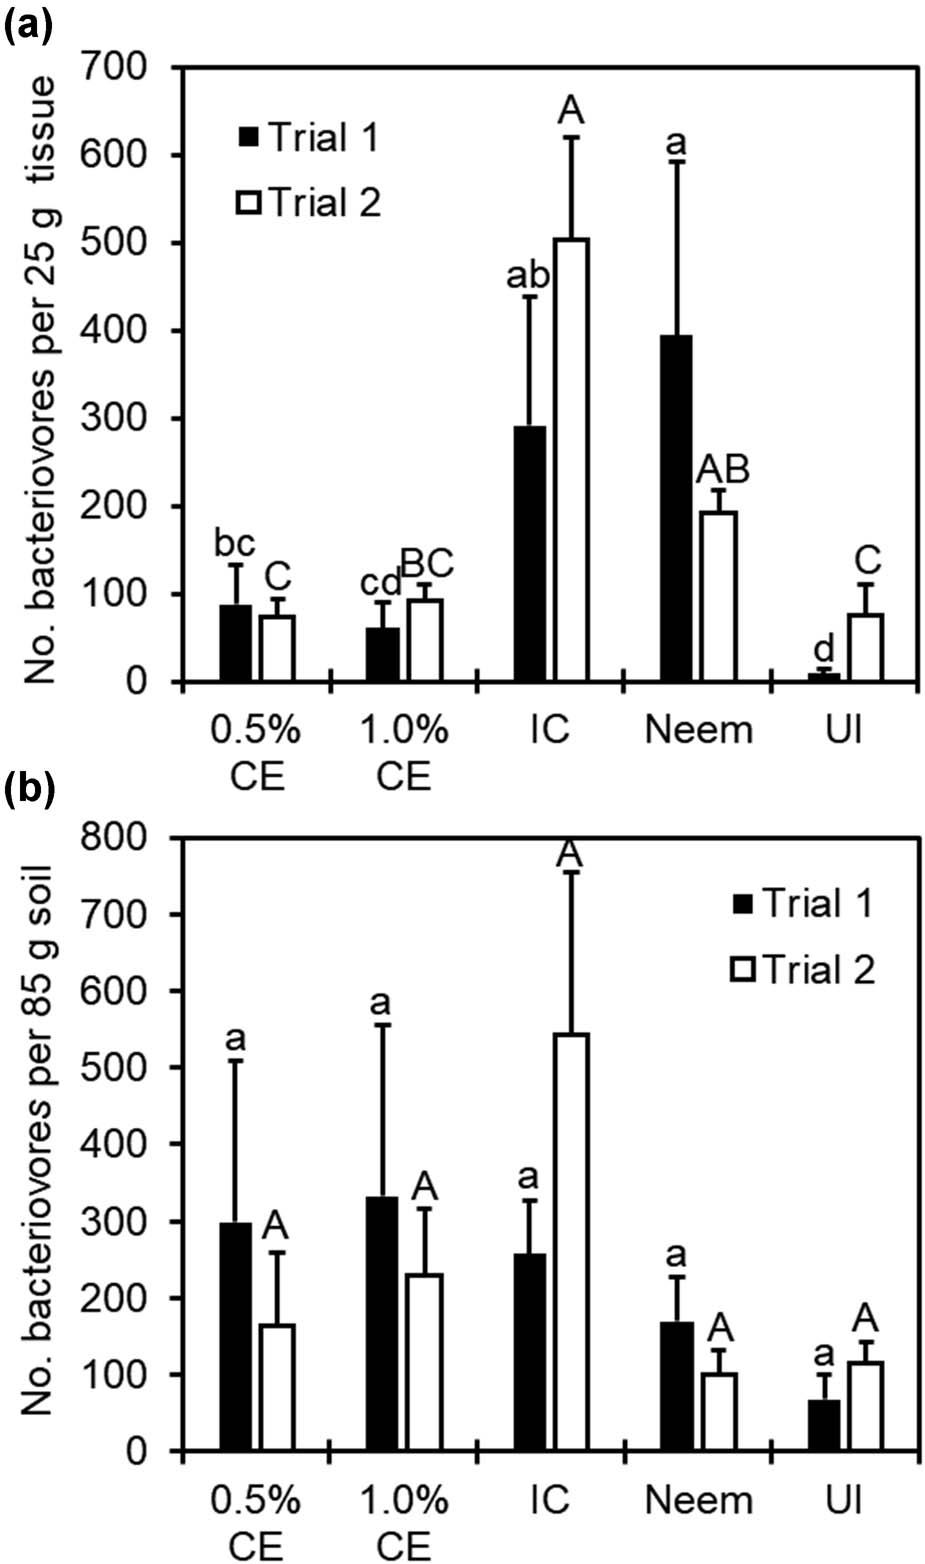
Figure 5
Abundance of bacterial-feeding nematodes recovered from “Leilani” anthurium across treatments: 0.5% CE, 1.0% CE, IC, neem, and UI in (a) root and basal shoot tissue and (b) cinder. Mean values (n = 4) followed by the same letter(s) are not different according to Waller–Duncan k-ratio (k = 100) t-test.
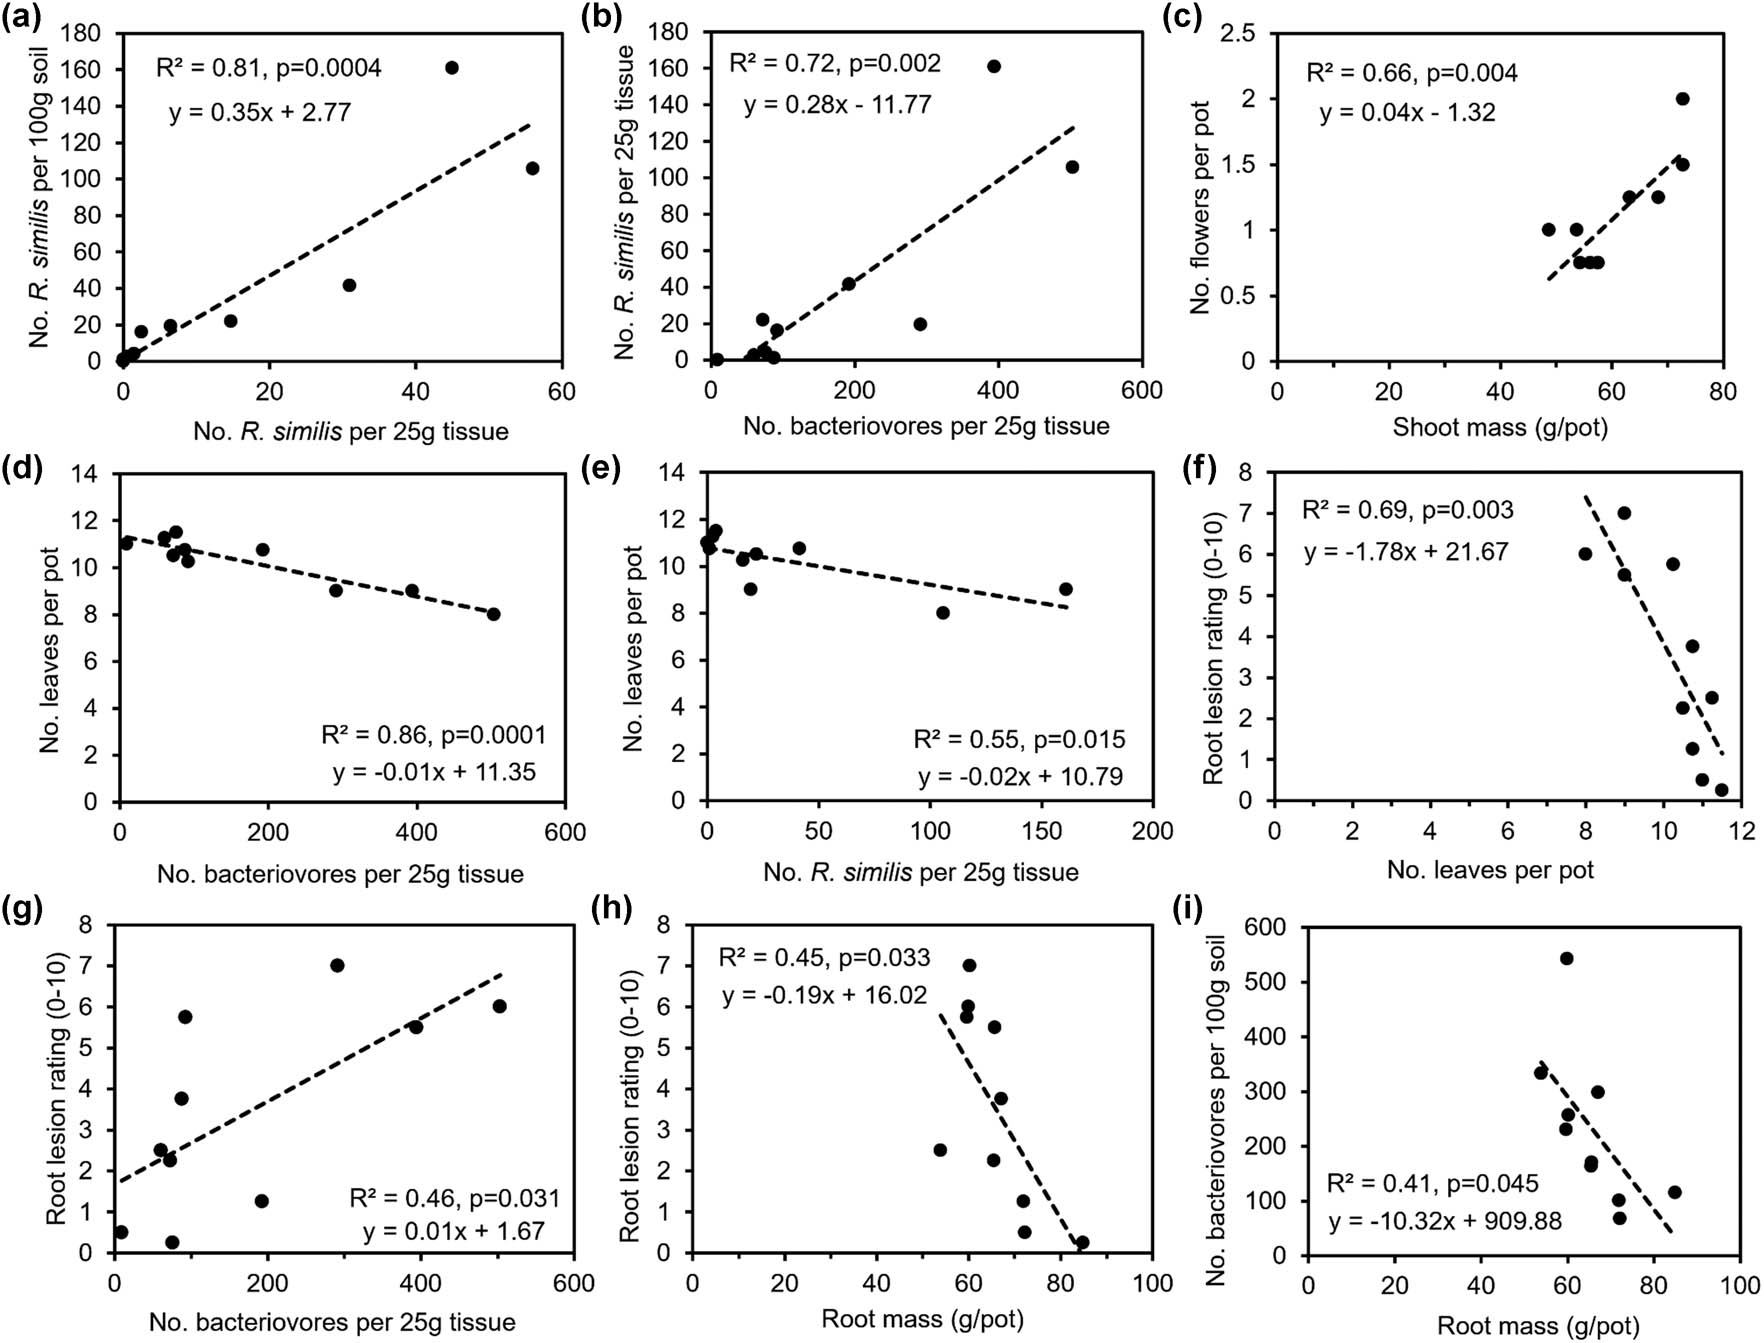
Figure 6
Linear regression analysis of key parameters affecting anthurium growth and yield.