
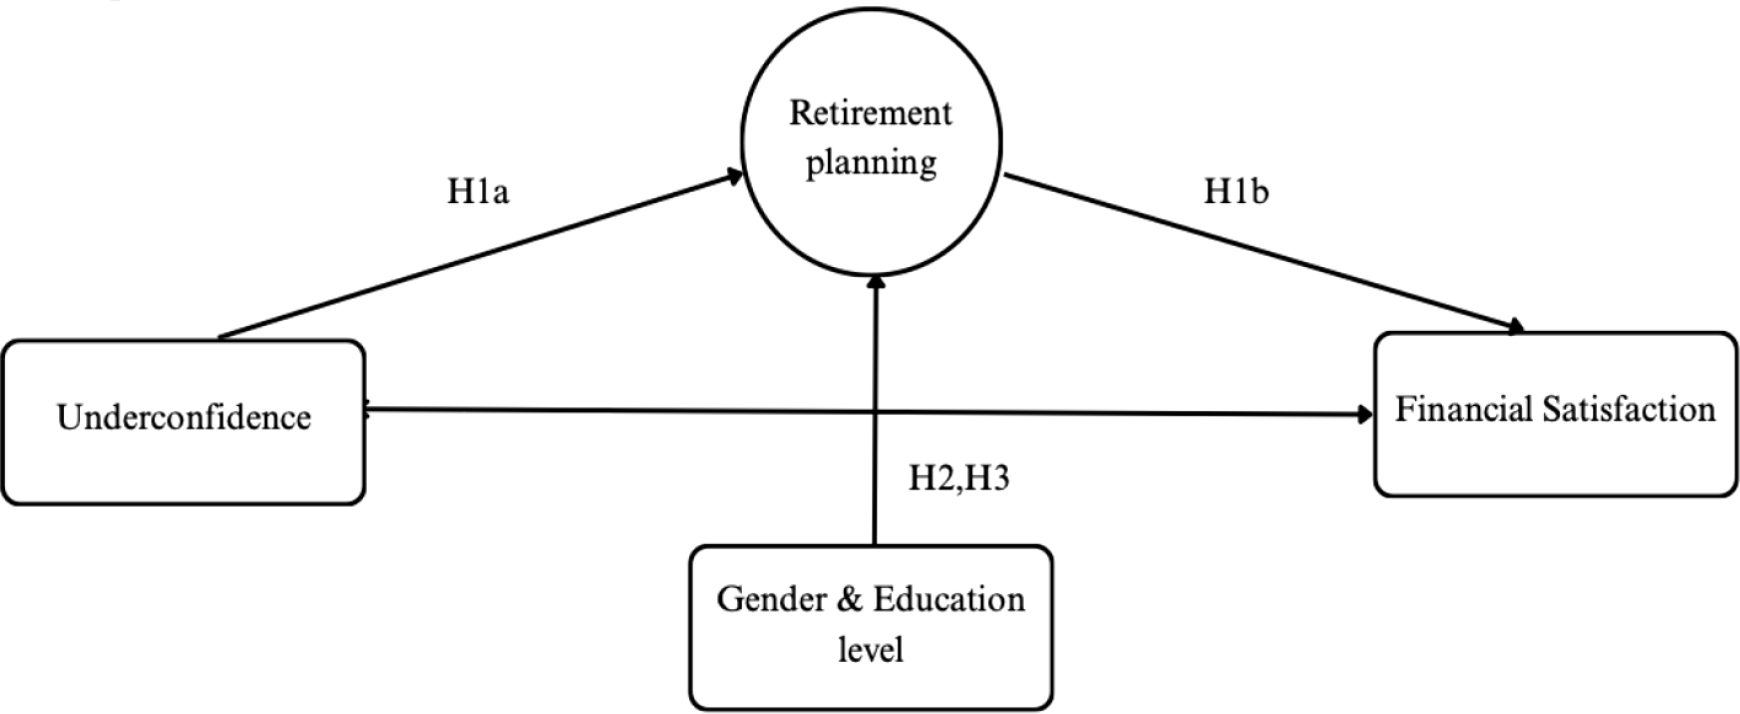
Figure 1.
Conceptual Model
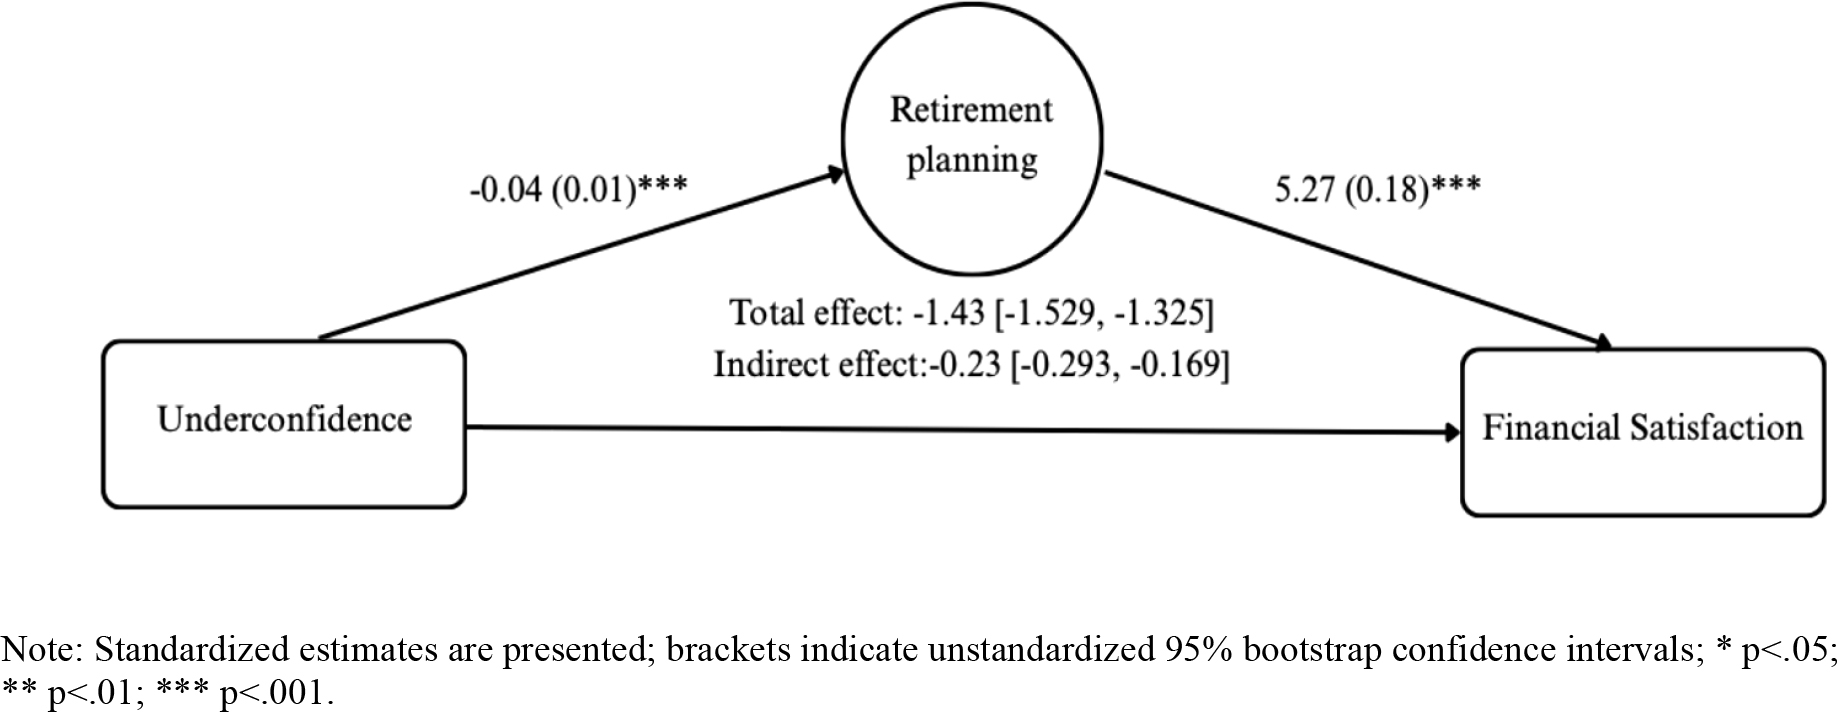
Figure 2.
Structural Equation Model Predicting Financial Satisfaction
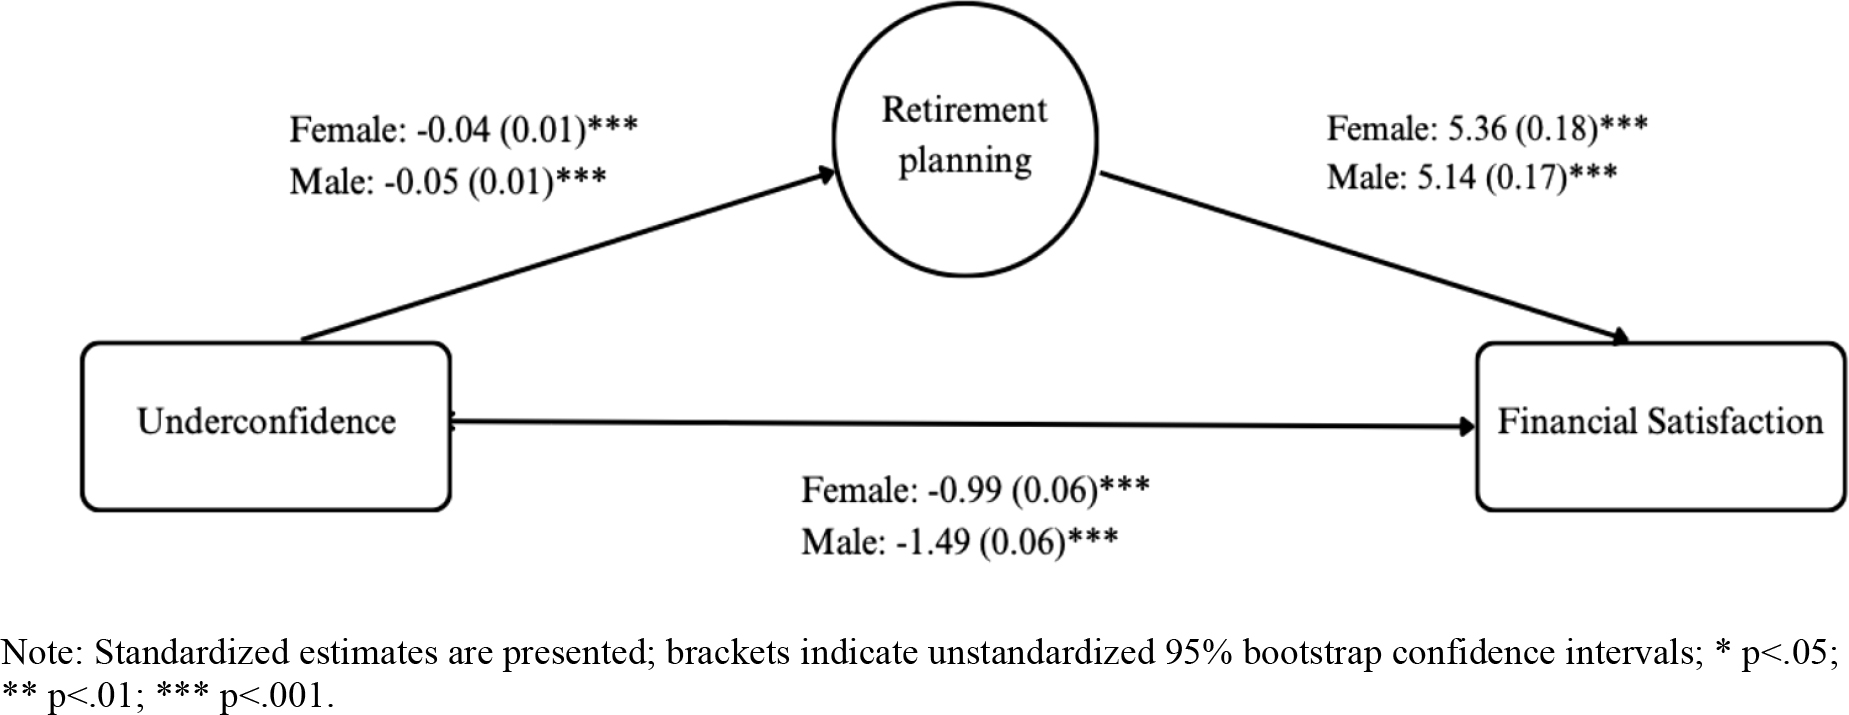
Figure 3.
Structural Equation Model with Gender
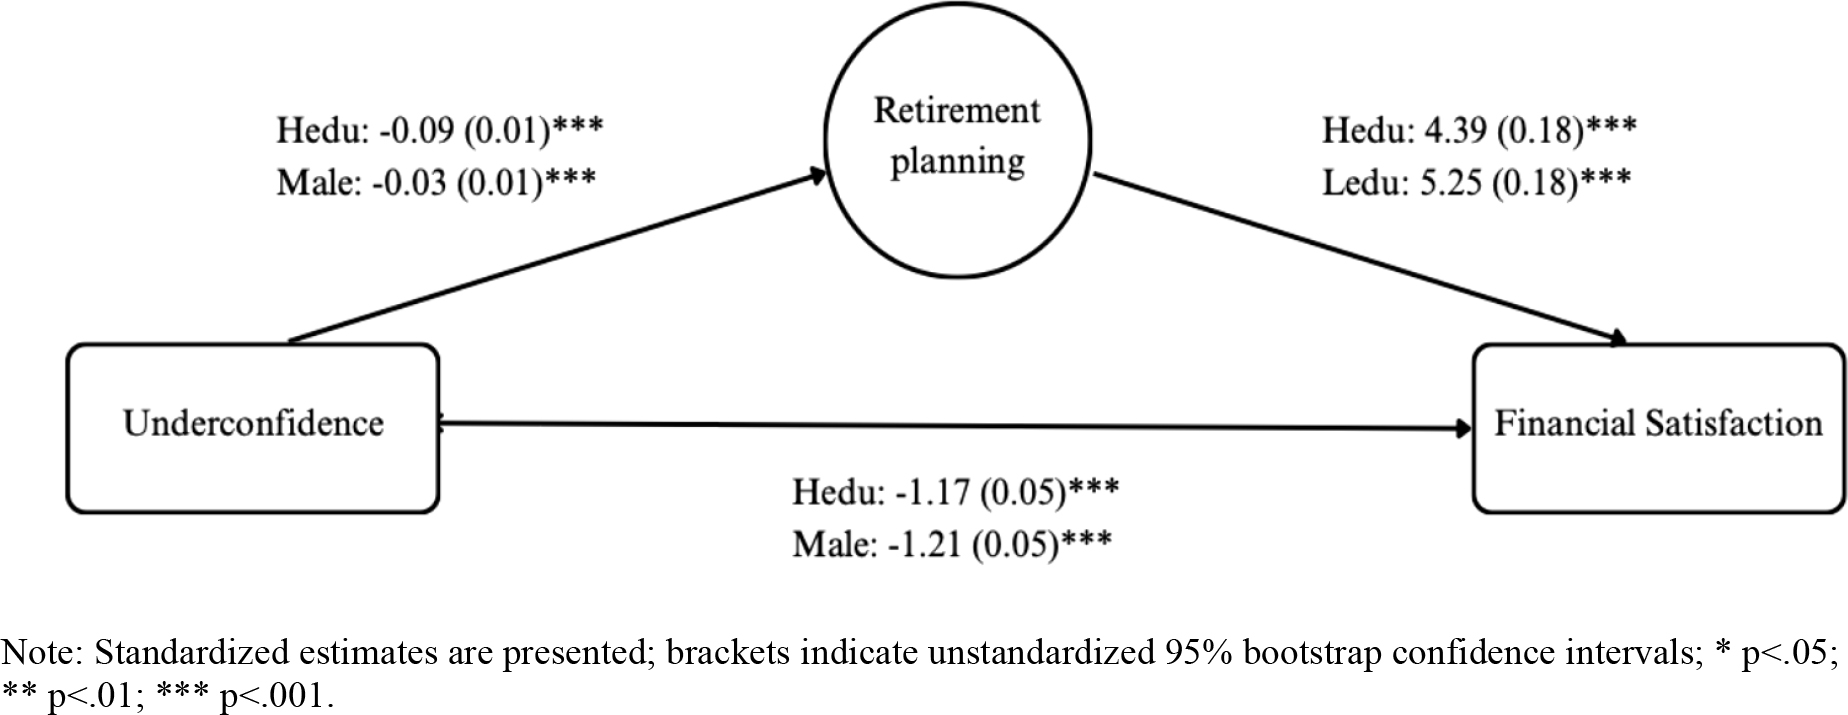
Figure 4.
Structural Equation Model with Education Level
Table A1.
Sample characteristics
| Variable | All | By Gender | By Education | ||
|---|---|---|---|---|---|
| Percentage | Whole sample (20,198) | Female (10,845) | Male (9,353) | Low education (13,091) | High education (7,107) |
| Underconfidence | 12.5 | 13.0 | 11.8*** | 13.2 | 12.4* |
| Overconfidence | 22.8 | 19.8 | 25.4*** | 25.9 | 17.2*** |
| Retirement planning | |||||
| Calculating retirement needs | 46.0 | 40.8 | 51.9*** | 37.3 | 61.4*** |
| Employer retirement account | 56.2 | 53.9 | 59.7*** | 45.6 | 76.4*** |
| Non-employer retirement account | 34.4 | 30.0 | 39.5*** | 23.5 | 57.3*** |
| Gender | |||||
| Female | 54.0 | 57.5 | 47.8*** | ||
| Male | 46.0 | 42.5 | 52.2*** | ||
| Marital Status | |||||
| Married | 49.0 | 46.5 | 51.9** | 42.3 | 61.1*** |
| Single | 33.4 | 31.3 | 35.8*** | 37.8 | 25.4 |
| Divorced/widowed/separated | 17.6 | 22.2 | 12.3*** | 19.9 | 13.5 |
| Employment Status | |||||
| Work full-time | 38.6 | 31.9 | 46.4*** | 31.1 | 51.7*** |
| Work part-time | 7.9 | 6.5 | 9.6 *** | 8.3 | 7.2*** |
| Self-employed | 8.7 | 10.2 | 7.0 *** | 9.5 | 7.2*** |
| Homemaker | 6.7 | 11.6 | 1.0 *** | 8.3 | 3.8*** |
| Full-time student | 2.8 | 3.2 | 2.3 *** | 3.7 | 1.1*** |
| Permanently sick/disabled | 5.6 | 6.3 | 4.9 *** | 7.9 | 1.6*** |
| Unemployed | 8.1 | 8.5 | 7.7 *** | 10.6 | 3.6*** |
| Retired | 21.6 | 21.9 | 21.2 *** | 20.3 | 39.4*** |
| Mean | |||||
| Financial satisfaction (1-10) | 5.9 | 5.5 | 6.5*** | 5.4 | 6.5*** |
| Objective literacy (0-6) | 3.0 | 2.8 | 3.4*** | 2.6 | 3.7*** |
| Subjective literacy (1-7) | 5.1 | 4.8 | 5.3*** | 4.9 | 5.4** |
| Age (1-6) | 3.7 | 3.7 | 3.8 | 3.6 | 4.0*** |
| Education (1-7) | 4.4 | 4.3 | 4.6*** | ||
| Income (1-10) | 4.2 | 4.0 | 4.7*** | 3.6 | 5.6*** |
Table A2.
Correlation among key variables
Table A3.
Comparison between constrained and free model by gender
| χ2 | df | Δχ2 | Δdf | P | CFI | RMSE A | |
|---|---|---|---|---|---|---|---|
| Constrained model | 1733.5 | 50 | .933 | .058 | |||
| Free model | 1542.2 | 32 | 191.2 | 18 | <0.001 | .944 | .068 |
| Model with following constraints | |||||||
| UC → RetPlan | 1543.7 | 33 | 1.54 | 1 | 0.21 | .938 | .067 |
| UC → Sat | 1563.3 | 33 | 21.1 | 1 | <0.001 | .938 | .068 |
| RetPlan → Sat | 1542.3 | 33 | 0.34 | 1 | 0.55 | .938 | .067 |
Table A4.
Indirect and direct effects by gender
| Female | Male | |
|---|---|---|
| Indirect effect: | -0.20 | -0.26 |
| UC → RetPlan → Sat | [-0.27, -0.12] | [-0.35, -0.17] |
| Direct effect: | -0.99 | -1.48 |
| UC → Sat | [-1.12, -0.84] | [-1.64, -1.32] |
Table A5.
Comparison between constrained and free model by education level
| χ2 | df | Δχ2 | Δdf | P | CFI | RMSE A | |
|---|---|---|---|---|---|---|---|
| Constrained model | 1742.9 | 50 | .912 | .058 | |||
| Free model | 1485.7 | 32 | 258.2 | 18 | <0.001 | .925 | .067 |
| Model with following constraints | |||||||
| UC → RetPlan | 1507.6 | 33 | 21.92 | 1 | <0.001 | .924 | .067 |
| UC → Sat | 1485.8 | 33 | 0.15 | 1 | 0.69 | .924 | .066 |
| RetPlan → Sat | 1491.1 | 33 | 5.42 | 1 | <0.05 | .924 | .064 |