
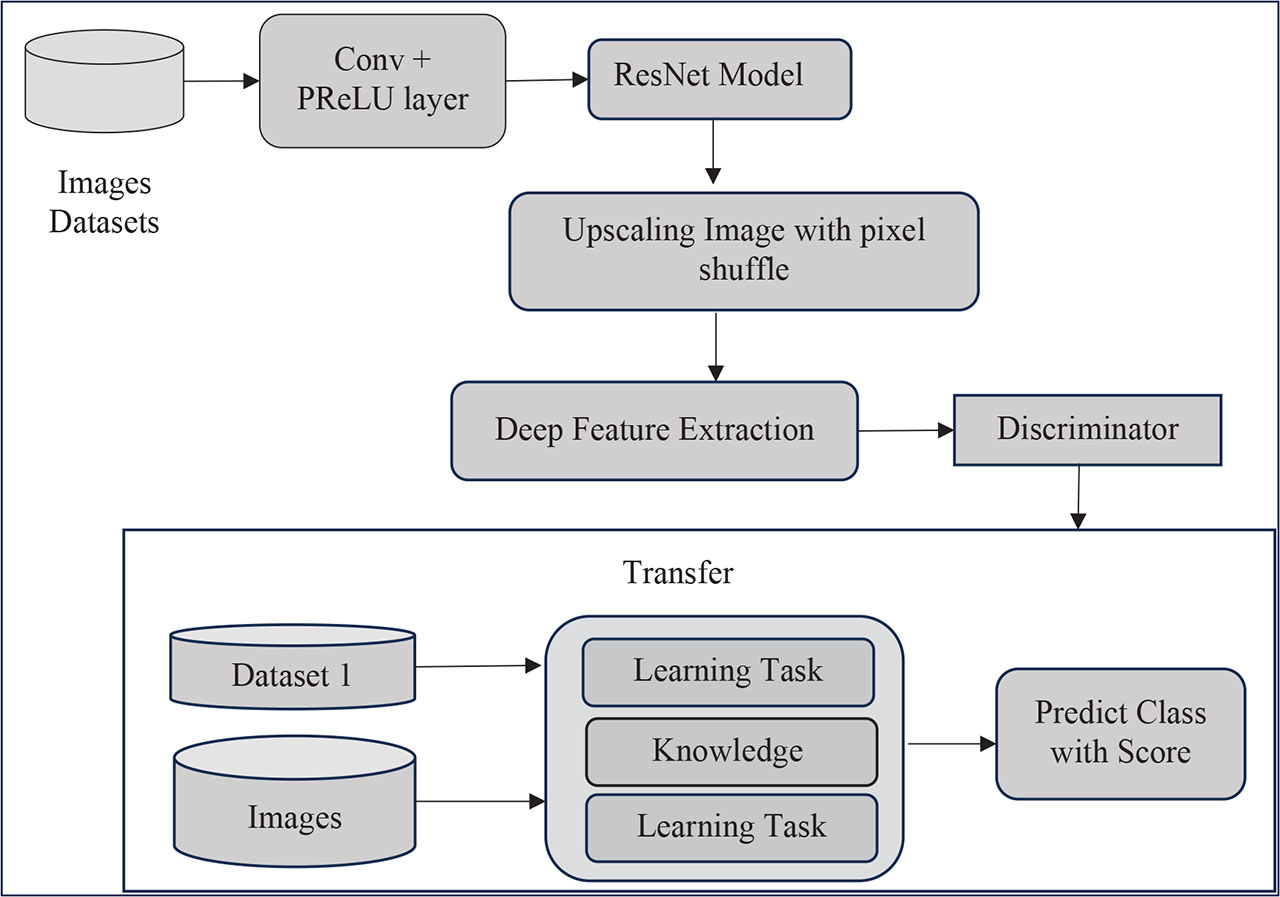
Figure 1:
Block diagram for the classification of dyslexia from images.
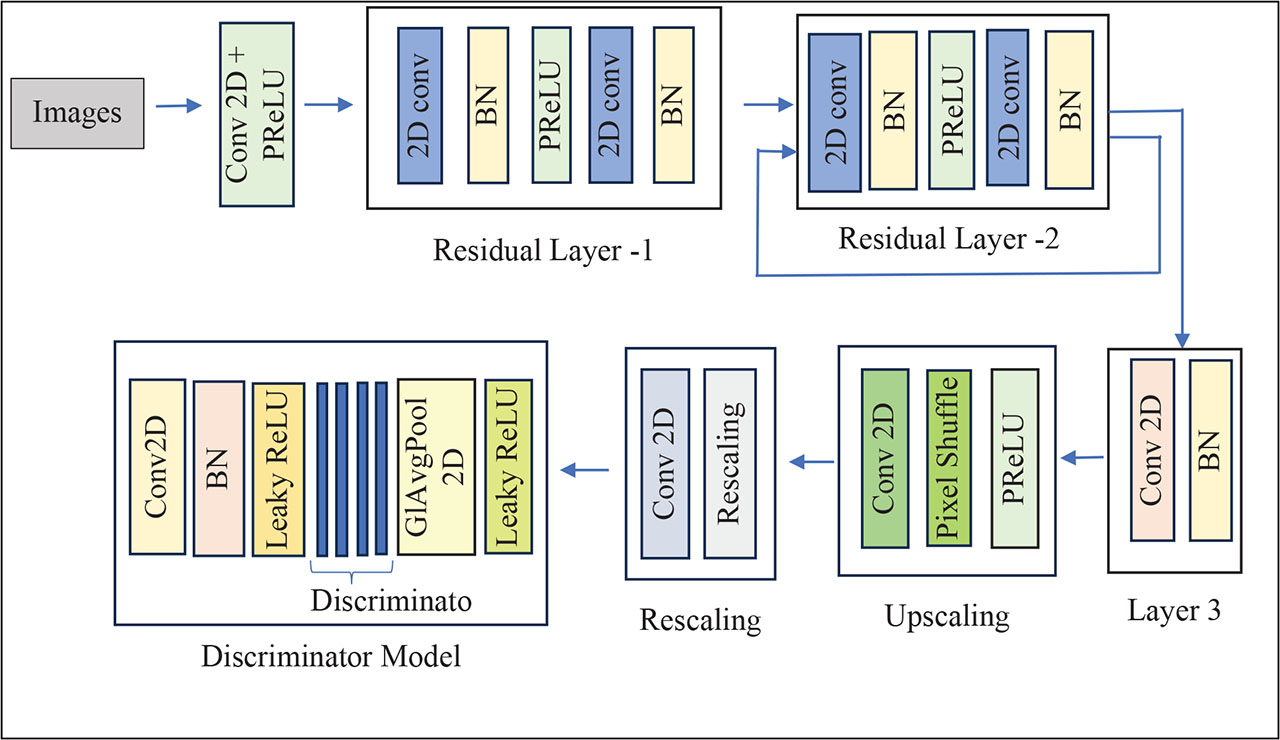
Figure 2:
Architecture of SRGAN [28]. SRGAN, Super-Resolution Generative Adversarial Network.
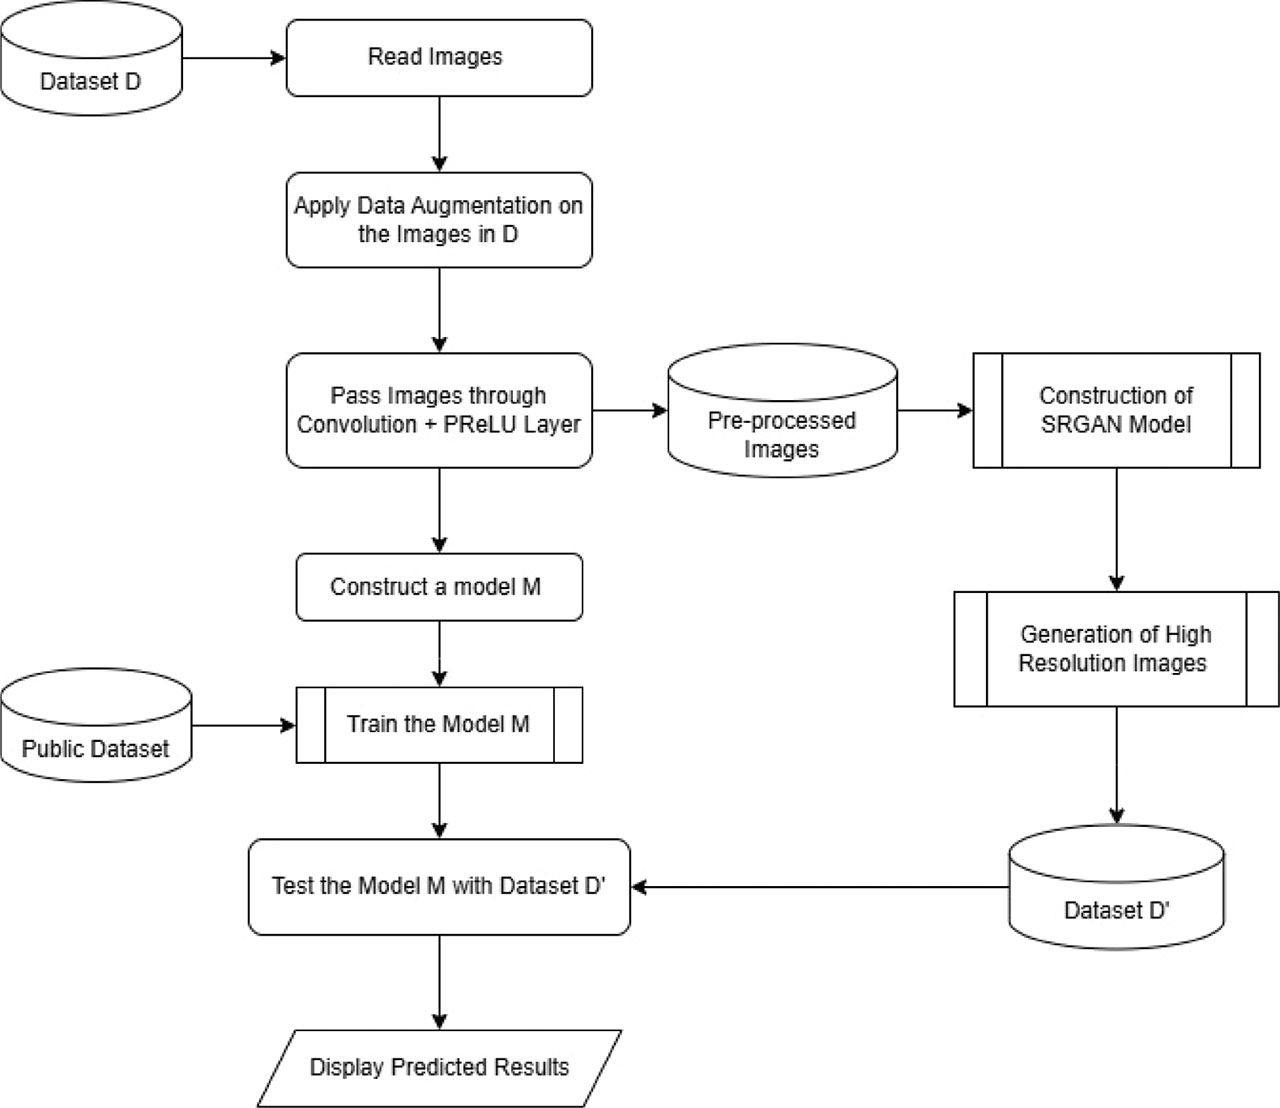
Figure 3:
Flowchart for the proposed model to predict classes for the dyslexia handwriting images. SRGAN, Super-Resolution Generative Adversarial Network.
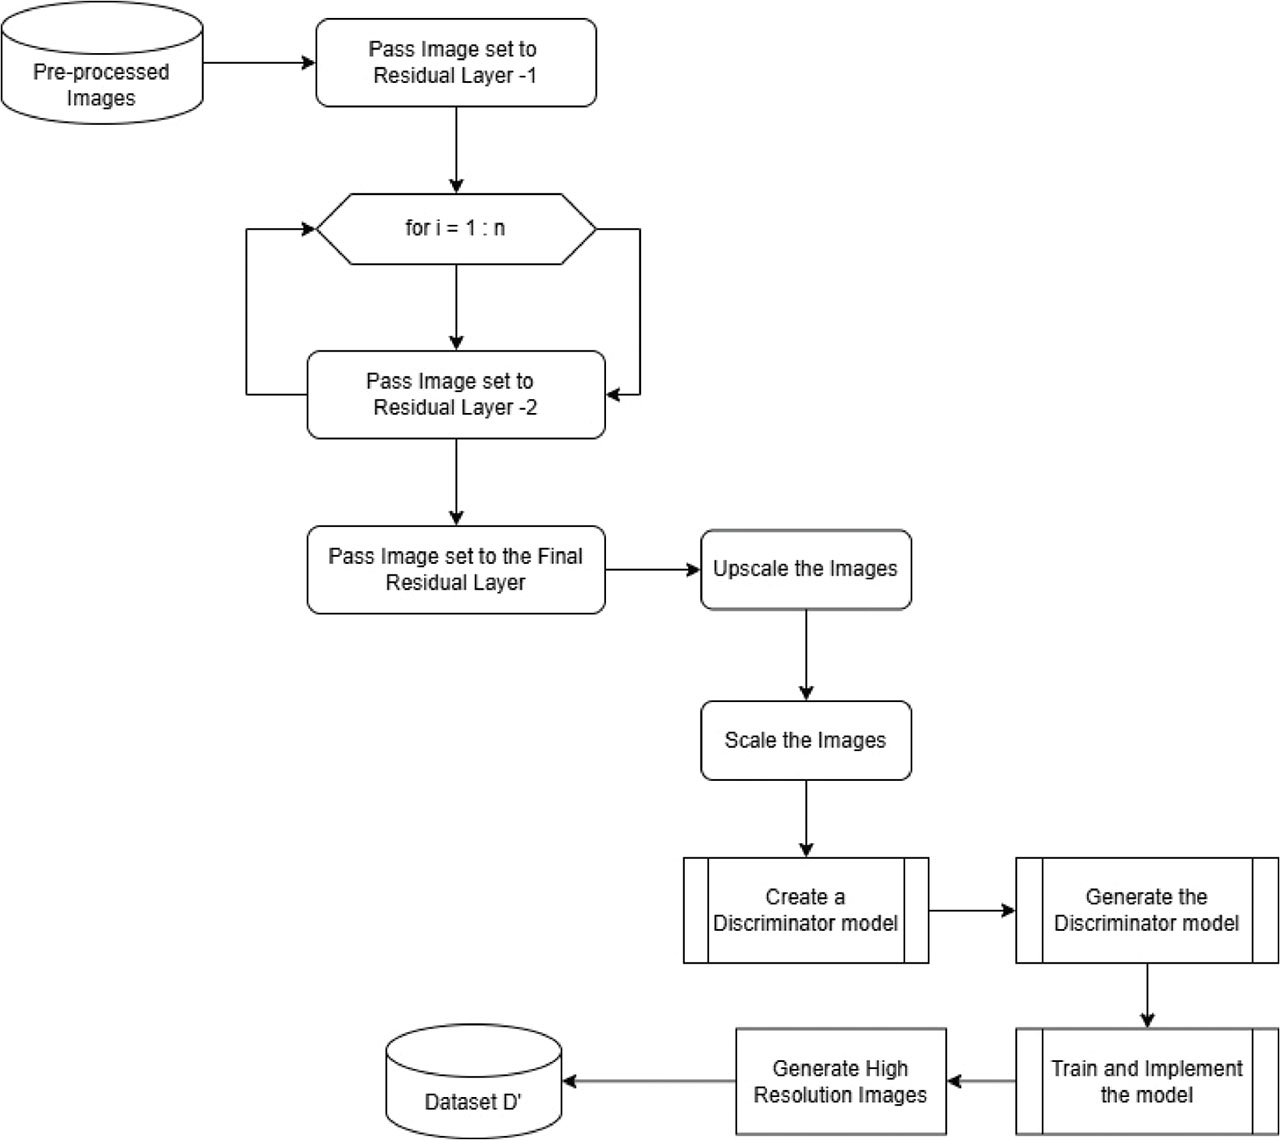
Figure 4:
Flowchart for SRGAN module generating high-resolution images. SRGAN, Super-Resolution Generative Adversarial Network.
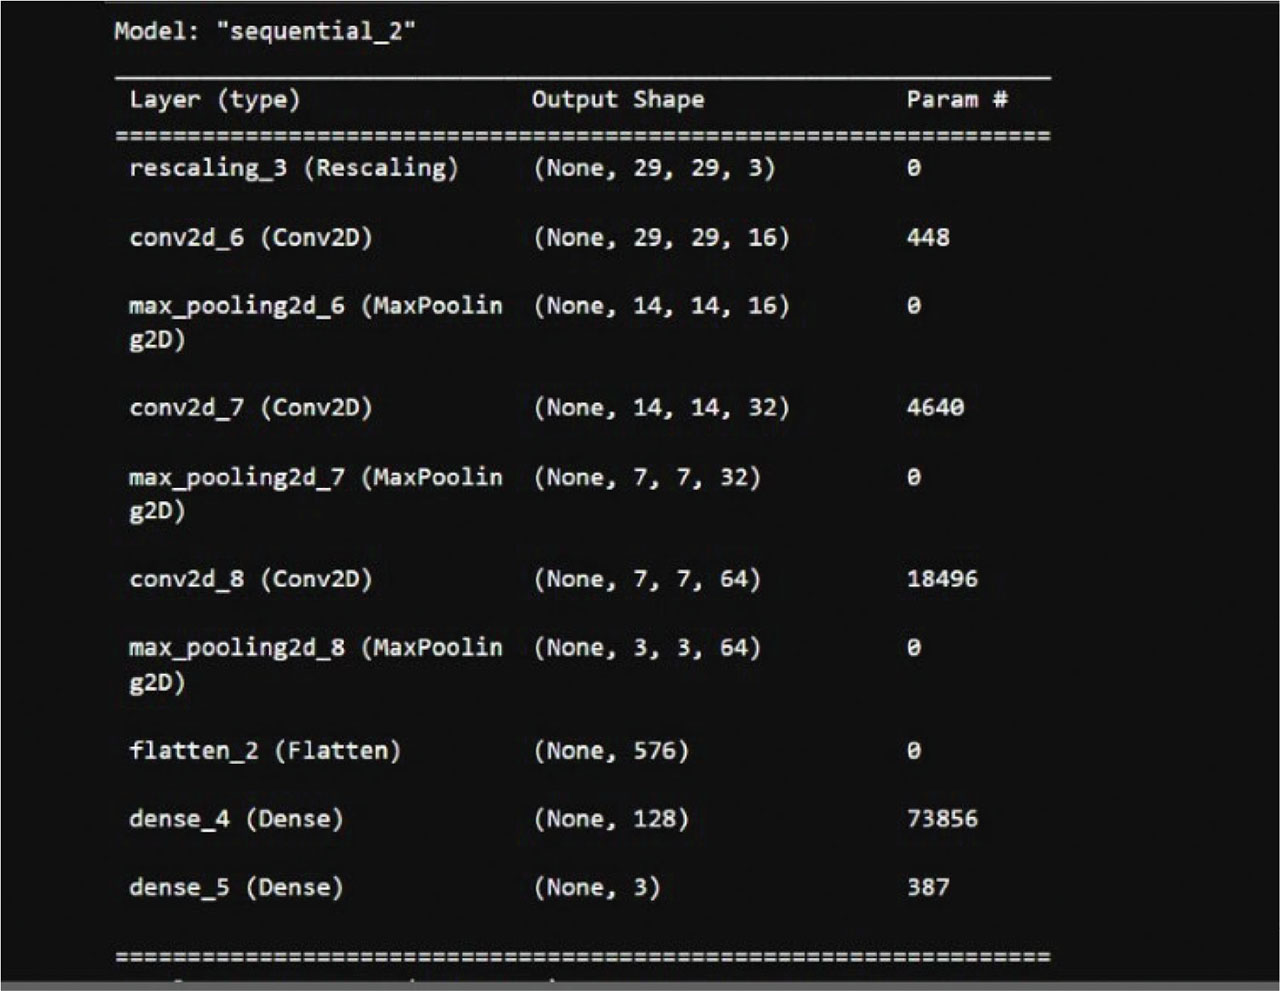
Figure 5:
Proposed classifier model summary.
Table 1:
Prediction scores for randomly selected sample images from the test dataset
| Image | Class | Prediction score, % |
|---|---|---|
| ImgID1001 | Normal | 99.81 |
| Img ID1002 | Normal | 99.86 |
| Img ID1003 | Normal | 99.82 |
| Img ID1004 | Normal | 93.46 |
| Img ID1005 | Normal | 98.72 |
| Img ID1006 | Normal | 72.76 |
| Img ID1007 | Normal | 95.85 |
| Img ID1008 | Normal | 88.95 |
| Img ID1009 | Reversal | 87.85 |
| Img ID10010 | Normal | 93.72 |
| Img ID10011 | Reversal | 89.20 |
| Img ID10012 | Normal | 88.88 |
| Img ID10013 | Normal | 80.93 |
| Img ID10014 | Normal | 99.33 |
| Img ID10015 | Reversal | 92.73 |
| Img ID10016 | Normal | 94.19 |
| Img ID10017 | Reversal | 89.24 |
| Img ID10018 | Normal | 97.89 |
| Img ID10019 | Normal | 95.63 |
| Img ID10020 | Corrected | 98.03 |
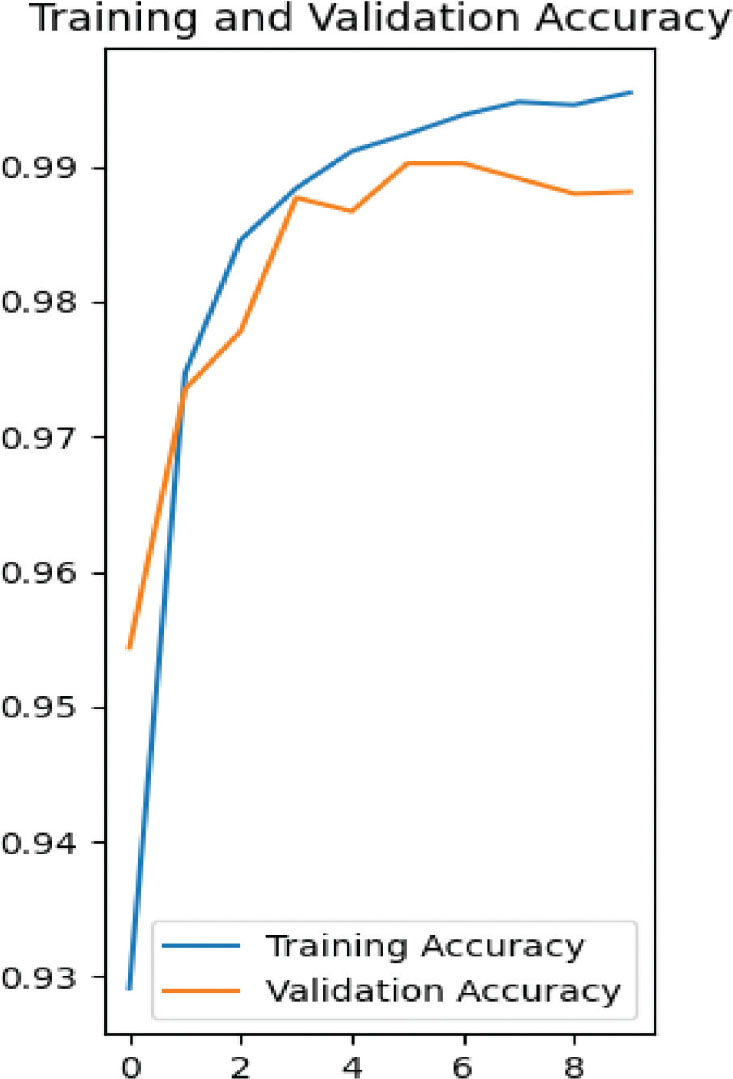
Figure 6.1
Training versus validation accuracy for alphabet dataset.
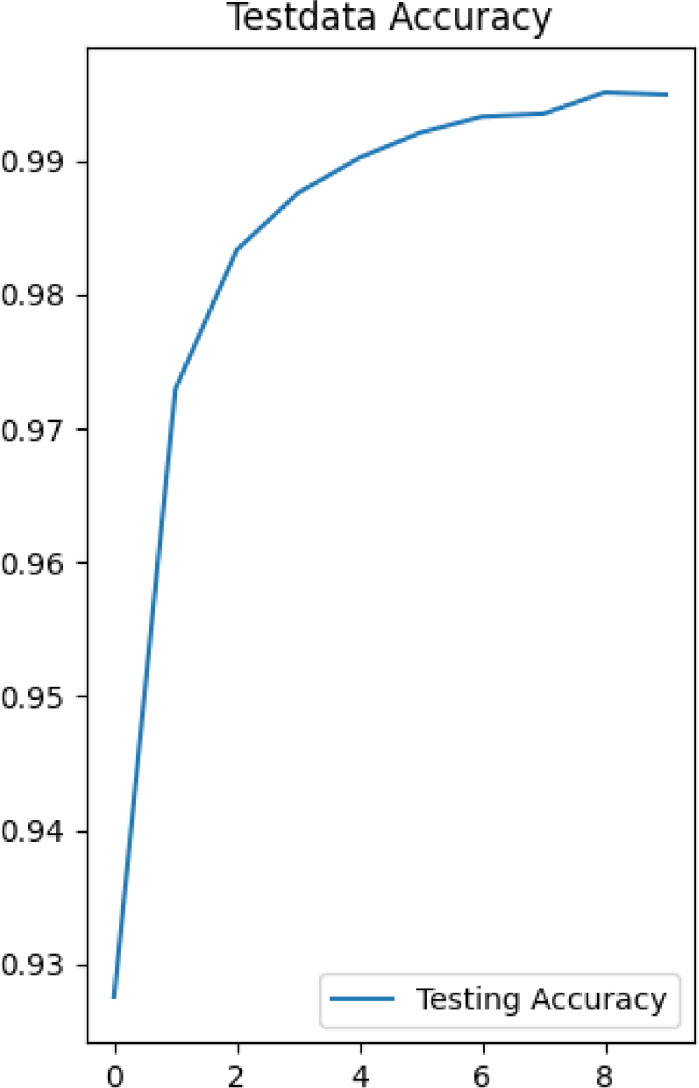
Figure 6.2
Testing accuracy for alphabet dataset.
Table 2:
Questions in the questionnaire form collected for exploratory data analysis
| S. No. | Questions |
|---|---|
| Q1 | Age |
| Q2 | Gender |
| Q3 | Nationality |
| Q4 | Does your child frequently reverse letters or miss out some letters when writing especially letters like C, D, E, and F? |
| Q5 | Does your child have difficulty sounding out words phonetically, particularly new words? |
| Q6 | Does your child suffer copying notes from the board? Example: missing information, misspelling, or leaving out lines while copying |
| Q7 | Do you feel your child is academically doing well? |
| Q8 | Do you feel your child lacks reading ability? |
| Q9 | Does your child struggle with solving mathematical word problems? |
| Q10 | Does your child have difficulty understanding multiple instructions given by anyone like tying shoelace? |
| Q11 | Does your child have difficulty with fine or gross motor skills (handwriting, holding a pencil, catching and throwing a ball, team sports)? |
| Q12 | Does your child suffer from focusing for a long time on one activity? Do you feel he is attention deficit or lacks attention? |
| Q13 | Is the child creative compared to other children? |
| Q14 | Does your child have extraordinary memory? |
| Q15 | Was the child born as premature baby? |
| Q16 | Was the mother under medication for any neurological or other disease/disorders? |
| Q17 | Does your child suffer from dyslexia? |
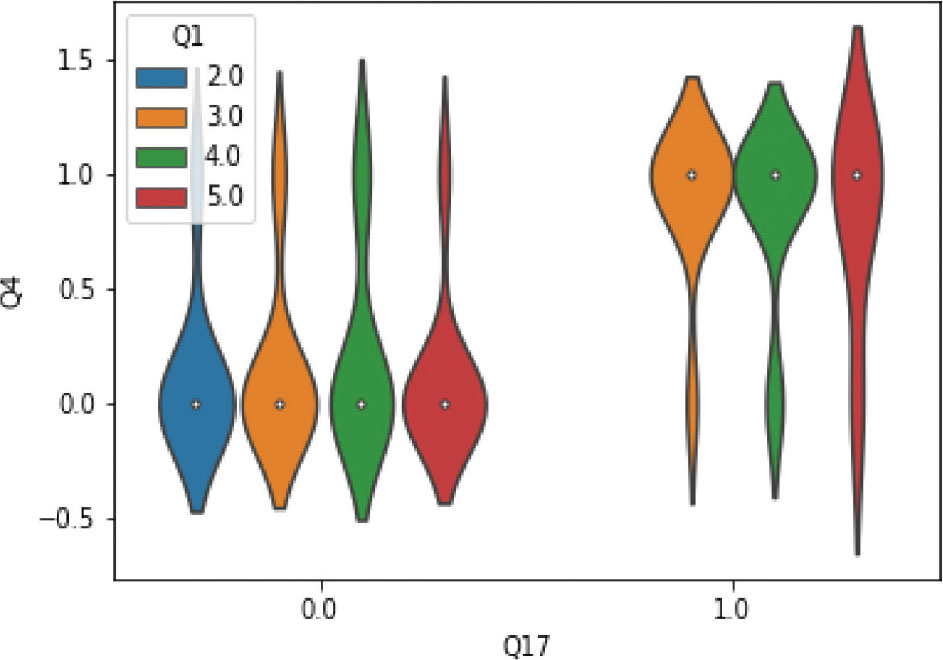
Figure 7.1
Visualization of correlation of letter reversal to dyslexia among all age groups.
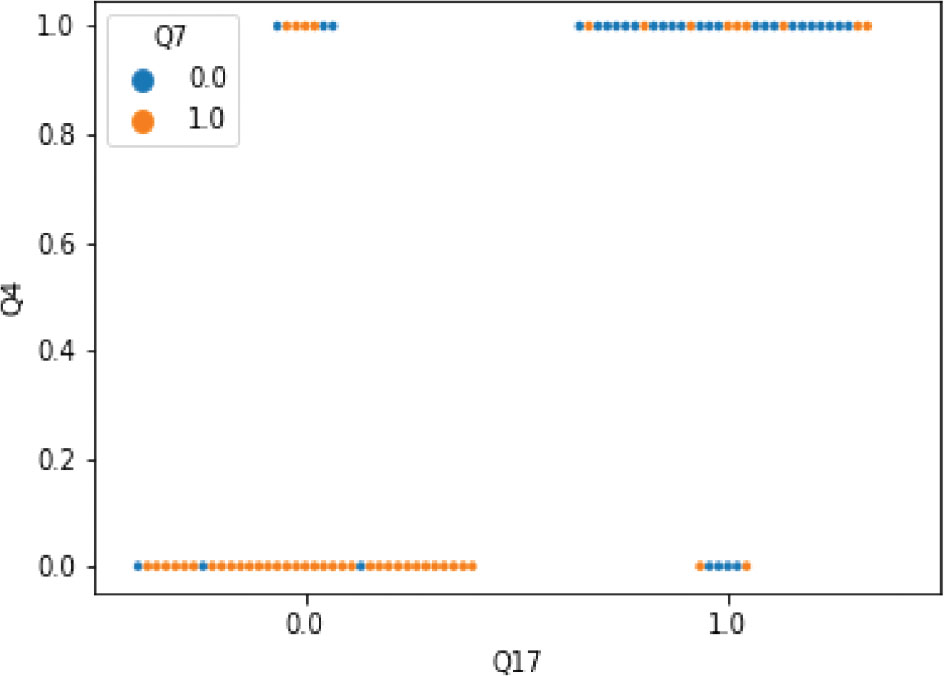
Figure 7.2
Visualization of correlation of letter reversal and academic performance to dyslexia.
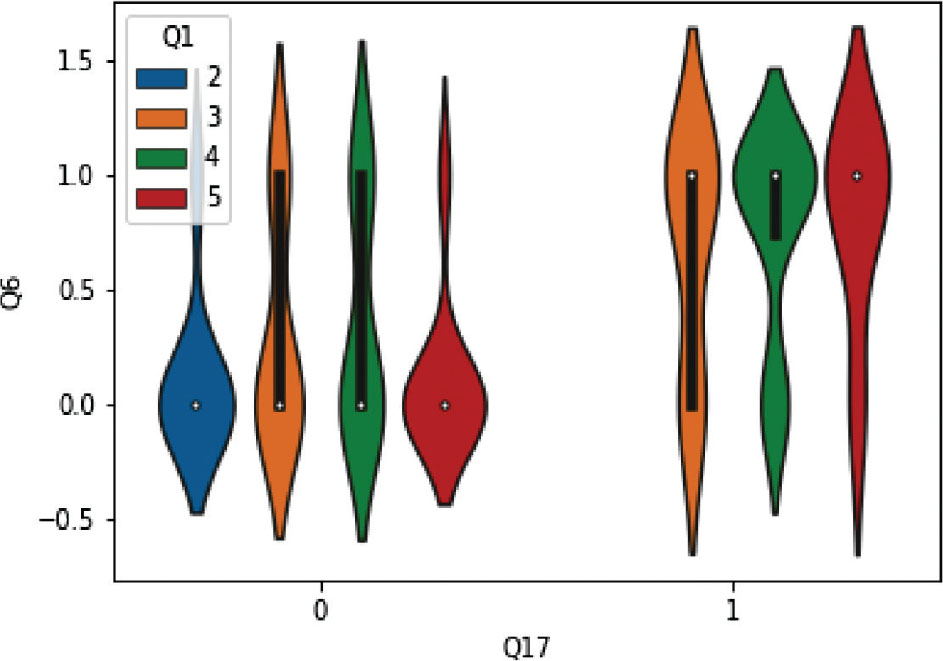
Figure 7.3
Visualization of correlation of difficulty in copying from board accurately to dyslexia in all age groups.
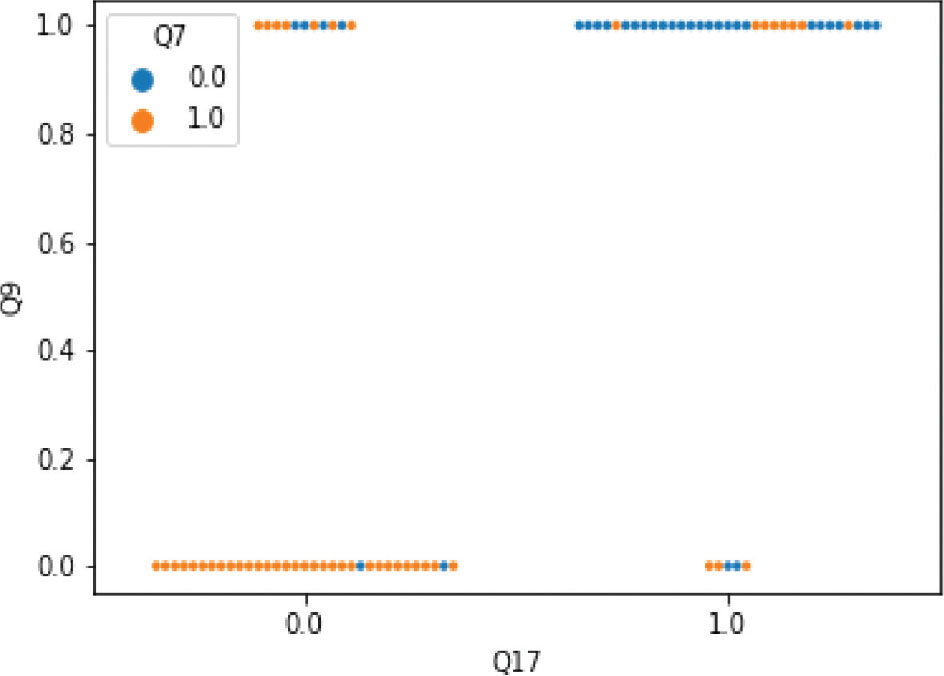
Figure 7.4
Visualization of correlation of mathematical skills and academic performance to dyslexia.
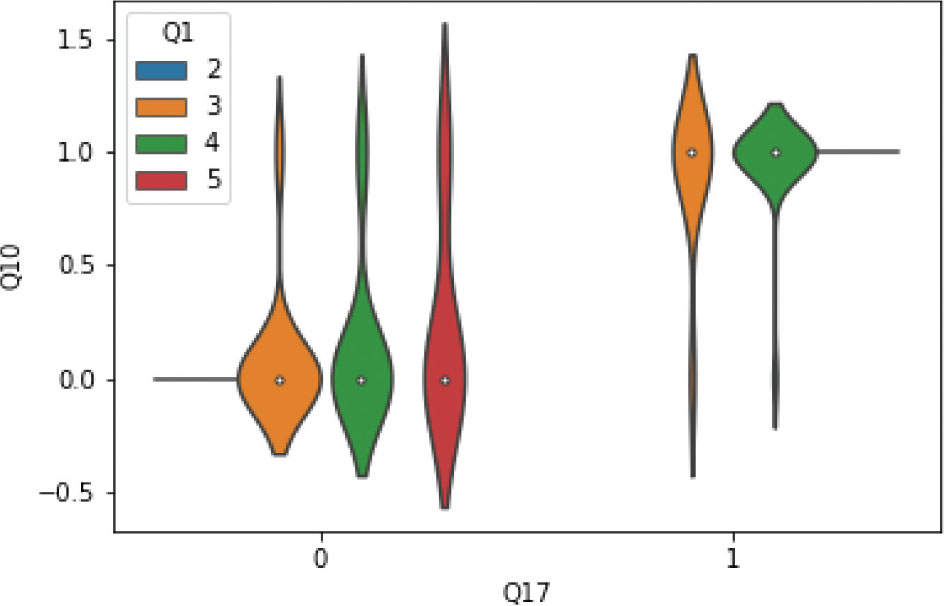
Figure 7.5
Visualization of correlation of following multiple instructions to dyslexia in all age groups.
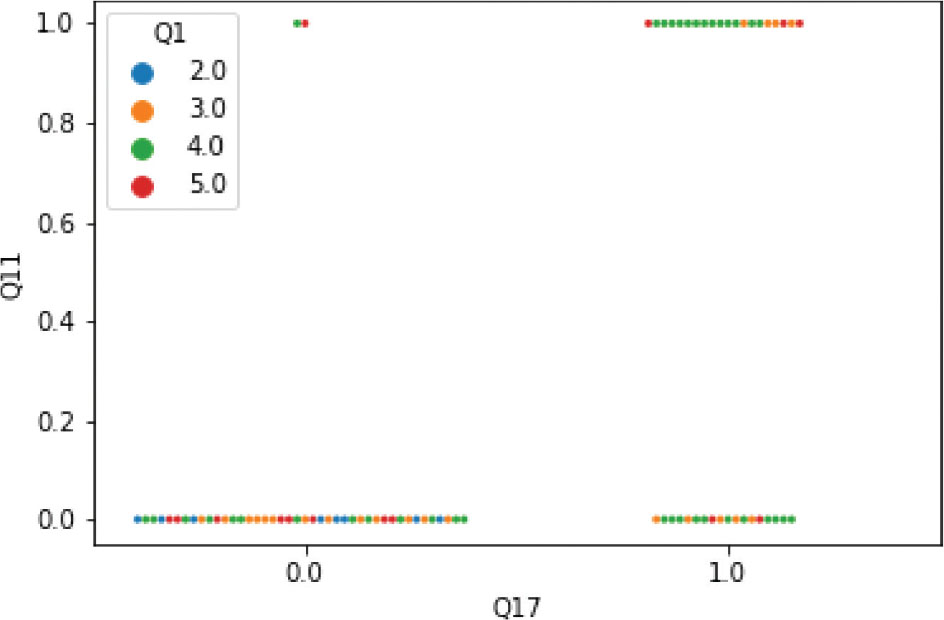
Figure 7.6
Visualization of correlation of fine motor skills to dyslexia in all age groups.
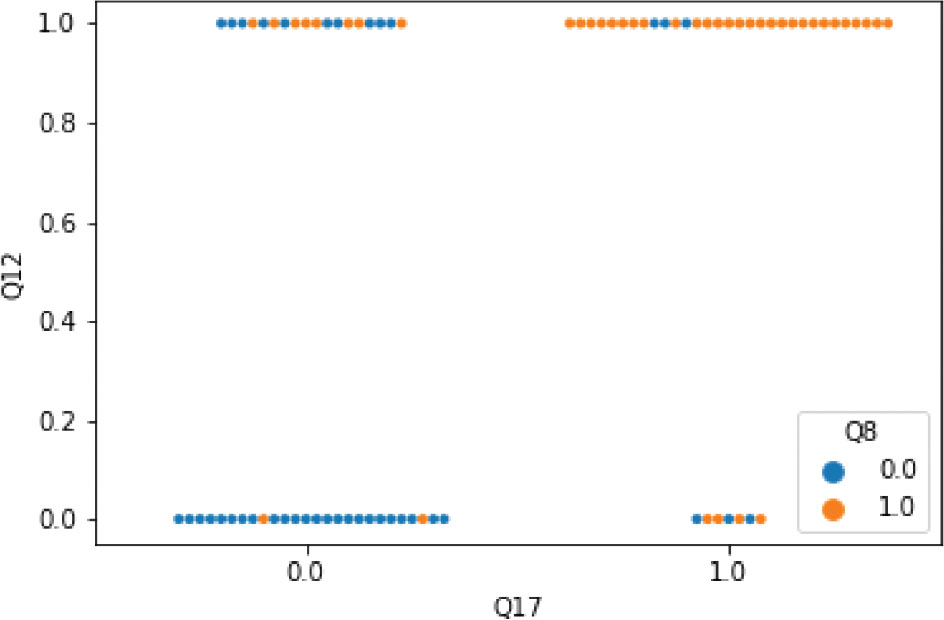
Figure 7.7
Visualization of correlation of attention deficit and reading ability to dyslexia.
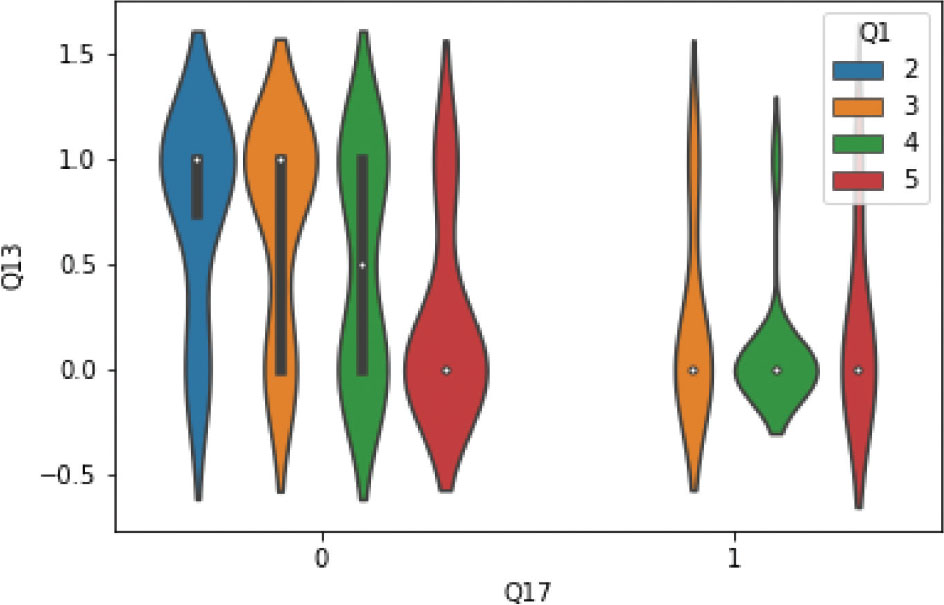
Figure 7.8
Visualization of correlation of creativity to dyslexia in all age groups.
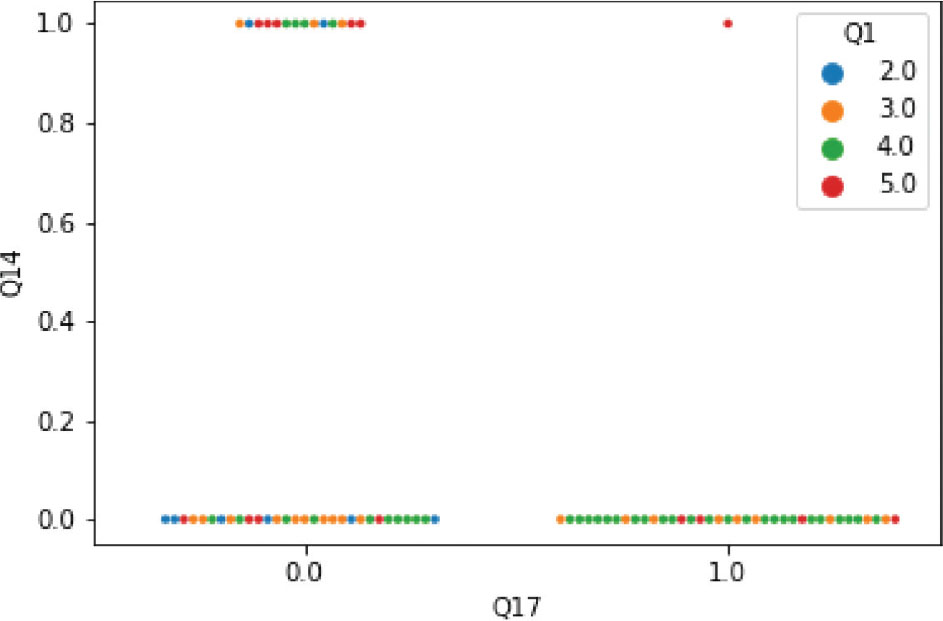
Figure 7.9
Visualization of correlation of extraordinary memory to dyslexia in all age groups.
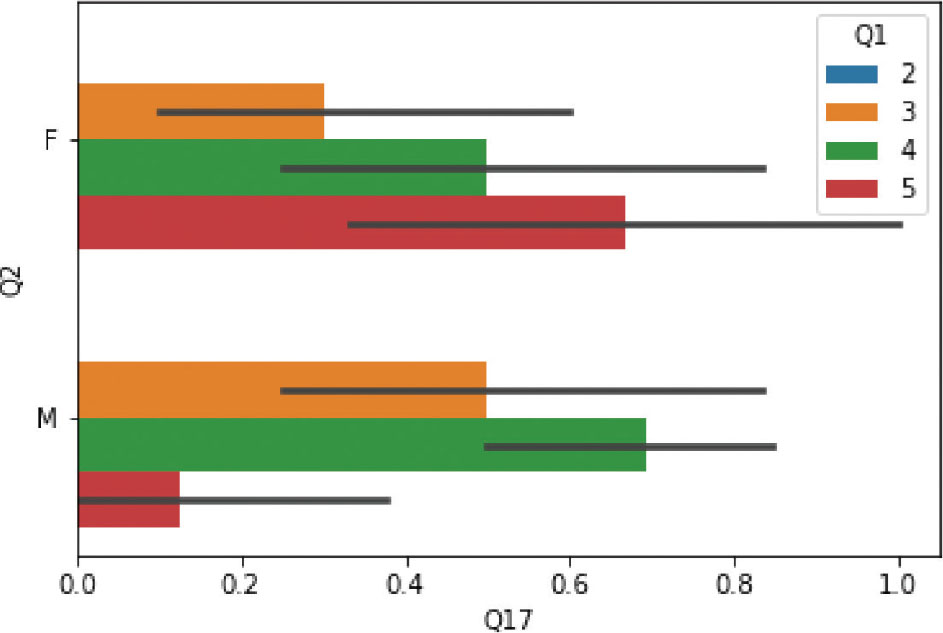
Figure 7.10
Distribution of gender and age groups for dyslexia and non-dyslexia children.