
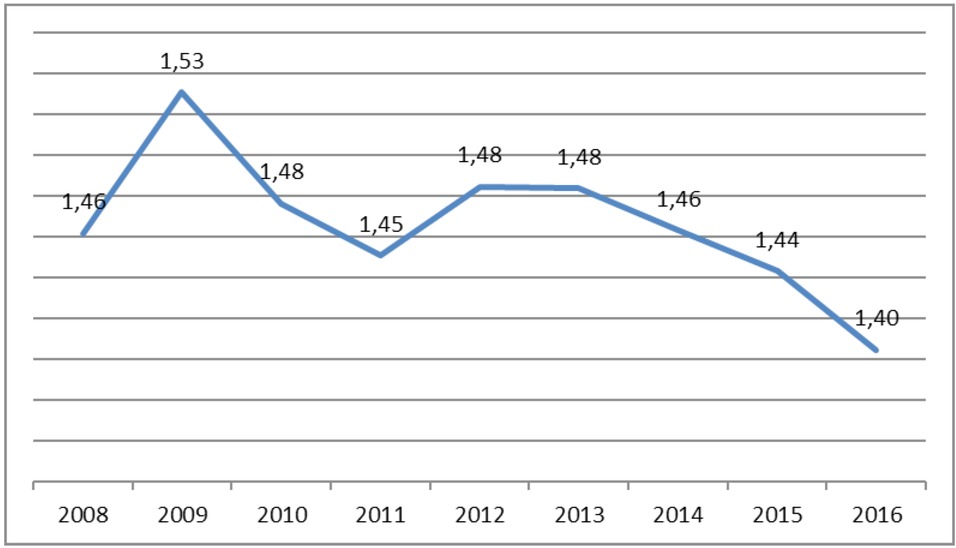
Figure 1
Ratio of public to private sector weekly earnings 2008 to 2016*
Note: * Quarter 2 returns.
Source: CSO statistical release, 2012 and August 2016: Earnings and Labour Costs Quarterly.
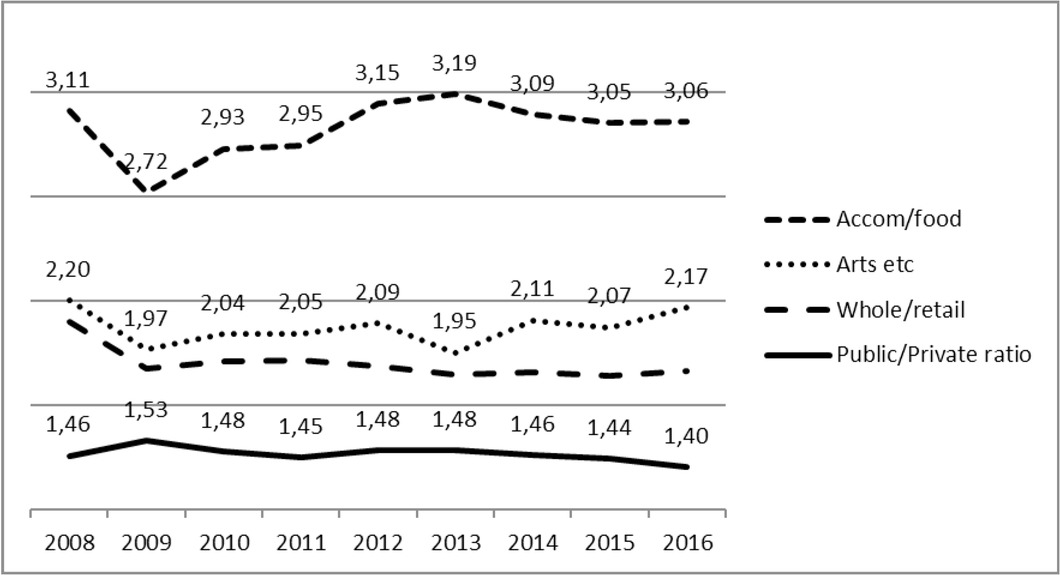
Figure 2
Ratio of weekly earnings in finance and insurance, compared to selected industrial sectors.
Source: CSO statistical release, August, 2016: Earnings and Labour Costs Quarterly.
Table 1
Studies using multivariate analysis that were conducted in the period 1994–2014
| Source | Data source | Earnings measure | Controls included | Estimation methodology | Overall earnings premium | Male premium | Female Premium |
|---|---|---|---|---|---|---|---|
| Boyle etal.,2004 | European Community Household Survey for Ireland 1994–2001 | Gross monthly wages | Occupation, educational attainment, full-time status, gender, public or private sector, nationality, age, age-squared, permanent/non-permanent job status, length of service with current employer, part-time status and size of enterprise | OLS (with interaction terms) and quantile regressions | 1994: 14.0% | 1994: 10.0% | 1994: 19.5% |
| 1995: 14.6% | 1995: 10.6% | 1995: 19.8% | |||||
| 1996: 14.2% | 1996:9.1% | 1996: 20.6% | |||||
| 1997: 9.9% | 1997: 6.5% | 1997: 14.1% | |||||
| 1998: 13.4% | 1998: 10.9% | 1998: 16.5% | |||||
| 1999: 8.3% | 1999: 5.8% | 1999: 11.1% | |||||
| 2000: 11.0% | 2000: 8.2% | 2000: 13.4% | |||||
| 2001: 12.9% | 2001: 11.4% | 2001: 14.5% | |||||
| Ernst & Young and Murphy, 2007 | National Employment Survey 2003 | Gross weekly earnings | Occupation, educational attainment, full-time status, gender, public or private sector, age, age-squared, permanent/non-permanent job status, length of service, employer, total length in employment, log of overtime hours (38+) worked, log hours worked and full-time dummy | OLS, B-O decomposition, PSM and quantile regressions | OLS: 8% | OLS: 5% | OLS: 10% |
| B–O: 10% | B–O: 7% | B–O: 13% | |||||
| PSM: 10% | PSM: 6% | PSM: 12% | |||||
| Kelly et al., 2009 | National Employment Survey 2003 and 2006 | Gross weekly earnings | Occupation, educational attainment, full-time status, gender, public or private sector, nationality, membership of a trade union, membership of a professional body, experience, experience-squared, permanent/non-permanent job status, log of overtime hours (38+) worked, log of hours worked, shift work and supervisory status | OLS and PSM | 2003 OLS: 14.1% | 2003 OLS: 12.8% | 2003 OLS: 14.9% |
| 2006 OLS: 26.6% | 2006 OLS: 26.6% | 2006 OLS: 26.5% | |||||
| 2006 PSM: 25.9% | 2006 PSM: 22.5% | 2006 PSM:25.2% | |||||
| Foley and Callaghan (2010) | National Employment Survey 2007 | Gross weekly earnings | Occupation, educational attainment, full-time status, gender, public or private sector, nationality, trade union membership, membership of a professional body, age, age-squared, permanent/non-permanent job status, length of service with current employer, total length in employment, log of overtime hours (38+) worked, log of hours worked, shift work, supervisory status and size of enterprise | OLS, B–O decomposition. Both unweighted and weighted results shown | OLS: 10.0%–14.5% | OLS: 7.2%–13.7% | OLS: 12.7%–13.9% |
| B–O: 11.5%–15.9% | B–O: 9.0%–16.6% | B–O: 13.9%–14.9% | |||||
| Results with size of firm excluded: | Results with size of firm excluded: | Results with size of firm excluded: | |||||
| OLS: 15.1%–20.1% | OLS: 12.6%–19.2% | OLS: 18.0%–21.4% | |||||
| B–O: 16.0%–20.5% | B–O: 13.7%–21.3% | B–O: 19.2%–21.2% | |||||
| CSO, 2012 | National Employment Survey 2009 and 2010 | Gross weekly earnings | Occupation, educational attainment, full-time status, gender, public or private sector, nationality, trade union membership, membership of a professional body, age, age-squared, permanent/non-permanent job status, length of service with current employer, total length in employment, log of overtime hours (38+) worked, log of hours worked, shift work, supervisory status and size of enterprise | OLS, B–O decomposition, quantile regressions | 2007 OLS: 13.9% | ||
| 2007 OLS: 13.8% | 2007 OLS: 13.0% | 2009 OLS: 13.7% | |||||
| 2009 OLS: 11.9% | 2009 OLS: 10.4% | 2010 OLS: 12.0% | |||||
| 2010 OLS: 8.5% | 2010 OLS: 5.4% | 2007 B–O: 15.1% | |||||
| 2007 B–O: 12.6% | 2007 B–O: 10.4% | 2009 B–O: 13.9% | |||||
| 2009 B–O: 12.1% | 2009 B–O: 7.1% | 2010 B–O: 12.0% | |||||
| 2010 B–O: 7.3% | 2010 B–O: 3.5% | ||||||
| Results with size of firm excluded: | Results with size of firm excluded: | Results with size of firm excluded: | |||||
| 2007 OLS: 21.4% | |||||||
| 2007 OLS: 20.1% | 2007 OLS: 19.1% | 2009 OLS: 21.1% | |||||
| 2009 OLS: 19.1% | 2009 OLS: 17.2% | 2010 OLS: 20.4% | |||||
| 2010 OLS: 17.0% | 2010 OLS: 14.5% | 2007 B–O: 21.2% | |||||
| 2007 B–O: 18.3% | 2007 B–O: 16.2% | 2009 B–O: 20.3% | |||||
| 2009 B–O: 17.2% | 2009 B–O: 12.2% | 2010 B–O: 18.2% | |||||
| 2010 B–O: 14.1% | 2010 B–O: 10.9% | ||||||
| CSO 2013 | National Employment Survey 2009 and 2010 | Gross weekly earnings (with and without public pension levy deducted) | Occupation, educational attainment, full-time status, gender, public or private sector, nationality, membership of a trade union, membership of a professional body, age, age-squared, permanent/non-permanent job status, length of service with current employer, total length in employment, log of overtime hours (38+) worked, log of hours worked, shift work, supervisory status and size of enterprise | OLS and quantile regressions | 2009 OLS: 13.5% | 2009 OLS: 12.4% | 2009 OLS: 14.2% |
| 2010 OLS: 9.7% | 2010 OLS: 7.0% | 2010 OLS: 12.9% | |||||
| Results with size of firm excluded: | Results with size of firm excluded: | Results with size of firm excluded: | |||||
| 2009 OLS: 21.7% | 2009 OLS: 20.2% | 2009 OLS: 23.5% | |||||
| 2010 OLS: 19.1% | 2010 OLS: 17.1% | 2010 OLS: 22.0% | |||||
| Pension levy deducted from gross pay | Pension levy deducted from gross pay | Pension levy deducted from gross pay | |||||
| 2009 OLS: 4.7% | 2009 OLS: 2.6% | 2009 OLS: 6.2% | |||||
| 2010 OLS: 1.3% | 2010 OLS:–2.0% | 2010 OLS: 5.1% | |||||
| Results with size of firm excluded: | Results with size of firm excluded: | Results with size of firm excluded: | |||||
| 2009 OLS: 11.1% | 2009 OLS: 8.7% | 2009 OLS: 13.7% | |||||
| 2010 OLS: 9.3% | 2010 OLS: 6.3% | 2010 OLS: 12.9% | |||||
| CSO 2017 | Matched Quarterly National Household Survey and Revenue Commissioner's earnings data 2011–2014 | Gross weekly earnings (with and without public pension levy deducted) | Occupation, educational attainment, full-time status, gender, public or private sector, nationality, membership of a trade union, membership of a professional body, age, age-squared, length of service with current employer, log of overtime hours, log of hours worked, shift work, supervisory status and size of enterprise | OLS and quantile regressions | 2011 OLS: 9.2% | 2011 OLS: 3.0% | 2011 OLS: 15.3% |
| 2014 OLS: 5.0% | 2014 OLS:–0.7% | 2014 OLS: 12.2% | |||||
| Results with size of firm excluded: | Results with size of firm excluded: | Results with size of firm excluded: | |||||
| 2011 OLS: 9.5% | 2011 OLS: 3.3% | 2011 OLS: 16.2% | |||||
| 2014 OLS: 5.3% | 2014 OLS:–1.0% | 2014 OLS: 13.5% | |||||
| Pension levy deducted from gross pay | Pension levy deducted from gross pay | Pension levy deducted from gross pay | |||||
| 2011 OLS: 2.9% | 2011 OLS:–3.4% | 2011 OLS: 9.1% | |||||
| 2014 OLS:–0.7% | 2014 OLS:–6.4% | 2014 OLS: 6.5% | |||||
| Results with size of firm excluded: | Results with size of firm excluded: | Results with size of firm excluded: | |||||
| 2011 OLS: 3.2% | 2011 OLS:–3.1% | 2011 OLS: 10.0% | |||||
| 2014 OLS:–0.4% | 2014 OLS:–6.6% | 2014 OLS: 7.8% |
[i] Note: The econometric results of the report of the Public Sector Pay Commission are not presented here as they use the same data and very similar methodologies as the previous studies outlined in the table. Asa result, the estimated results are all extremely similar to those seen herein.
Table 2
Wage gap (in percentage) in the public sector in relation to the private sector, 2004–2007 (with controls)
| Hourly gross earnings, € | Monthly gross earnings, € | ||||||
|---|---|---|---|---|---|---|---|
| All % | Male % | Female % | All % | Male % | Female % | ||
| Spain | 25 | 23 | 26 | Spain | 17 | 14 | 20 |
| Greece | 21 | 17 | 26 | Greece | 16 | 11 | 20 |
| Portugal | 20 | 19 | 22 | Ireland | 16 | 14 | 18 |
| Italy | 19 | 16 | 22 | Denmark | 15 | 5 | 26 |
| Ireland | 19 | 16 | 20 | Italy | 13 | 8 | 17 |
| Slovakia | 11 | 8 | 12 | Portugal | 11 | 7 | 14 |
| Denmark | 11 | 3 | 19 | Slovakia | 10 | 6 | 11 |
| Austria | 10 | 4 | 14 | Austria | 10 | 4 | 14 |
| France | 5 | 4 | 7 | France | 3 | –1 | 7 |
| Belgium | 5 | 3 | 7 | Belgium | 4 | –1 | 7 |
[i] Source: Giordano et al., 2011: adapted from Tables 4 and 9.
Table 3
EU countries with a positive hourly earnings gap in favour of public sector workers based on 2010 data (countries are ranked according to the size of the wage gap)
| Wage gap all | Male wage gap | Female wage gap | |
|---|---|---|---|
| % | % | % | |
| Cyprus | 21 | 20 | 19 |
| Ireland | 21 | 20 | 22 |
| Luxembourg | 20 | 23 | 16 |
| Spain | 15 | 13 | 17 |
| Belgium | 12 | 10 | 13 |
| Portugal | 12 | 11 | 12 |
| Italy | 11 | 6 | 15 |
| Denmark | 10 | 8 | 13 |
| Poland | 7 | 9 | 2 |
| Greece | 8 | 10 | 6 |
| Austria | 6 | 7 | 5 |
| Lithuania | 5 | 12 | –3 |
| Slovenia | 5 | 8 | 2 |
| EU average | 4 | 4 | 3 |
[i] Note: Countries with a positive hourly earnings gap in favour of private sector workers: Netherlands, UK, Malta, France, Czech Republic, Romania, Finland, Latvia, Bulgaria, Slovak Republic, Germany, Estonia and Hungary.
Source: De Castro et al., 2013: tables 2 and 3 (Economic Papers 508, Oct. 2013, European Commission).