
Figure 1.
Figure 2.
Figure 3.
Figure 4.
Figure 5.
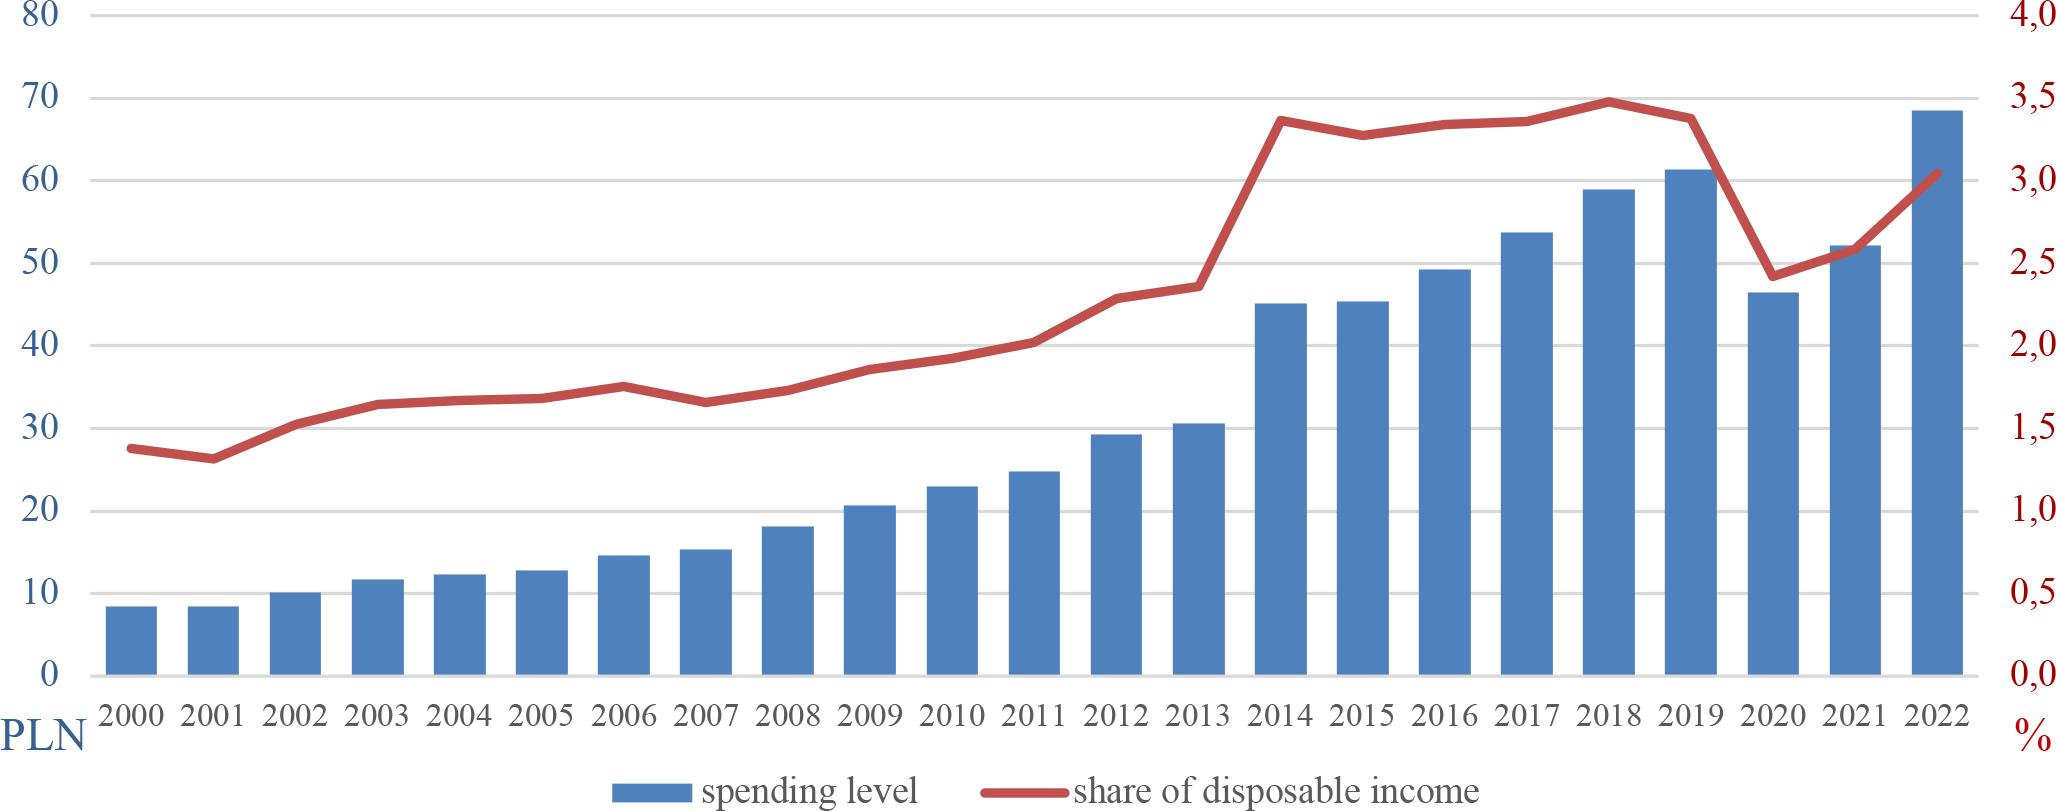
Figure 6.
Figure 7.

Figure 8.
Revenues from catering activities in the years 2020–2022 (Source: Own study analysis based on CSO, 2022)
| Specification (in PLN million) | 2020 | 2021 | 2022 |
|---|---|---|---|
| Total revenue | 37,645.6 | 48,680.6 | 64,643.4 |
| From the sale of goods | 4,592.1 | 5,569.2 | 7,848.2 |
| From catering production | 32,596.4 | 42,564.8 | 56,107.2 |
| From other activities | 457.1 | 546.6 | 688.0 |
The level of expenditures on food services and accommodation (in PLN) in households according to the education level of the household representative from 2018 to 2022 (Source: Own calculations based on GUS household budgets)
| Specification | 2019 | 2020 | 2021 | 2022 |
|---|---|---|---|---|
| Unit of measure | PLN | |||
| At most primary school education | 38 | 24 | 27 | 34 |
| Basic vocational education | 36 | 26 | 29 | 45 |
| Secondary education | 58 | 39 | 46 | 60 |
| Higher education | 104 | 81 | 91 | 111 |
Turnover in catering establishments in 2023 (Source: Own study analysis based on ARC Rynek Opinia & FOR Restaurant, 2023)
| Voivodship | Turnover dynamics | Turnover remained unchanged | ||
|---|---|---|---|---|
| Dolnośląskie Voivodship | 38% | |||
| Kujawsko-Pomorskie Voivodship | 46% | |||
| Lubelskie Voivodship | 36% | |||
| Lubuskie Voivodship | 44% | |||
| Łódzkie Voivodship | 30% | |||
| Małopolskie Voivodship | 35% | |||
| Mazowieckie Voivodship | 30% | |||
| Opolskie Voivodship | 38% | |||
| Podkarpackie Voivodship | 36% | |||
| Podlaskie Voivodship | 36% | |||
| Pomorskie Voivodship | 46% | |||
| Śląskie Voivodship | 35% | |||
| Świętokrzyskie Voivodship | 30% | |||
| Warmińsko-Mazurskie Voivodship | 46% | |||
| Wielkopolskie Voivodship | 44% | |||
| Zachodniopomorskie Voivodship | 44% | |||