
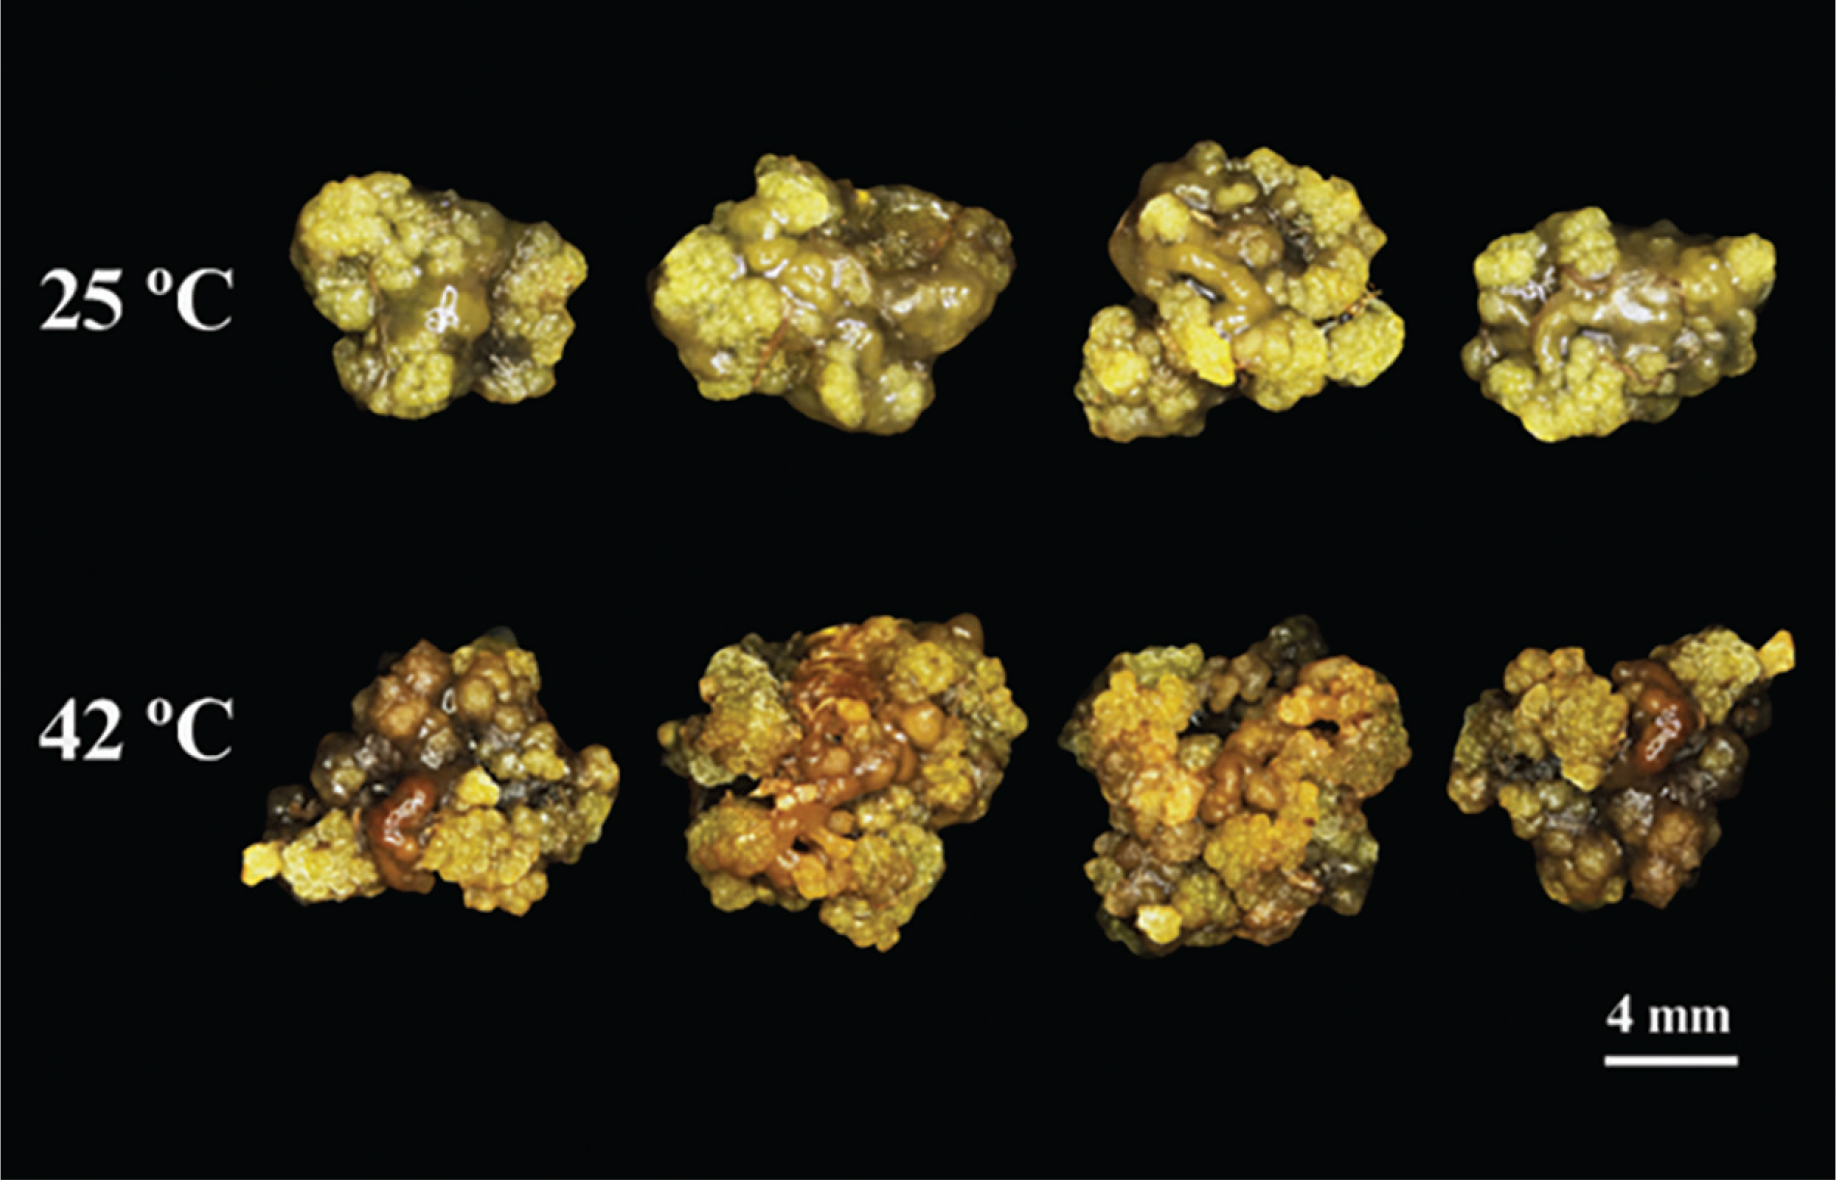
Figure 1.
Effects of heat stress (25 and 42°C) on growth, physiological, biochemical, and antioxidant-related parameters of B. monnieri callus cultures. Values are presented as mean ± SD from five independent biological replicates (n = 5). Differences between treatments were evaluated using an independent samples t-test, and statistical significance was considered at p < 0.05. SD, standard deviation.
Table 1.
Growth performance, biochemical traits, phenolic and flavonoid contents, and antioxidant activity of B. monnieri callus cultures under different temperature conditions (25 and 42°C).
| Characteristics | Temperatures | p-value | |
|---|---|---|---|
| 25°C | 42°C | ||
| Survival percentage (%) | 100.00 ± 0.00* | 100.00 ± 0.00 | NA |
| Response percentage (%) | 100.00 ± 0.00 | 100.00 ± 0.00 | NA |
| Callus length (mm) | 9.71 ± 0.43 | 11.26 ± 0.28 | 0.017 |
| Callus width (mm) | 7.26 ± 0.29 | 8.47 ± 0.19 | 0.009 |
| FW (g) | 0.11 ± 0.01 | 0.11 ± 0.00 | 0.933 |
| DW (g) | 0.01 ± 0.00 | 0.01 ± 0.00 | 0.012 |
| MDA (μmol · g−1 FW) | 0.04 ± 0.00 | 0.04 ± 0.00 | 0.621 |
| EL (%) | 60.22 ± 5.16 | 72.91 ± 2.13 | 0.053 |
| TPC (mg GAE · g−1 extract) | 38.87 ± 1.26 | 55.72 ± 2.25 | 0.001 |
| TFC (mg QE · g−1 extract) | 118.25 ± 1.83 | 150.75 ± 2.78 | 0.001 |
| IC50 by DPPH (μg · mL−1) | 145.70 ± 0.46 | 79.16 ± 2.99 | 0.001 |
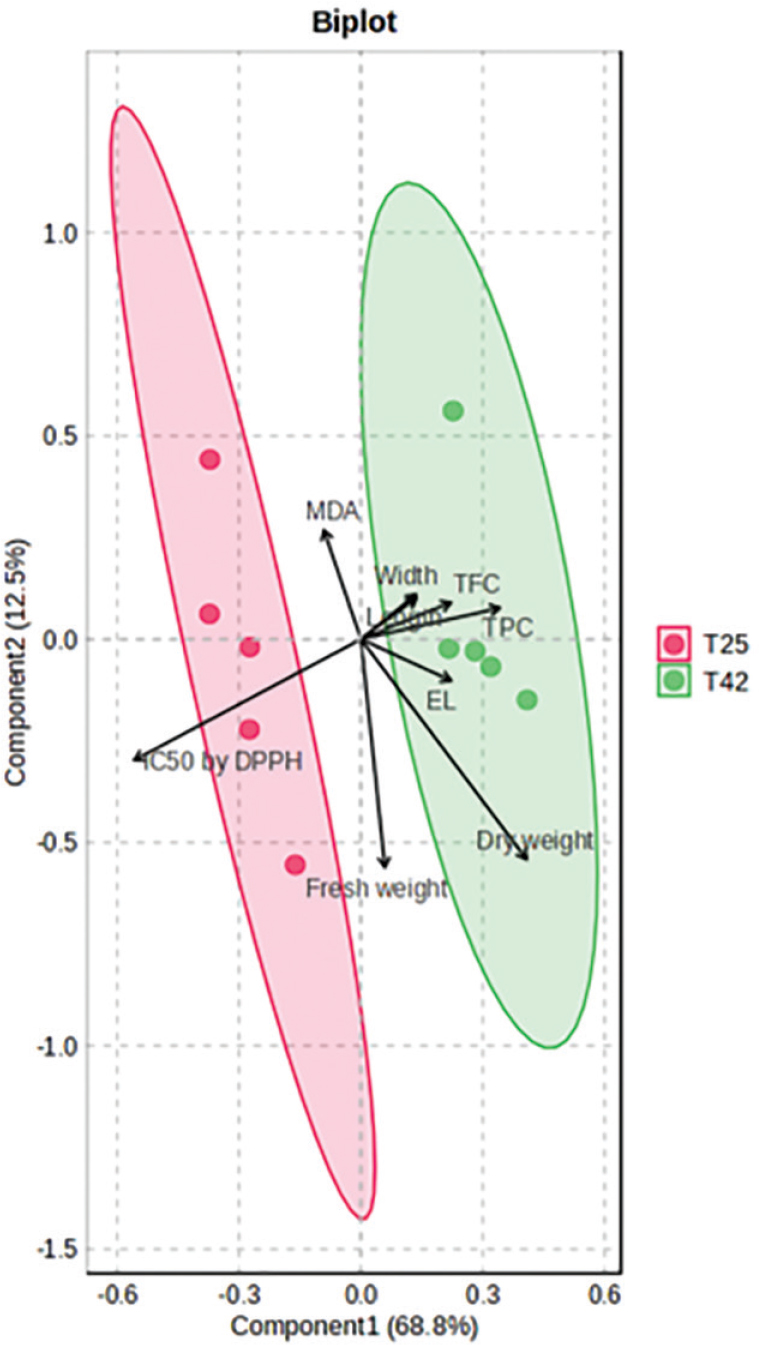
Figure 2.
PLS-DA biplot showing the distribution of B. monnieri callus samples cultured under control (25°C; T25) and heat-stress (42°C; T42) conditions based on growth, physiological, biochemical, and antioxidant-related parameters. Each point represents an independent biological replicate (n = 5 per treatment). The plot was generated as an exploratory multivariate analysis to visualise treatment-associated variation among measured traits. EL, electrolyte leakage; MDA, malondialdehyde; PLS-DA, partial least squares discriminant analysis; TFC, total flavonoid content; TPC, total phenolic content.
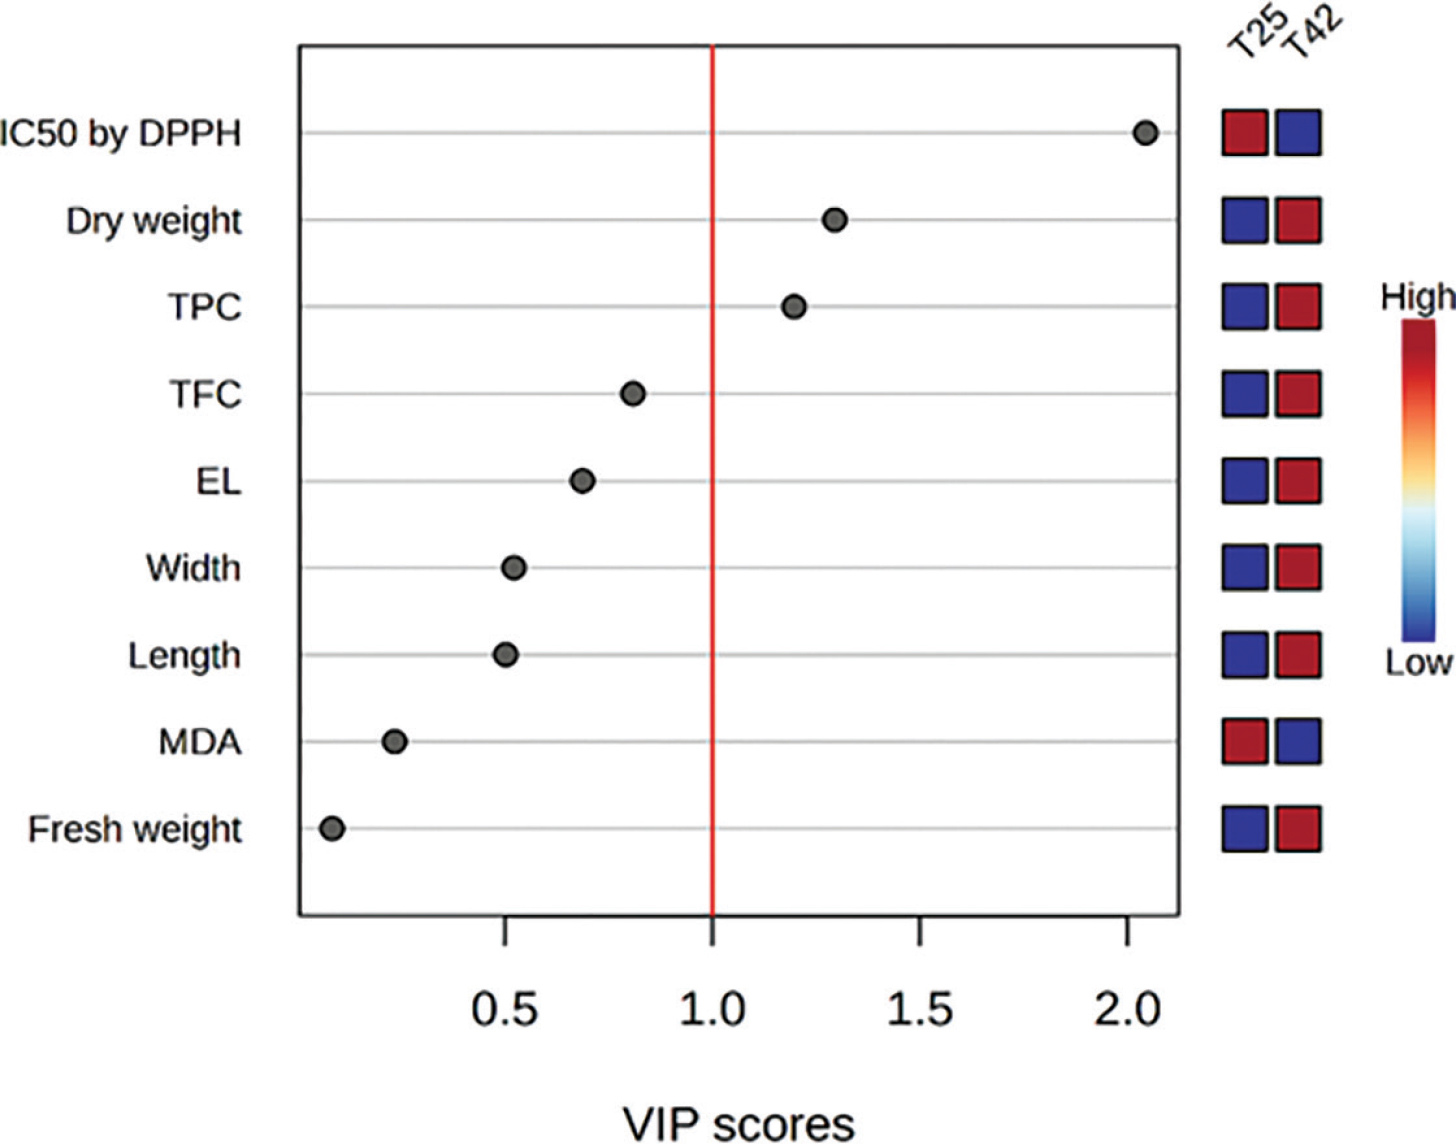
Figure 3.
VIP scores derived from the PLS-DA model. Variables with higher VIP scores contributed more strongly to the separation between callus cultures grown at 25°C (T25) and 42°C (T42). IC50 by DPPH, concentration required to inhibit 50% of DPPH radicals; DPPH, 2,2-diphenyl-1-picrylhydrazyl; EL, electrolyte leakage; MDA, malondialdehyde; PLS-DA, partial least squares discriminant analysis; TFC, total flavonoid content; TPC, total phenolic content; VIP, variable importance in projection.
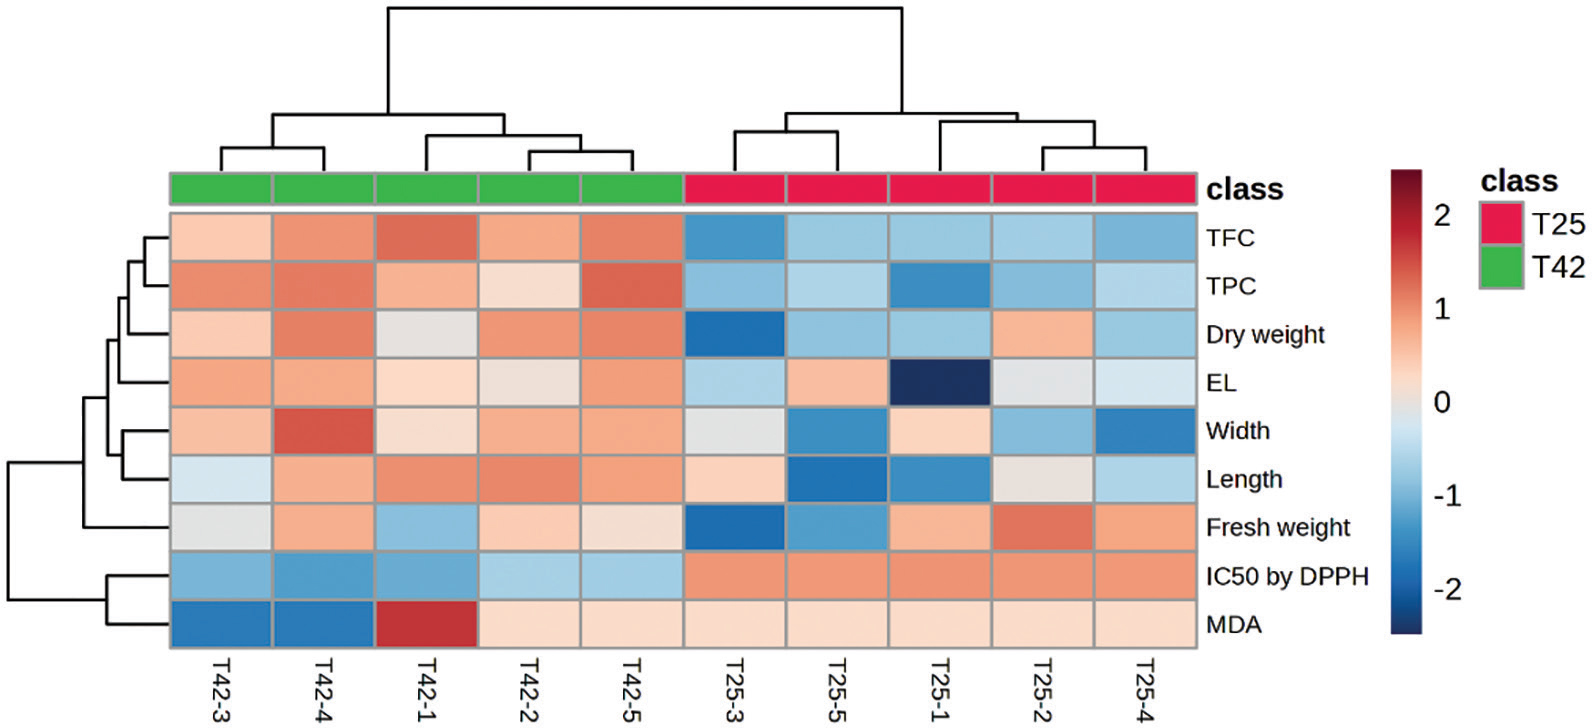
Figure 4.
Hierarchical clustering heatmap illustrating variation patterns of growth, physiological, biochemical, and antioxidant-related parameters in B. monnieri callus cultures cultured at 25°C (T25) and 42°C (T42). Data were standardised using row-wise scaling before clustering. Red and blue colours indicate relatively high and low values, respectively. Each column represents an independent biological replicate (n = 5). IC50 by DPPH, concentration required to inhibit 50% of DPPH radicals; DPPH, 2,2-diphenyl-1-picrylhydrazyl; EL, electrolyte leakage; MDA, malondialdehyde; TFC, total flavonoid content; TPC, total phenolic content.