
Table 1.
Spectral indices used in this study.
| Abbreviation | Spectral index | Formula | Ref. |
|---|---|---|---|
| NDVI | Normalised difference vegetable index | NDVI = (RNIR—RRed)/(RNIR + RRed) | Rouse et al. (1974) |
| NDRE | Normalised difference red-edge index | NDRE = (R790—R720)/(R790 + R720) | Barnes et al. (2000) |
| SRPI | Simple ratio pigment index | SRPI = R430/R680 | Peñuelas et al. (1995) |
| NPCI | Normalised pigment chlorophyll index | NPCI = (R680—R430)/(R680 + R430) | Peñuelas et al. (1994) |
| Ctr1 | Carter index 1 | Ctr1 = R695/R420 | Carter (1994) |
| SIPI | Structure-intensive pigment index | SIPI = (R790—R450)/(R790 + R650) | Peñuelas et al. (1995) |
| R400 | – | R400 = 1/R400—1/R600 | This study |
| R425 | – | R425 = 1/R425—1/R600 | This study |
| R450 | – | R450 = 1/R450—1/R600 | This study |
| R475 | – | R475 = 1/R475—1/R600 | This study |
| R500 | – | R500 = 1/R500—1/R600 | This study |
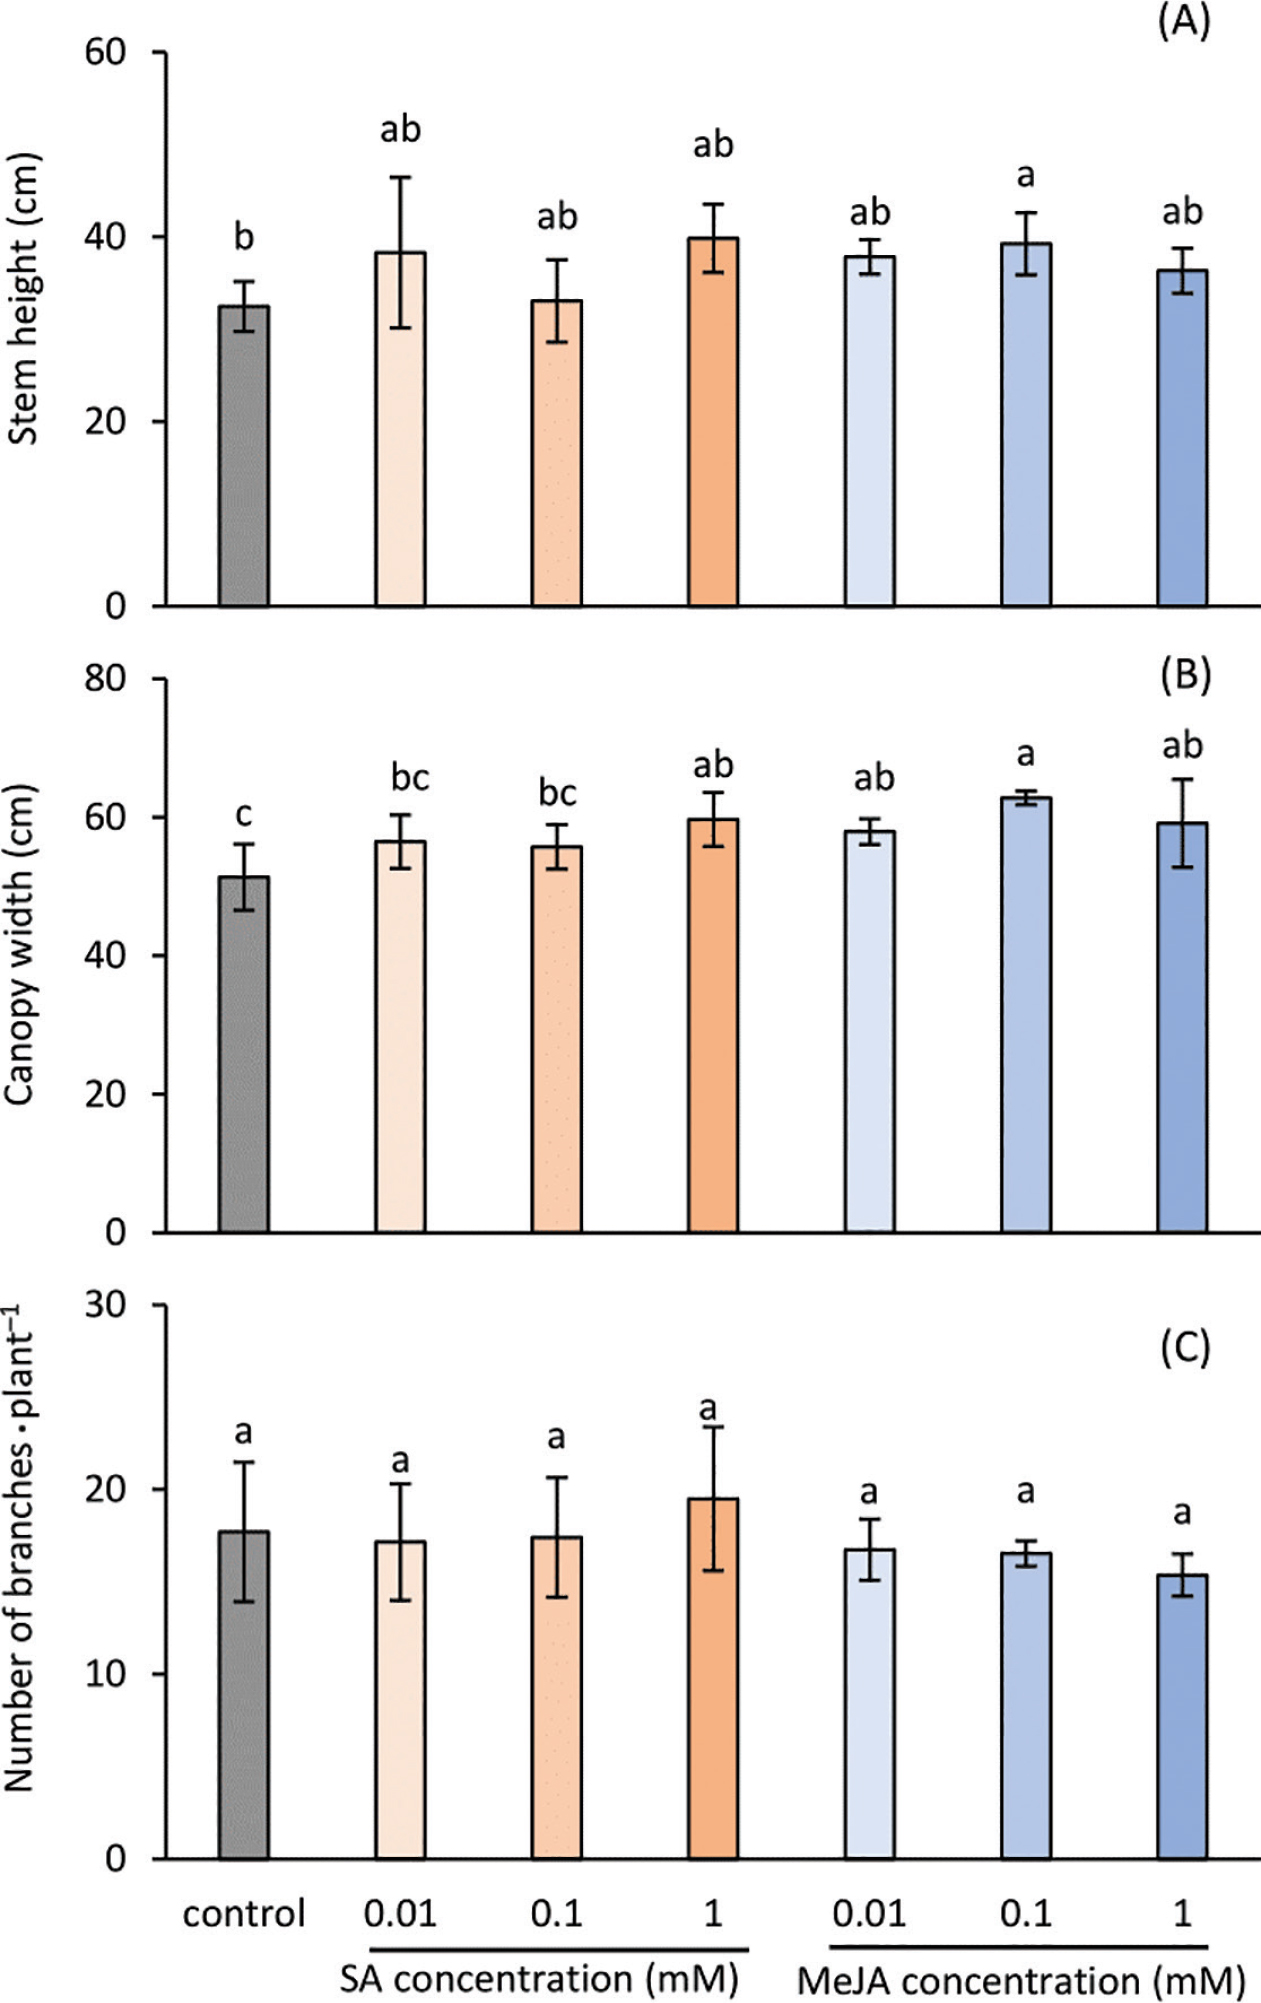
Figure 1.
Growth of rosemary after treating with SA or MeJA: (A) stem height, (B) canopy width, and (C) number of branches · plant−1. Bars sharing the same letter indicated no significant difference (Tukey’s HSD test, p < 0.05). Vertical error bars show ± standard deviation. HSD, honestly significant difference; MeJA, methyl jasmonate; SA, salicylic acid.
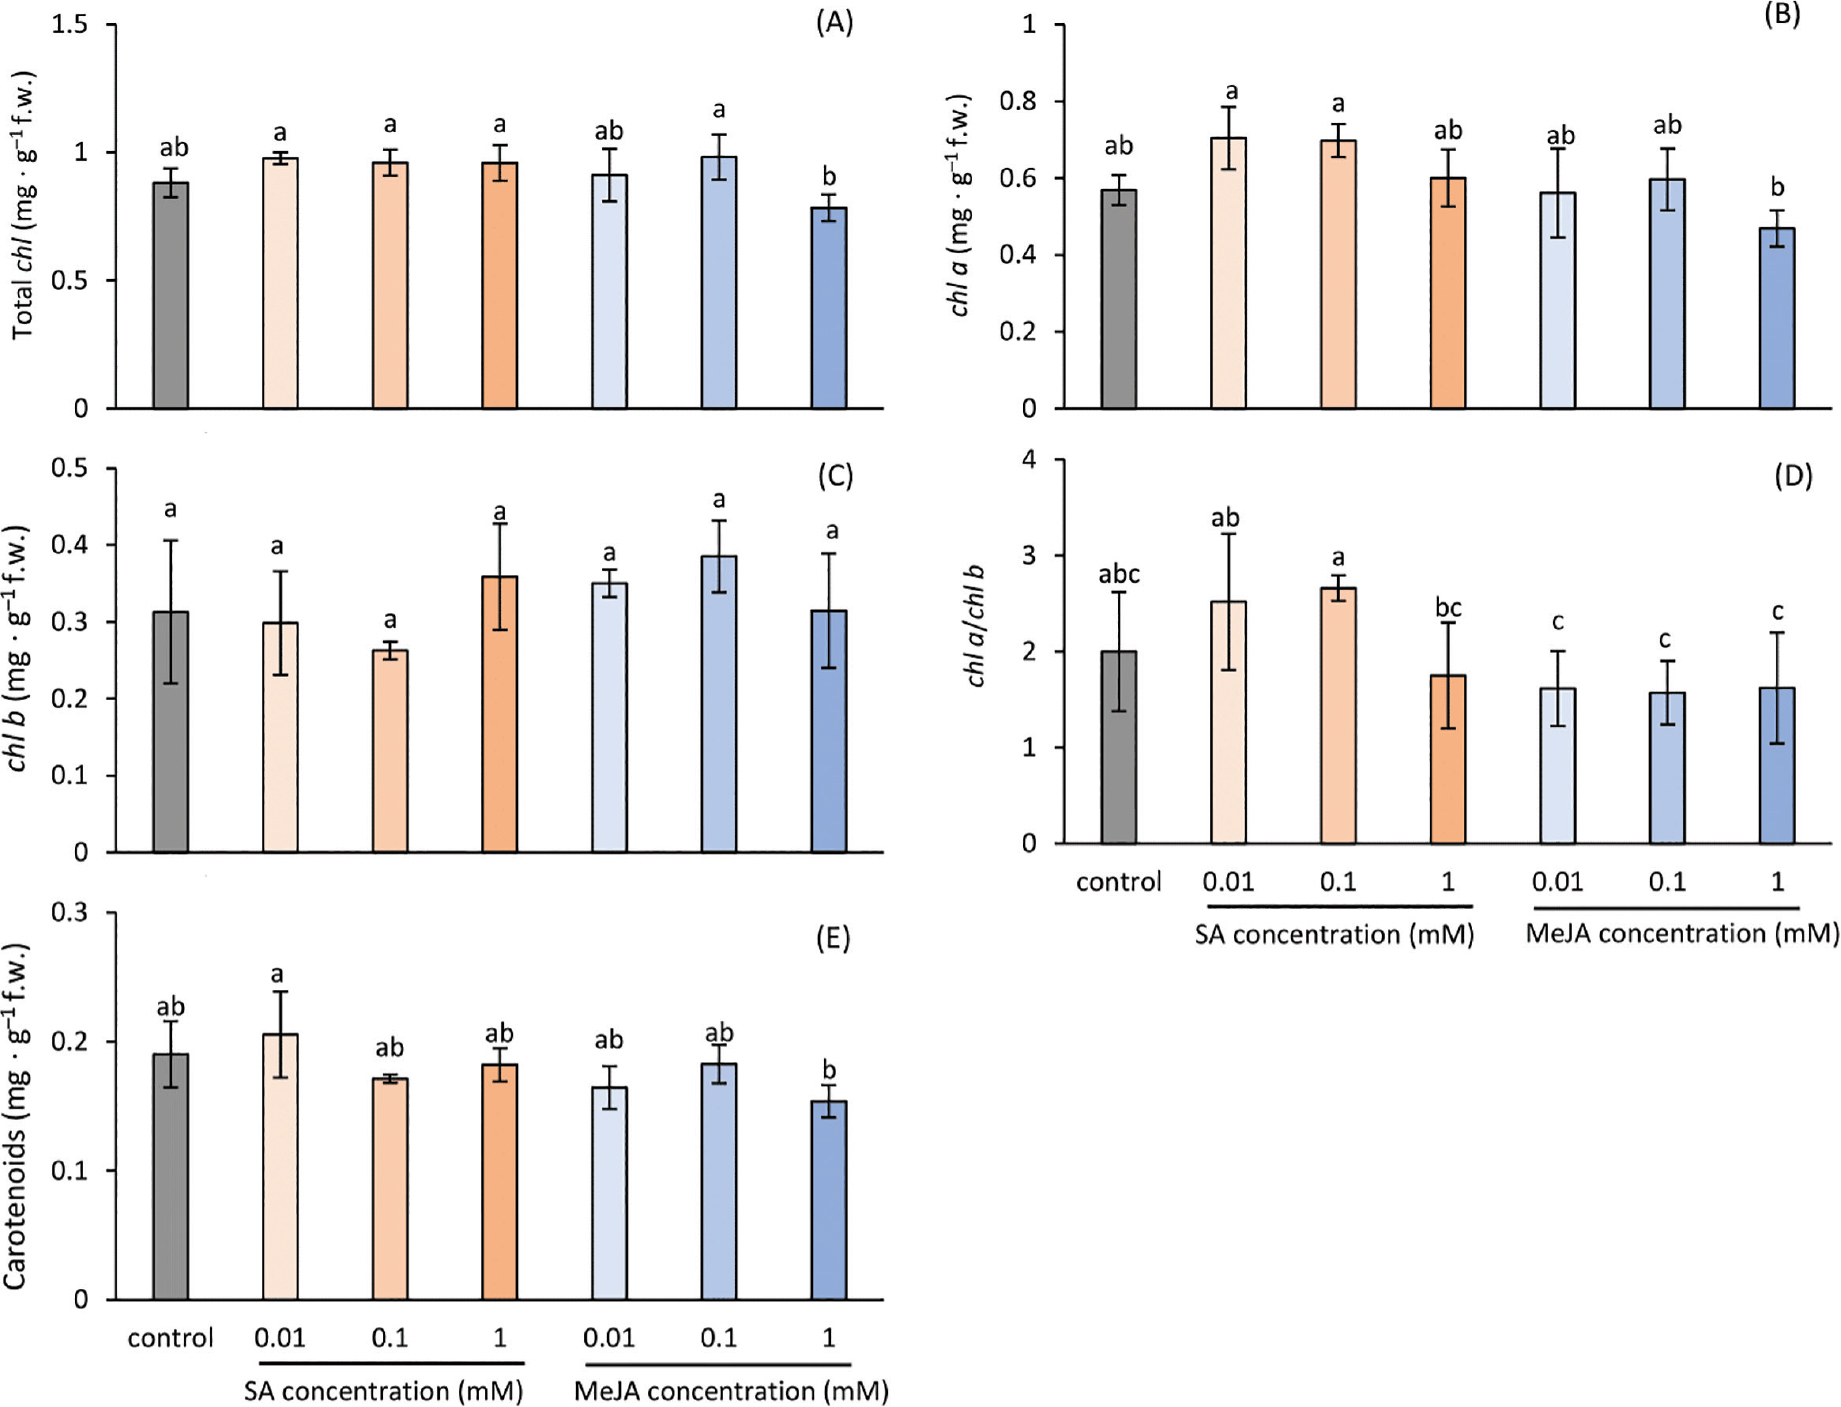
Figure 2.
Photosynthetic pigments of rosemary after treating with SA or MeJA: (A) total chlorophyll (total chl), (B) chlorophyll a (chl a), (C) chlorophyll b (chl b), (D) chl a/chl b, and (E) carotenoid content. Bars sharing the same letter indicated no significant difference (Tukey’s HSD test, p < 0.05). Vertical error bars show ± standard deviation. HSD, honestly significant difference; MeJA, methyl jasmonate; SA, salicylic acid.
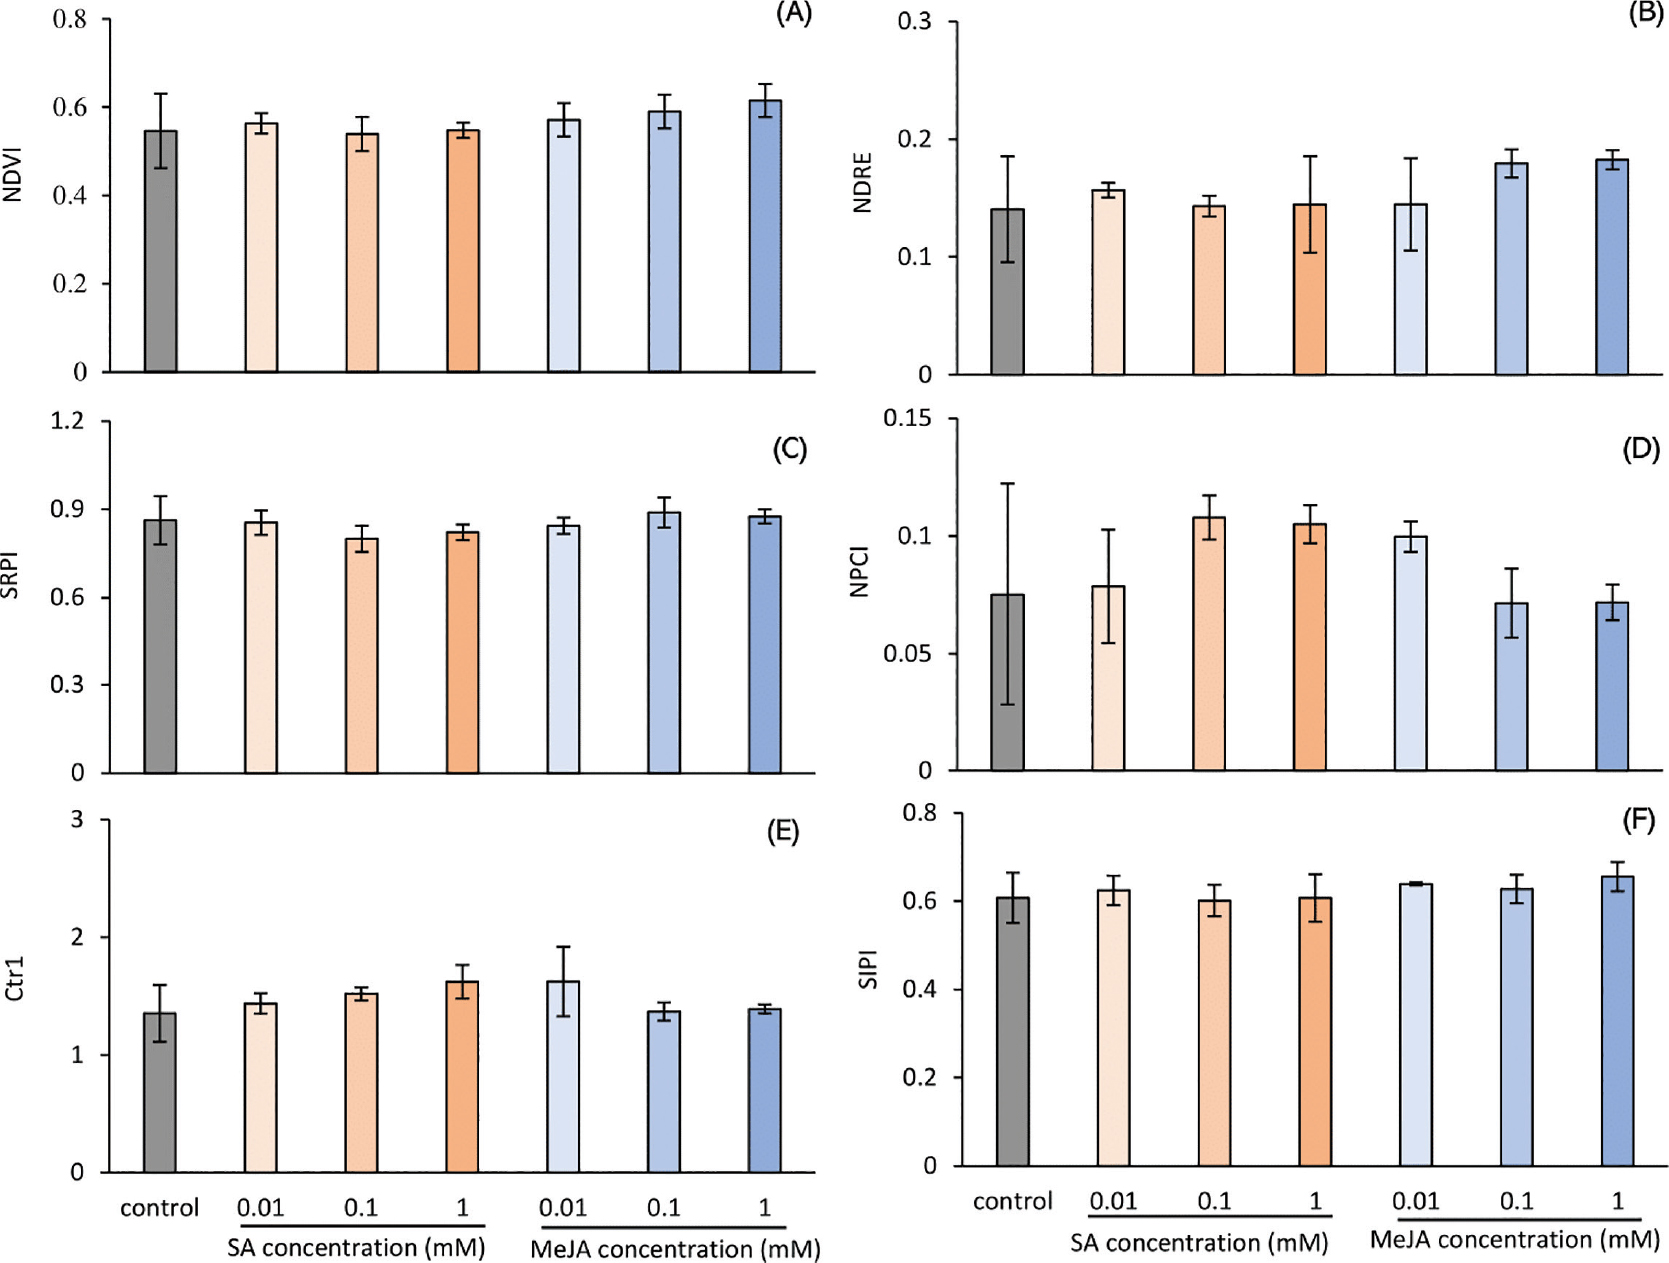
Figure 3.
Different spectral indices of rosemary treated with SA or MeJA: (A) NDVI, (B) NDRE, (C) SRPI, (D) NPCI, (E) Ctr1, and (F) SIPI. According to Tukey’s HSD test, all data had non-significant differences at p < 0.05. Vertical error bars show ± standard deviation. Ctr1, Carter index 1; HSD, honestly significant difference; MeJA, methyl jasmonate; NDRE, normalised difference red edge index; NDVI, normalised difference vegetation index; NPCI, normalised pigment chlorophyll index; SA, salicylic acid; SIPI, structure-insensitive pigment index; SRPI, simple ratio pigment index.
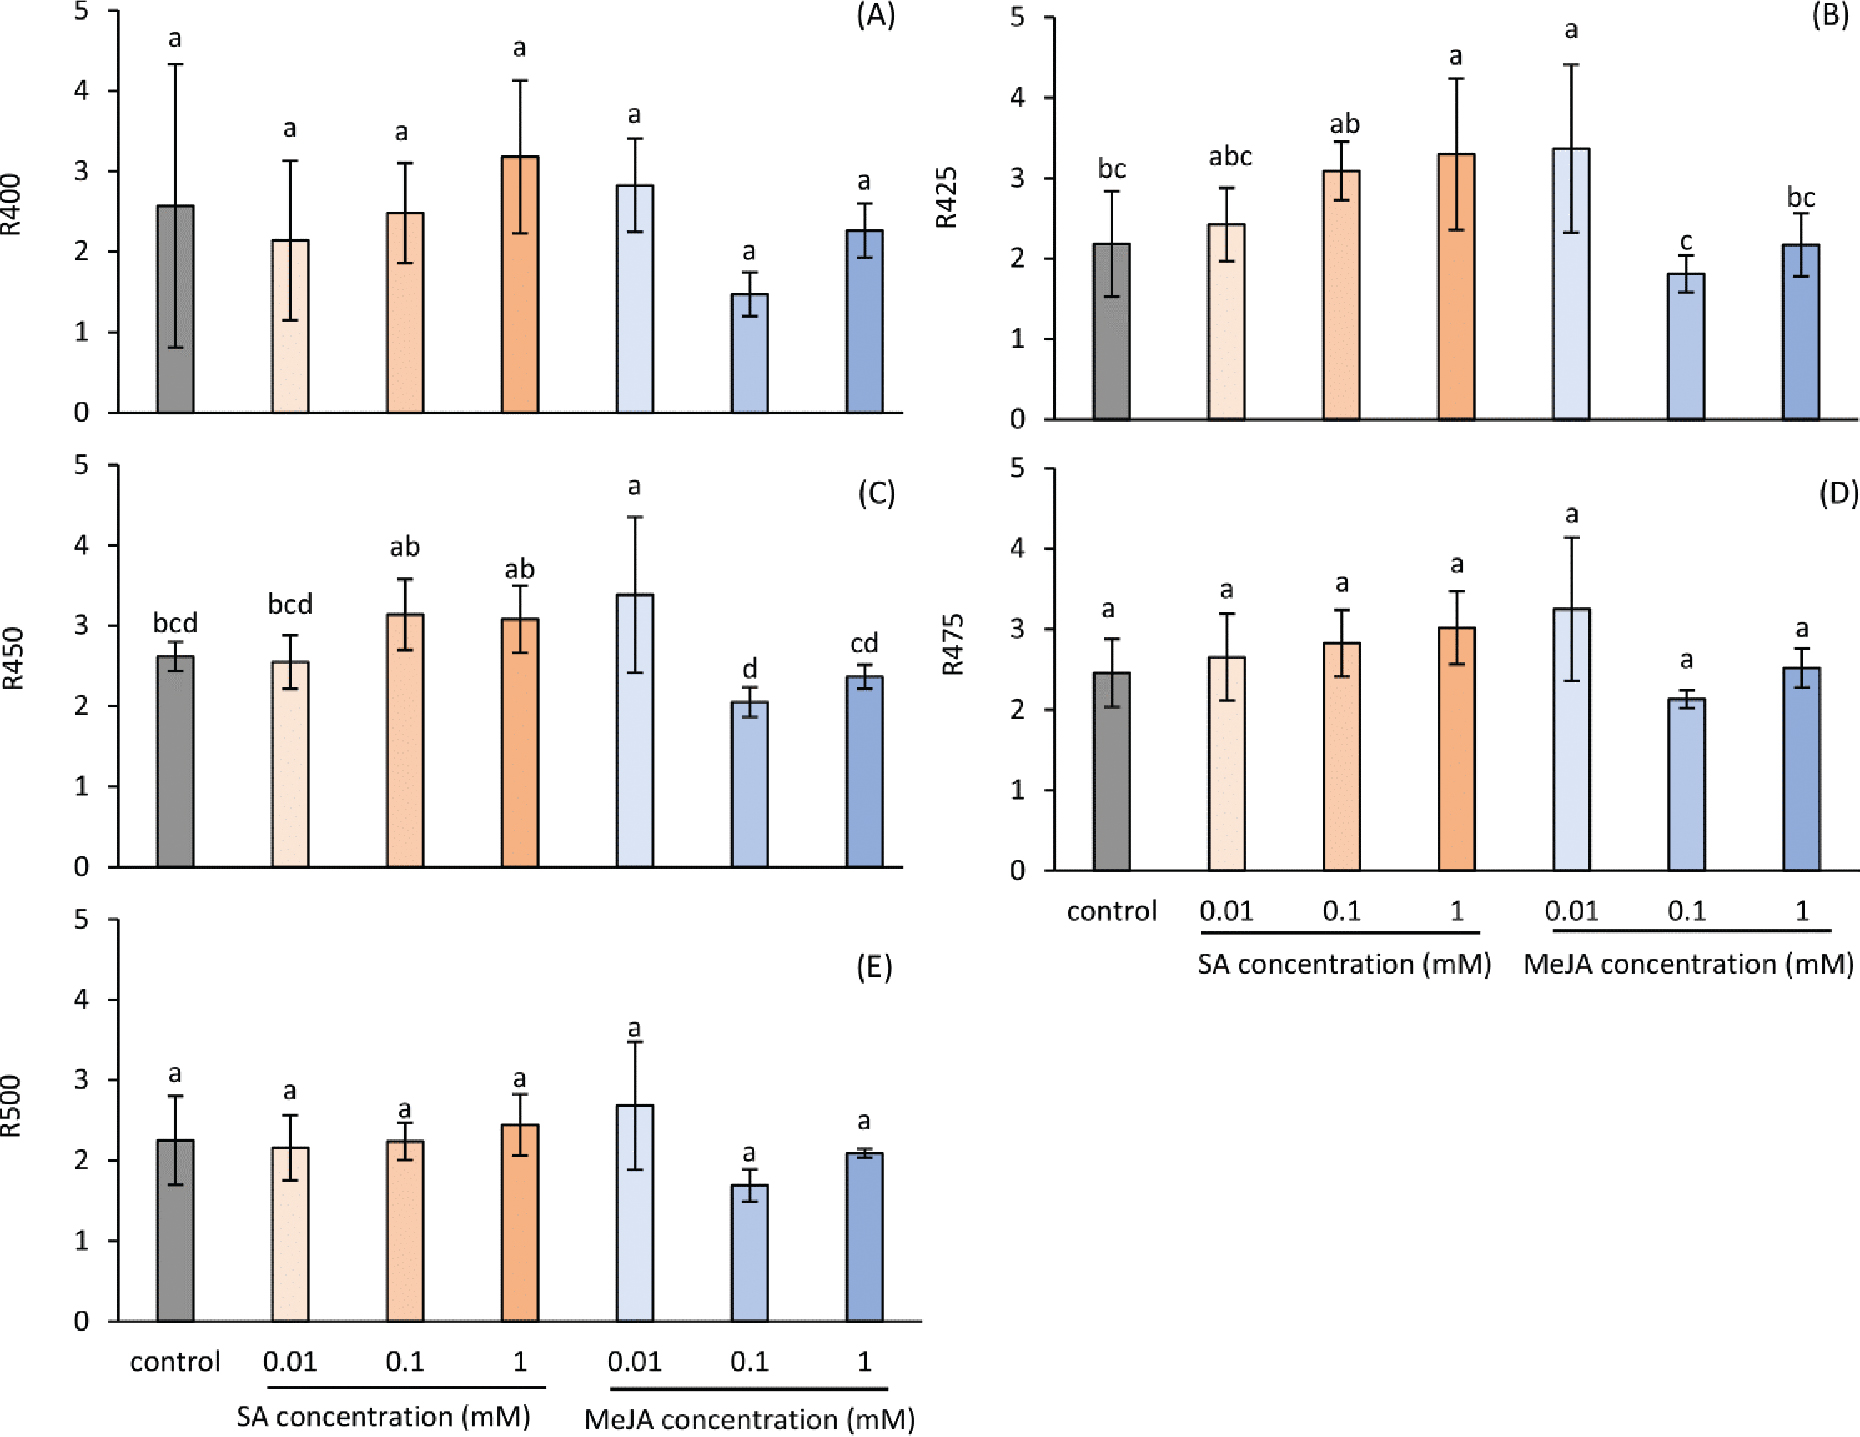
Figure 4.
Spectral indices related to reflectance between 400 nm and 500 nm of rosemary treated with SA or MeJA: (A) R400, (B) R425, (C) R450, (D) R475, and (E) R500. Bars sharing the same letter indicated no significant difference (Tukey’s HSD test, p < 0.05). Vertical error bars show ± standard deviation. HSD, honestly significant difference; MeJA, methyl jasmonate; SA, salicylic acid.
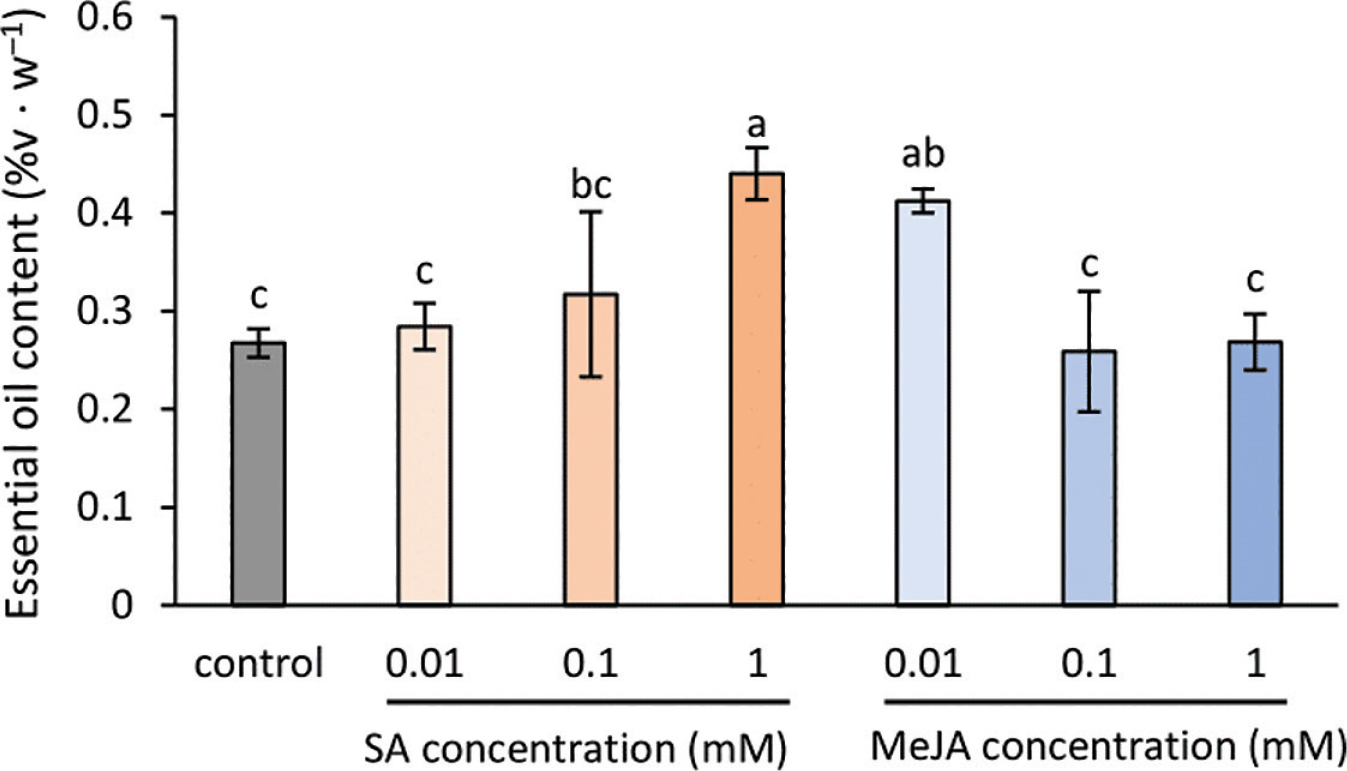
Figure 5.
Essential oil content of rosemary treated with SA or MeJA. Bars sharing the same letter indicated no significant difference (Tukey’s HSD test, p < 0.05). Vertical error bars show ± standard deviation. HSD, honestly significant difference; MeJA, methyl jasmonate; SA, salicylic acid.
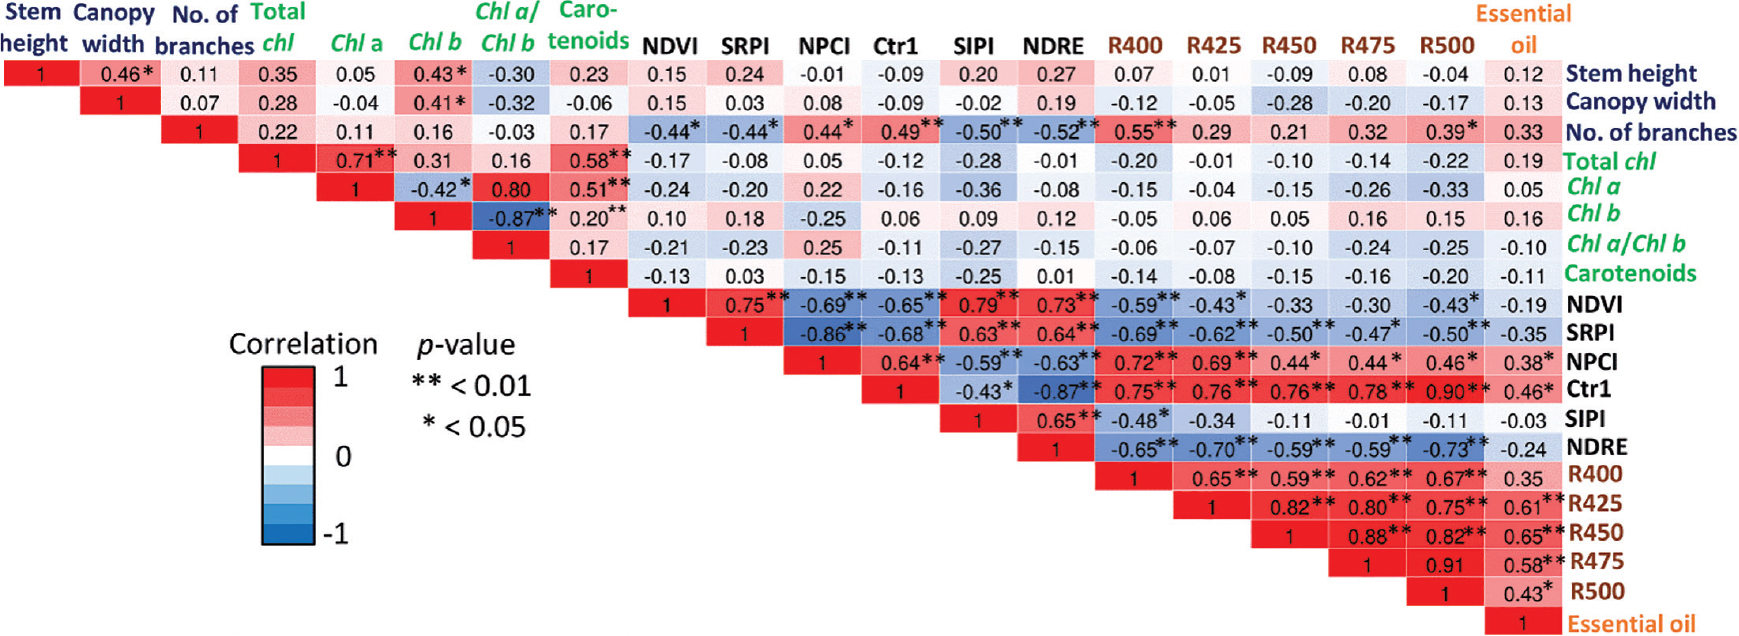
Figure 6.
Heatmap of Pearson’s correlation coefficients for growth, photosynthetic pigments, spectral indices, and essential oil content in rosemary treated with SA or MeJA. Red and blue colour gradients represent positive and negative correlations, respectively. MeJA, methyl jasmonate; SA, salicylic acid.
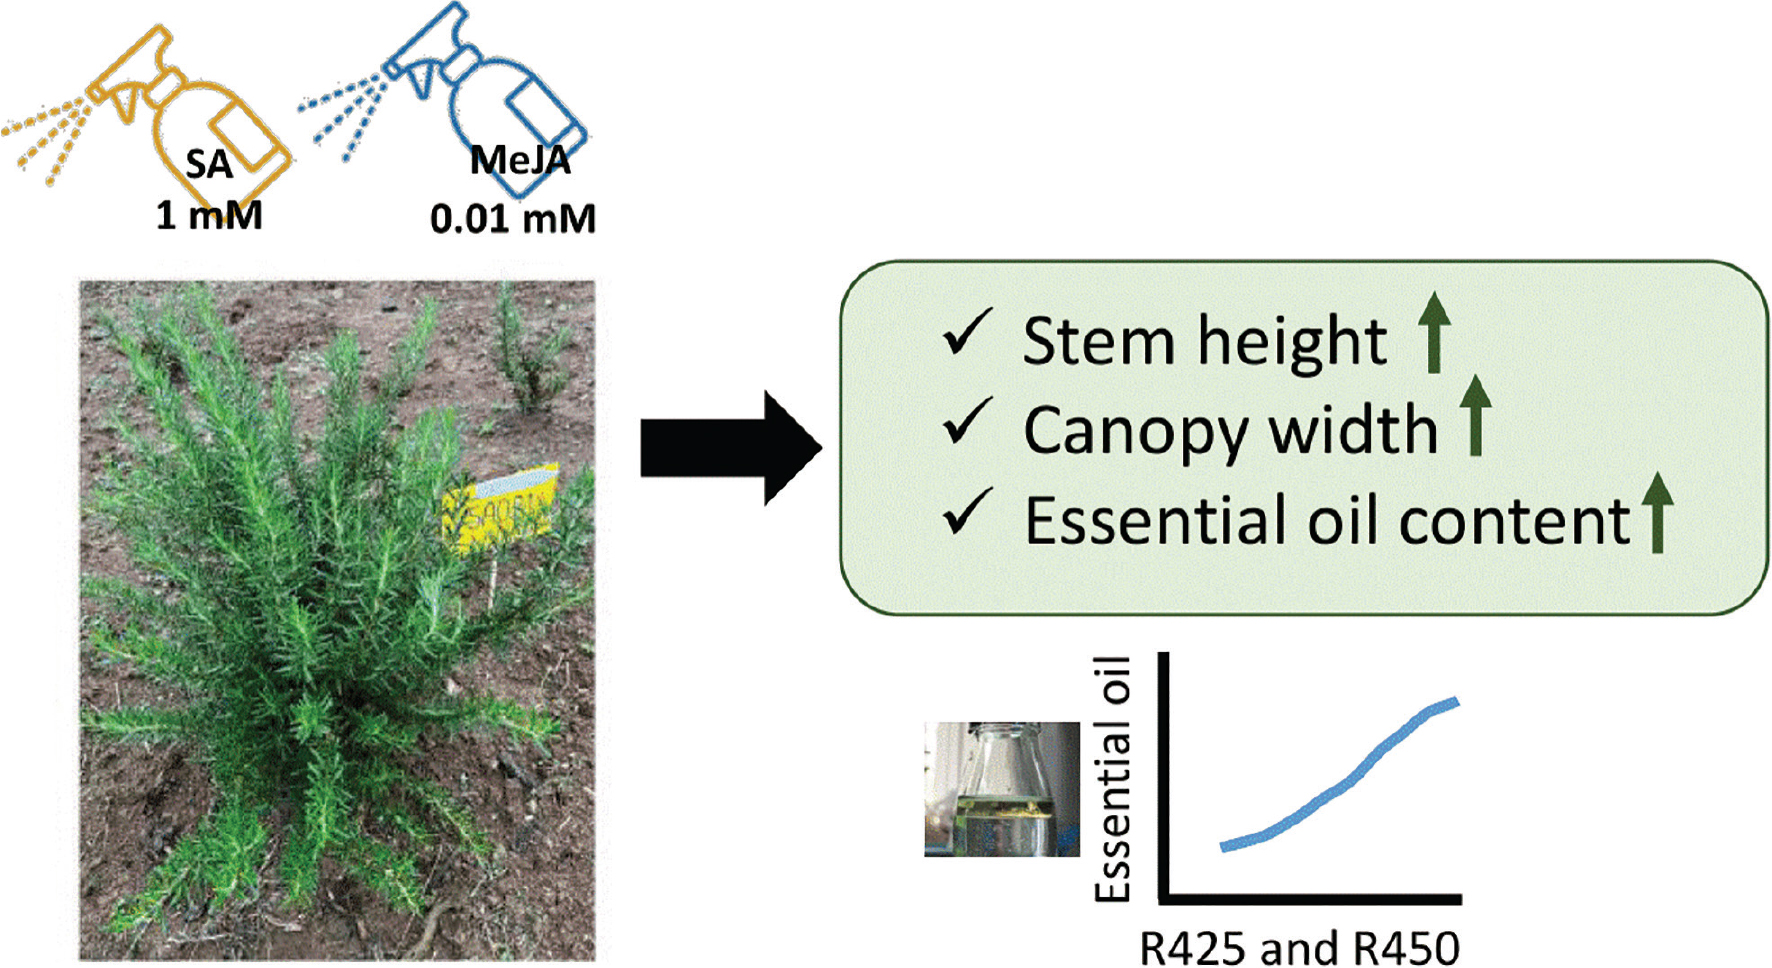
Figure 7.
The summary effects of 1 mM SA and 0.01 mM MeJA on growth and essential oil production in rosemary. The R425 and R450 indices showed a high correlation to rosemary essential oil. MeJA, methyl jasmonate; SA, salicylic acid.
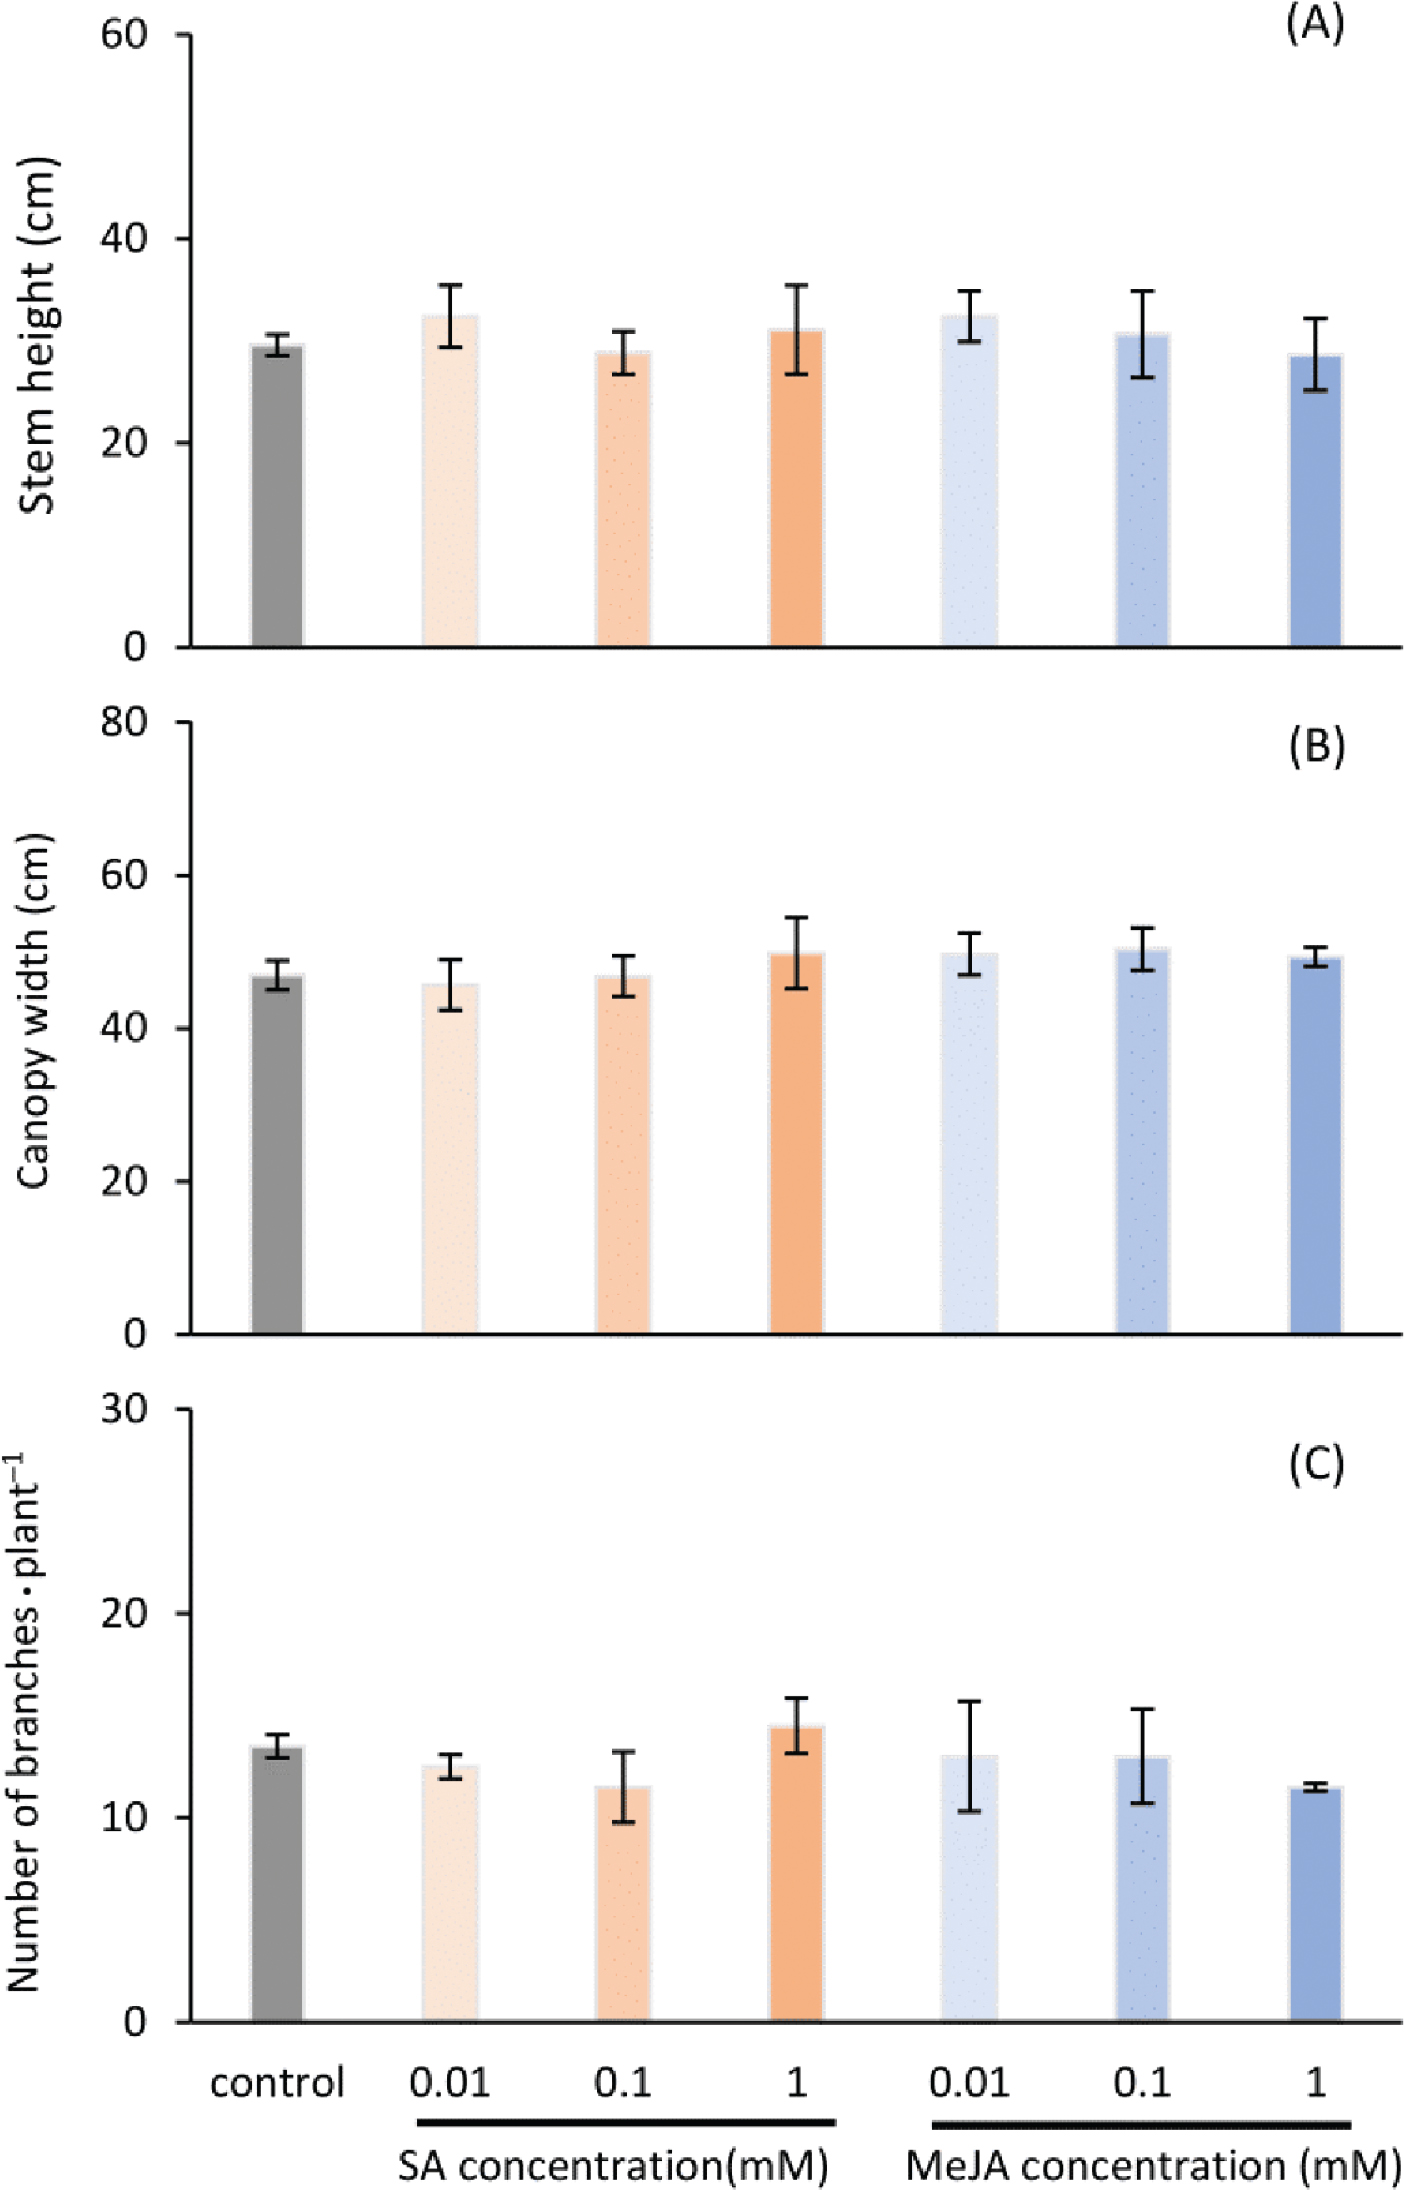
Figure S1.
Growth of rosemary before treating with SA or MeJA: (A) stem height, (B) canopy width, and (C) number of branches · plant−1. According to Tukey’s HSD test, all data had non-significant differences at p < 0.05. Vertical error bars show ± standard deviation. HSD, honestly significant difference; MeJA, methyl jasmonate; SA, salicylic acid.