
Table 1.
Structure of respondents by gender in three waves of the survey, N-508
| 2023 | 2024 | 2025 | Total | |||||
|---|---|---|---|---|---|---|---|---|
| N | % | N | % | N | % | N | % | |
| Female | 57 | 11.2% | 55 | 10.8% | 52 | 10.2% | 163 | 32.3% |
| Male | 130 | 25.6% | 101 | 19.9% | 98 | 19.3% | 329 | 64.8% |
| No response | 1 | 0.2% | 6 | 1.2% | 8 | 1.6% | 15 | 3.0% |
| Total | 188 | 37.0% | 162 | 31.9% | 158 | 31.1% | 508 | 100.0% |
Table 2.
Structure of respondents by place of residence (city/rural areas) in three waves of the survey, N-508
| 2023 | 2024 | 2025 | Total | |||||
|---|---|---|---|---|---|---|---|---|
| N | % | N | % | N | % | N | % | |
| City | 58 | 11.4% | 62 | 12.2% | 76 | 15.0% | 196 | 38.6% |
| Rural areas | 130 | 25.6% | 100 | 19.7% | 82 | 16.1% | 312 | 61.4% |
| Total | 188 | 37.0% | 162 | 31.9% | 158 | 31.1% | 508 | 100.0% |
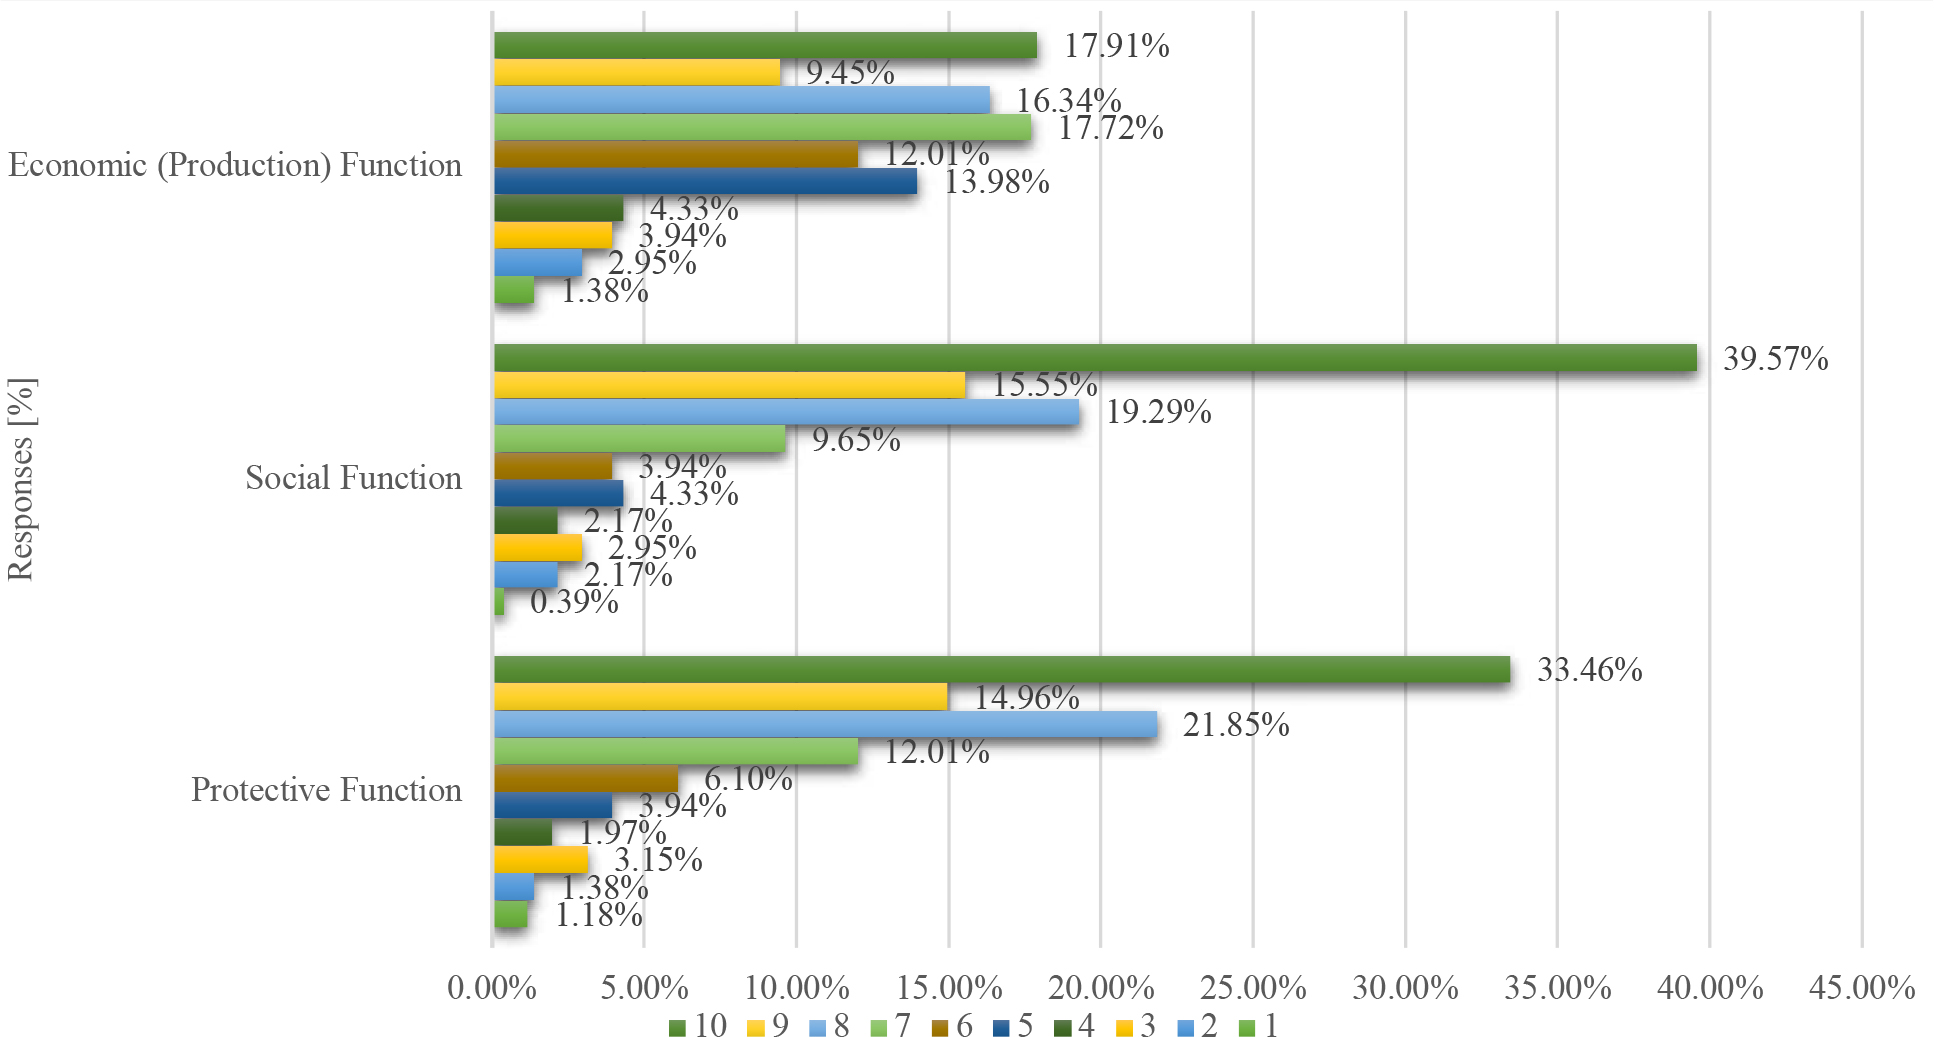
Figure 1.
Assessment of the importance of individual forest functions (scale 1–10)
Table 3.
Assessment of the importance of individual forest functions (scale 1–10)
| Economic function | |||
|---|---|---|---|
| 2023 | 2024 | 2025 | |
| Arithmetic mean | 8.32 | 7.86 | 7.95 |
| Median | 9.00 | 8.00 | 8.00 |
| Mode | 10.00 | 8.00 | 10.00 |
| Standard deviation | 2.02 | 2.15 | 2.08 |
| Protective function | |||
| Arithmetic mean | 8.18 | 8.16 | 8.42 |
| Median | 9.00 | 9.00 | 9.00 |
| Mode | 10.00 | 10.00 | 10.00 |
| Standard deviation | 2.11 | 2.17 | 1.97 |
| Social function | |||
| Arithmetic mean | 6.80 | 6.92 | 7.23 |
| Median | 7.00 | 7.00 | 7.00 |
| Mode | 7.00 | 7.00 | 10.00 |
| Standard deviation | 2.25 | 2.33 | 2.16 |
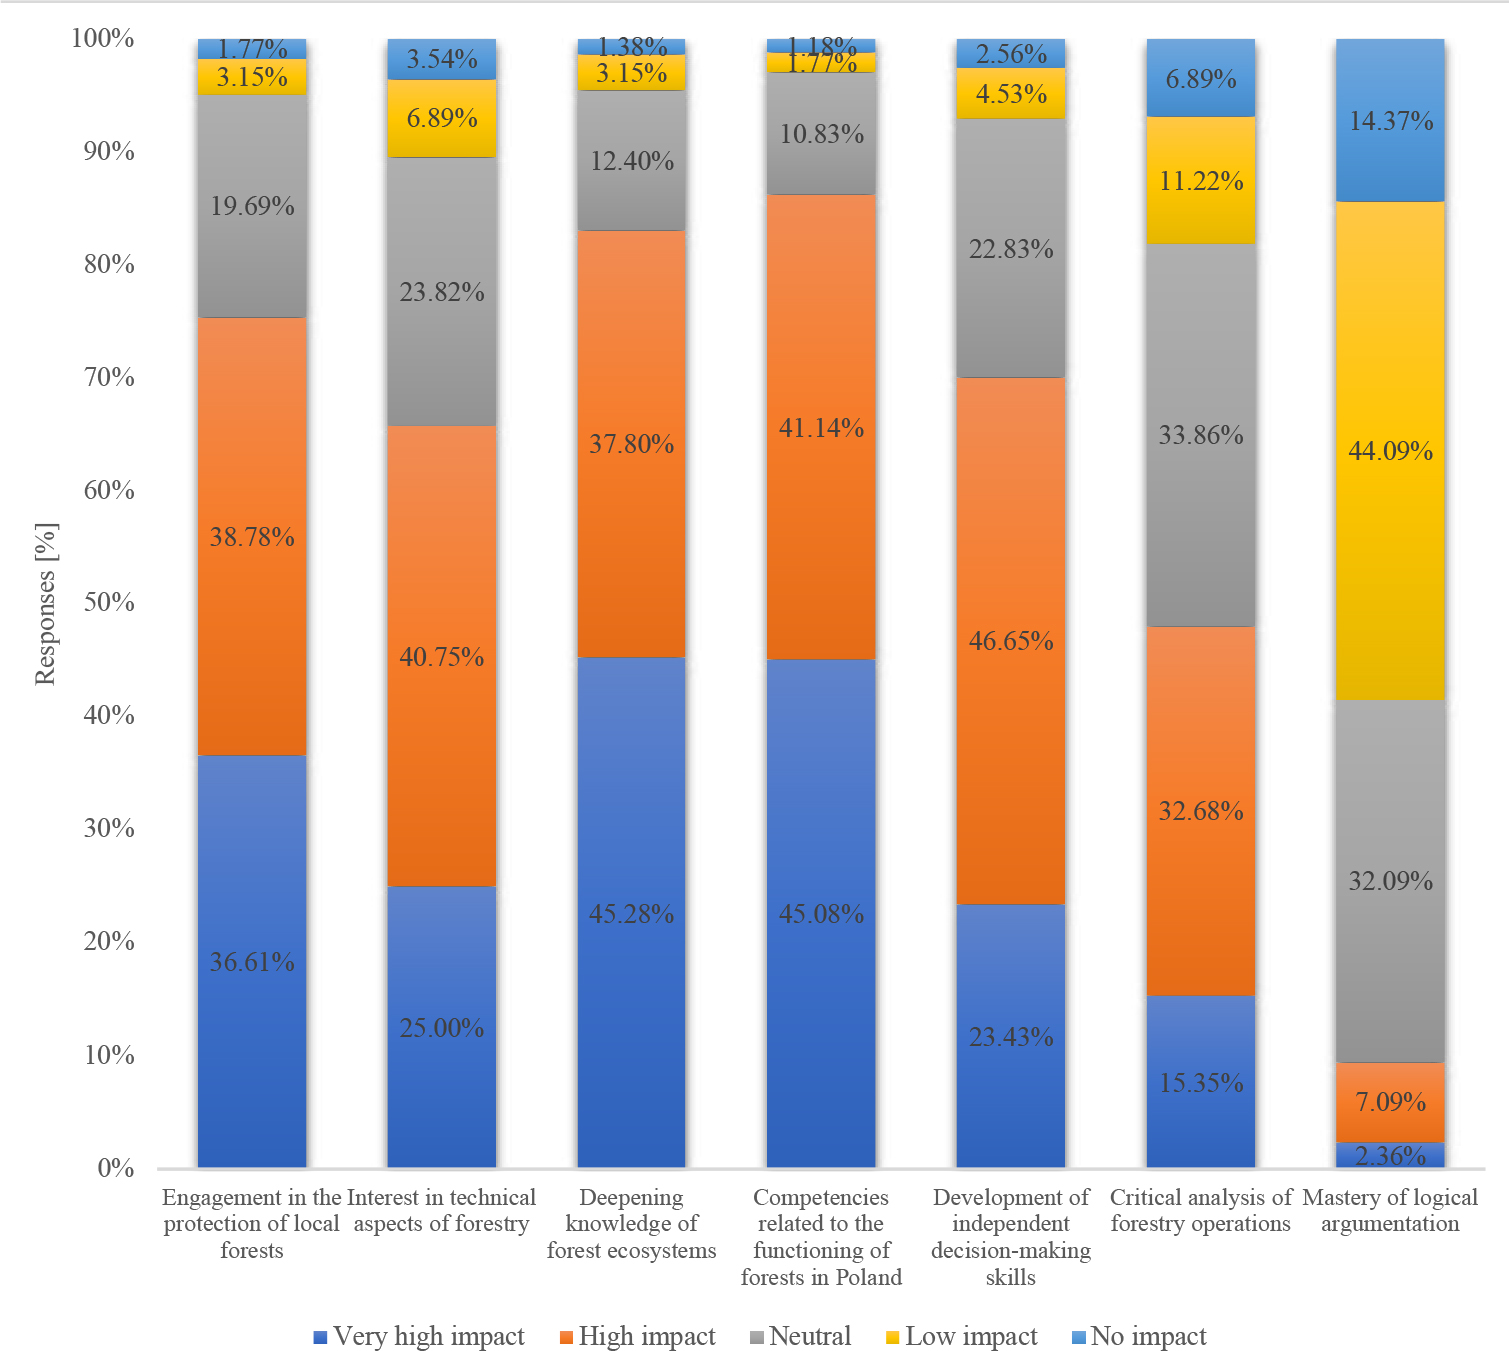
Figure 2.
Degree of influence of forestry studies on future professional work
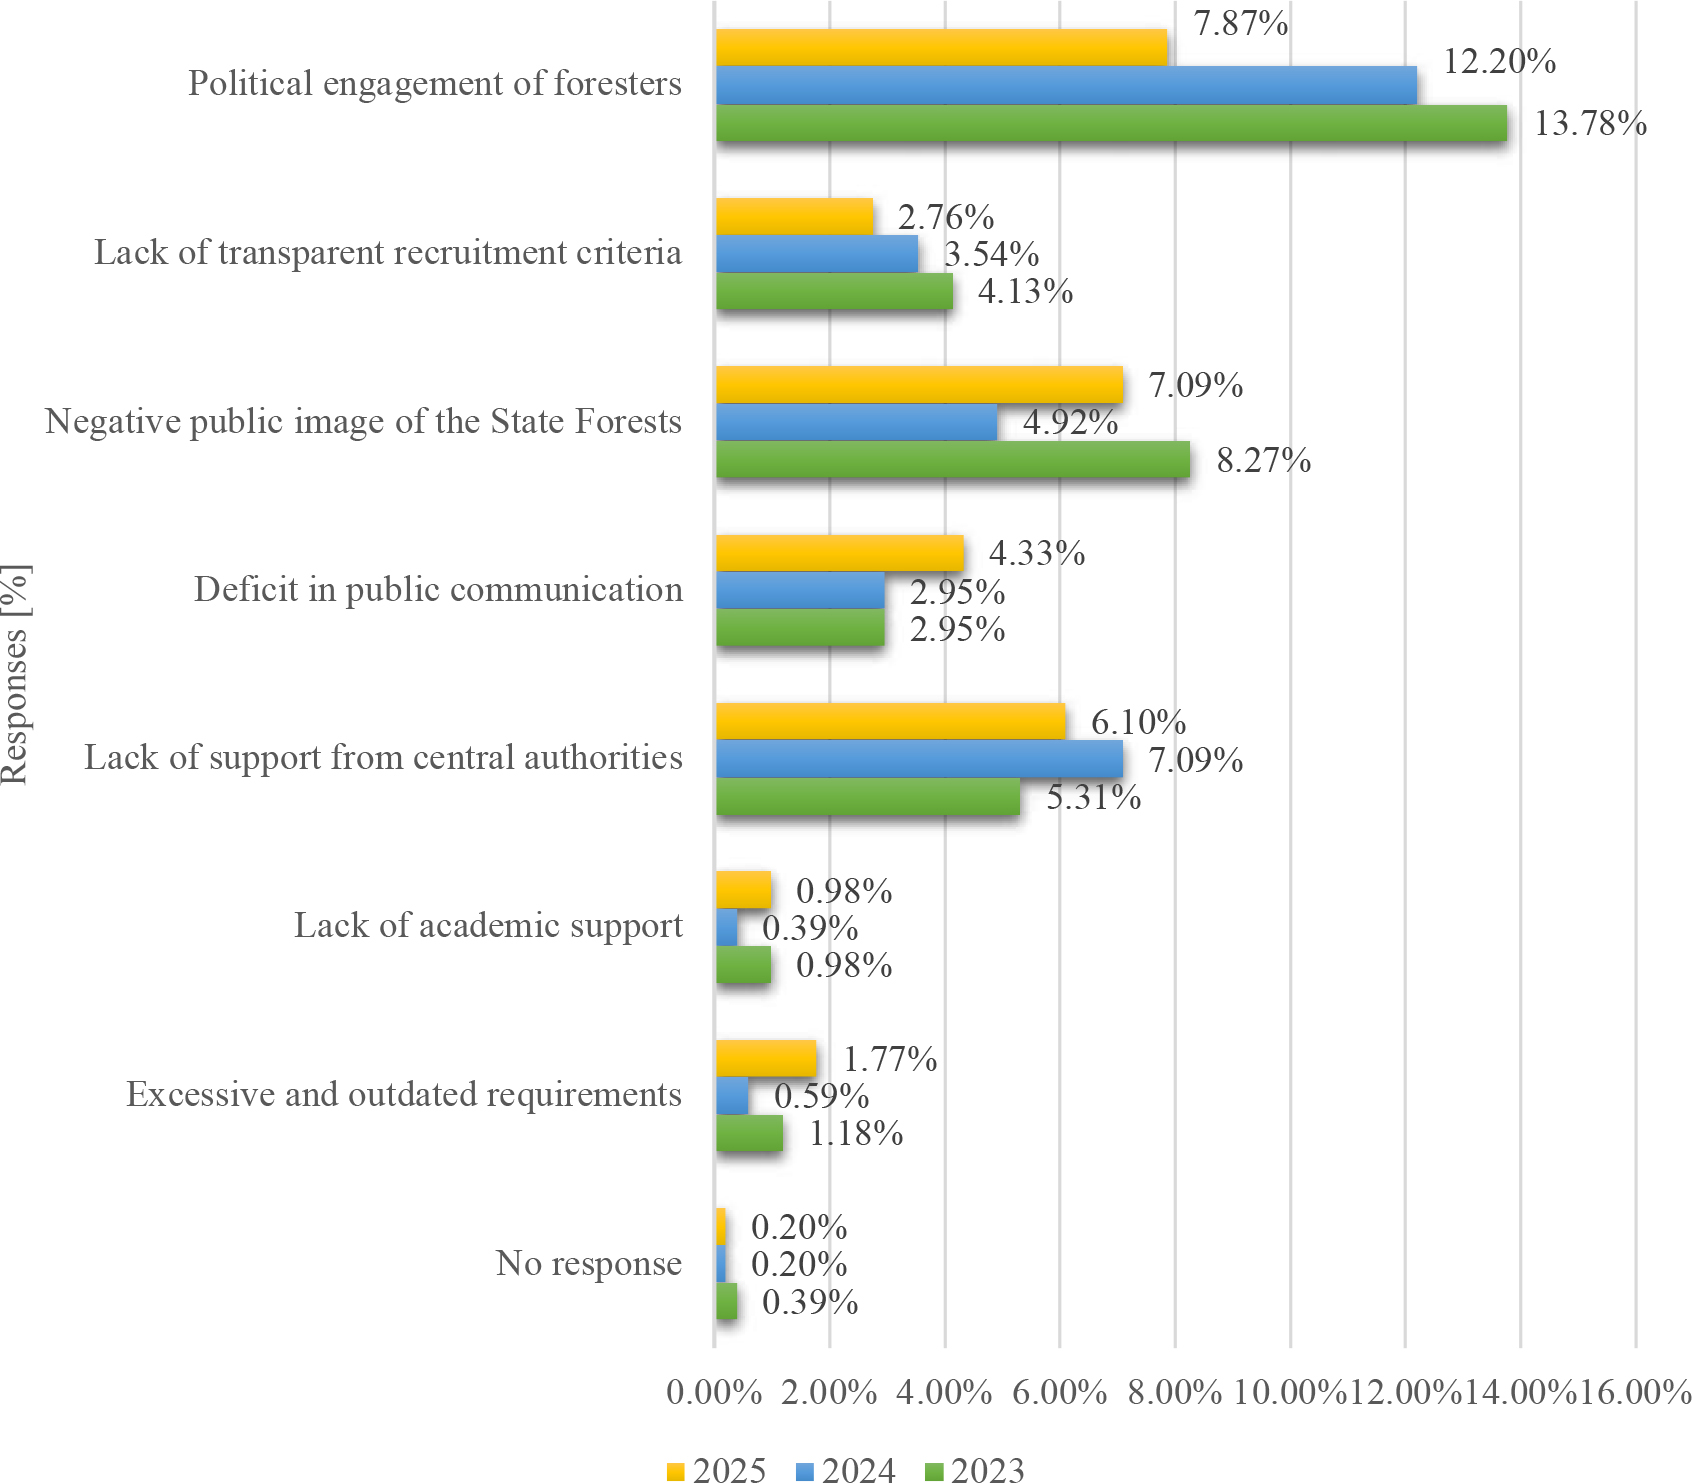
Figure 3.
Potential difficulties associated with future work in forestry
Table 4.
Degree of influence of forestry studies on future professional work
| Development of correct argumentation skills | |||
|---|---|---|---|
| 2023 | 2024 | 2025 | |
| Arithmetic mean | 3.76 | 3.52 | 3.53 |
| Median | 4.00 | 4.00 | 4.00 |
| Mode | 4.00 | 4.00 | 4.00 |
| Standard deviation | 0.83 | 0.93 | 0.93 |
| Increased critical thinking about the negative tasks of foresters | |||
| Arithmetic mean | 3.36 | 3.32 | 3.48 |
| Median | 3.00 | 3.00 | 4.00 |
| Mode | 3.00 | 3.00 | 4.00 |
| Standard deviation | 1.10 | 1.10 | 1.05 |
| Independence in decision-making | |||
| Arithmetic mean | 3.36 | 3.32 | 3.48 |
| Median | 3.00 | 3.00 | 4.00 |
| Mode | 3.00 | 3.00 | 4.00 |
| Standard deviation | 1.10 | 1.10 | 1.05 |
| Increased competence in the field of forest management in Poland | |||
| Arithmetic mean | 4.31 | 4.30 | 4.20 |
| Median | 4.00 | 4.00 | 4.00 |
| Mode | 5.00 | 5.00 | 5.00 |
| Standard deviation | 0.76 | 0.77 | 0.91 |
| Stimulating interest in getting involved in local forests, nature and forest ecosystems in my place of origin | |||
| Arithmetic mean | 3.74 | 3.69 | 3.88 |
| Median | 4.00 | 4.00 | 4.00 |
| Mode | 4.00 | 4.00 | 4.00 |
| Standard deviation | 0.98 | 1.05 | 1.00 |
| Increasing competence in the functioning of forests in Poland | |||
| Arithmetic mean | 4.31 | 4.30 | 4.20 |
| Median | 4.00 | 4.00 | 4.00 |
| Mode | 5.00 | 5.00 | 5.00 |
| Standard deviation | 0.76 | 0.77 | 0.91 |
| Increasing competence in the field of forestry in Poland | |||
| Arithmetic mean | 4.31 | 4.30 | 4.20 |
| Median | 4.00 | 4.00 | 4.00 |
| Mode | 5.00 | 5.00 | 5.00 |
| Standard deviation | 0.76 | 0.77 | 0.91 |