
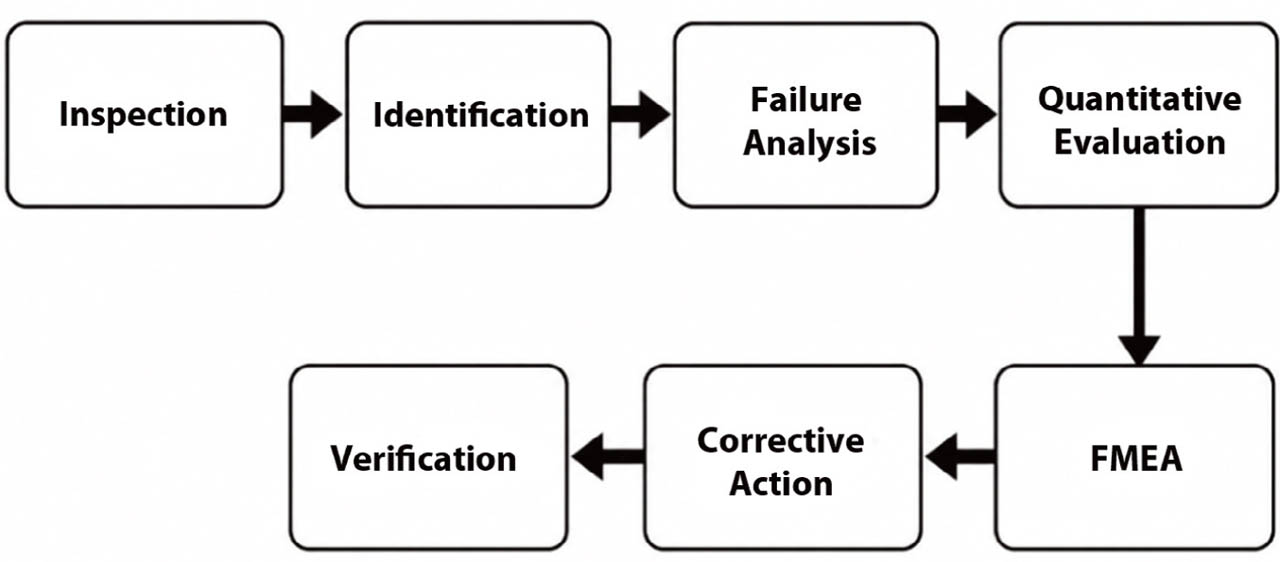
Fig. 1.
Structured analysis workflow illustrating the sequential process of system evaluation.
Table 1.
Methodological parameters and assumptions.
| Parameter | Extracted Value / Description | Methodological Role |
|---|---|---|
| Aircraft type, Maintenance event | Airbus A330-900, C-Check C03 | Case object, Inspection context |
| Component analyzed | Outlet discharge Engine fire extinguisher system | Defective component, Safety-critical aircraft system |
| Inspection focus | Distribution piping and outlet discharge | Data collection scope |
| Crack length | < 5 mm | Main observed defect size |
| Defect location | Engine nacelle, Zone 420 | Operational environment |
| Operational exposure | 5,642 FC and 10,834 FH | Fatigue evaluation reference |
| Data sources | Inspection records, visual observations, AMM & task cards | Primary evidence-based, Maintenance procedure reference |
| Analysis type | Qualitative and semi-quantitative engineering analysis | Analytical approach |
| Fatigue method | Simplified Basquin-type relation | Fatigue life estimation |
| Crack growth method | Paris Law-based simulation | Crack propagation estimation |
| Representative stress amplitude | 95 MPa | Localized cyclic loading assumption |
| Paris Law constants | C =2.5 × 10⁻¹¹, m = 3.2, Y = 1.12 | Crack growth simulation parameter |
| Safety evaluation | Safety factor analysis | Structural margin assessment |
| Risk evaluation | FMEA | System-level risk assessment |
| RPN equation basis | Severity × Occurrence × Detection | Failure prioritization metric |
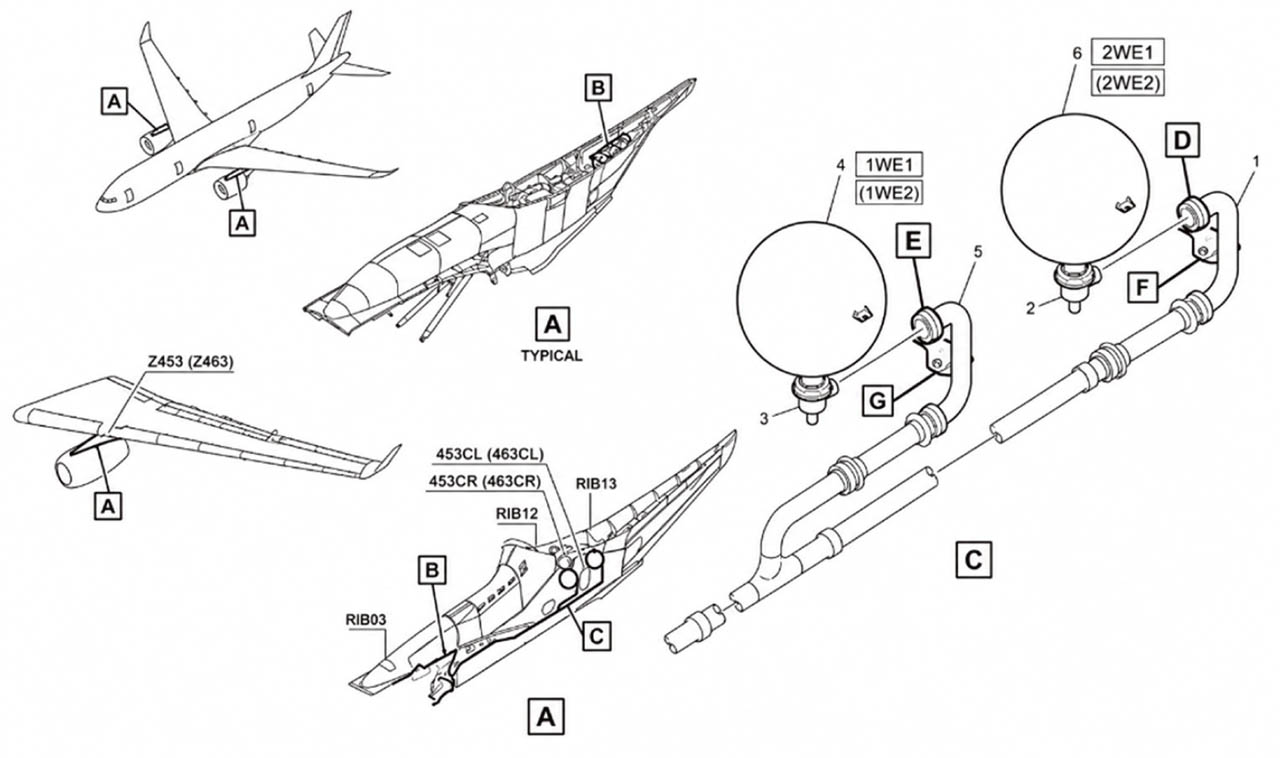
Fig. 2.
Airbus A330-900 engine fire extinguisher system and outlet discharge location in the engine nacelle area, showing the installation zone and observed crack location.
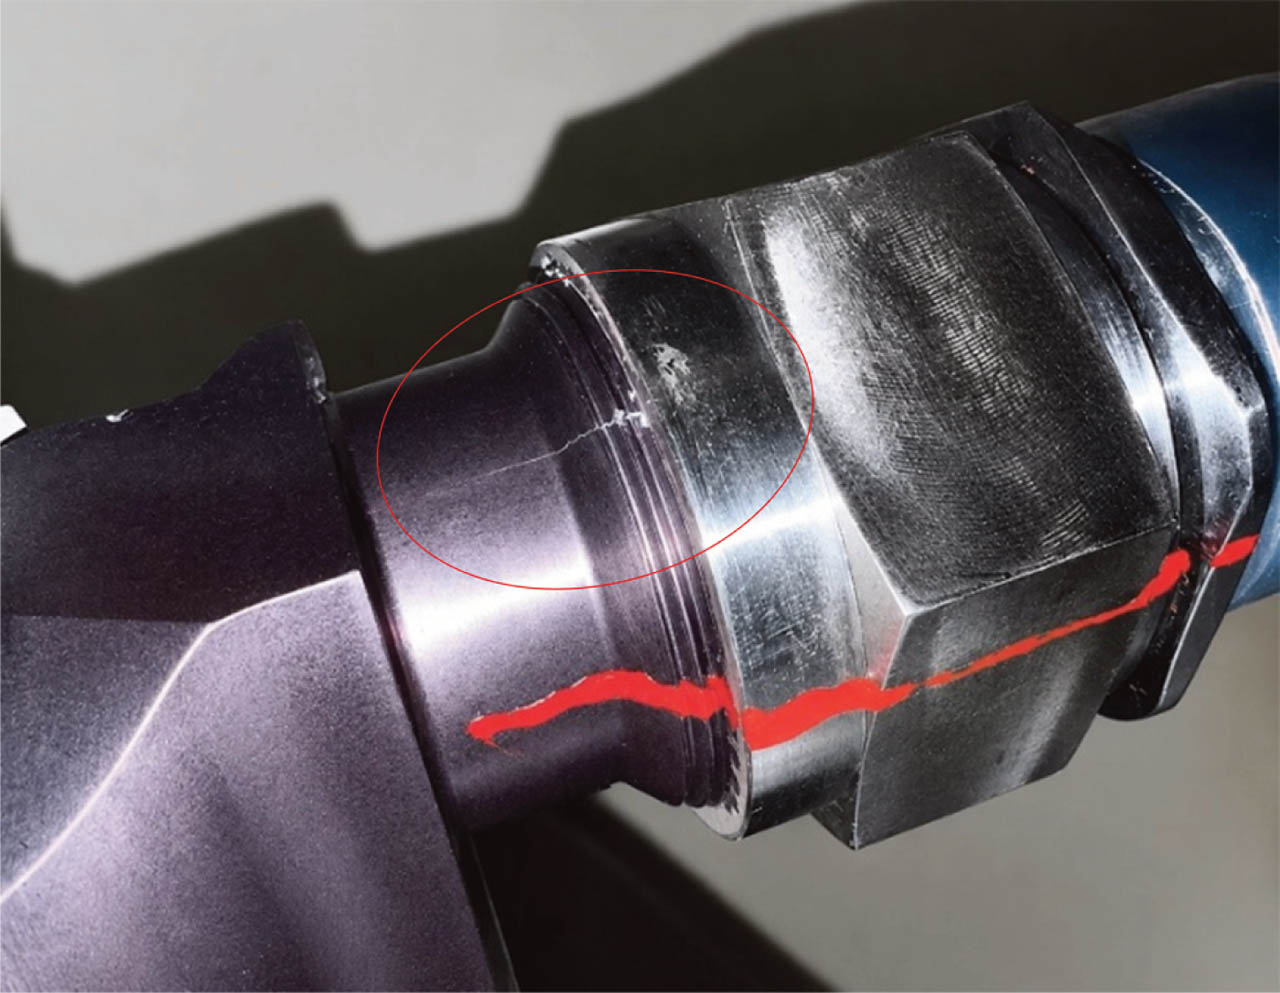
Fig. 3.
Close-up visual observation of the crack on the outlet discharge component.
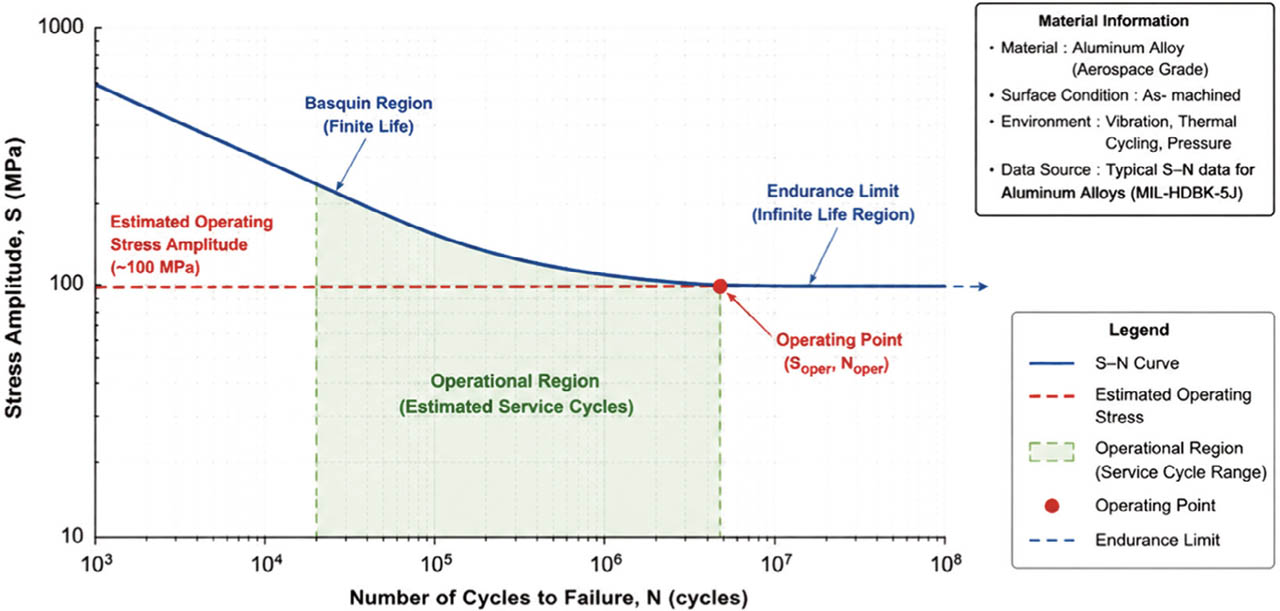
Fig. 4.
S–N curve with operational region highlighted.
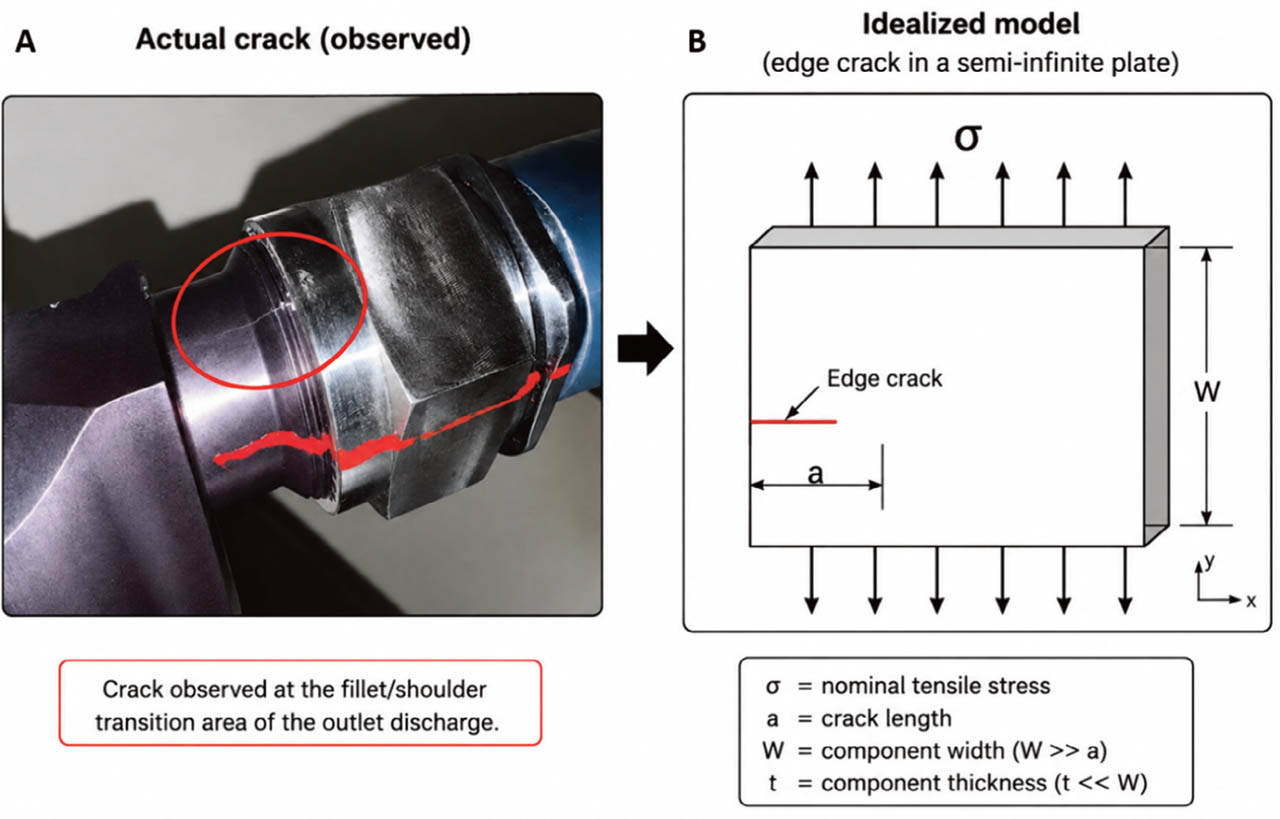
Fig. 5a.
Comparison between the observed crack (A) on the outlet discharge component and the simplified edge-crack model (B) used to estimate the stress intensity factor. The crack was located at the fillet/shoulder transition region and exhibited an approximate visible length of 5 mm.
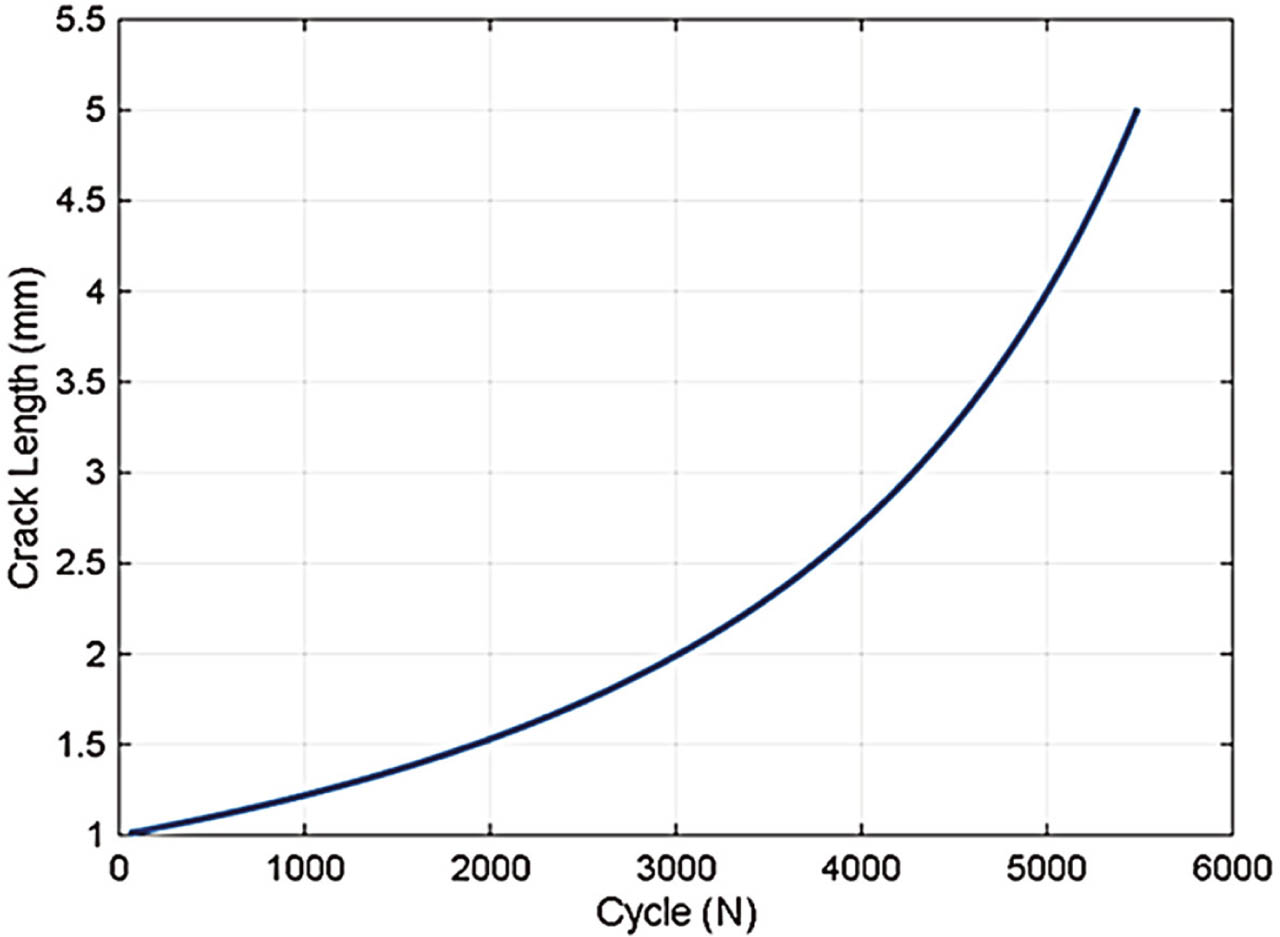
Fig. 5b.
Crack-growth curve obtained from MATLAB-based Paris Law simulation under elevated cyclic loading conditions.
Table 2.
Safety factor estimation results.
| Parameter | Estimated Value |
|---|---|
| Allowable Stress | 120 MPa |
| Operational Stress | 95 MPa |
| Safety Factor (SF) | 1.2 |
| Condition | Critical / Near Limit |
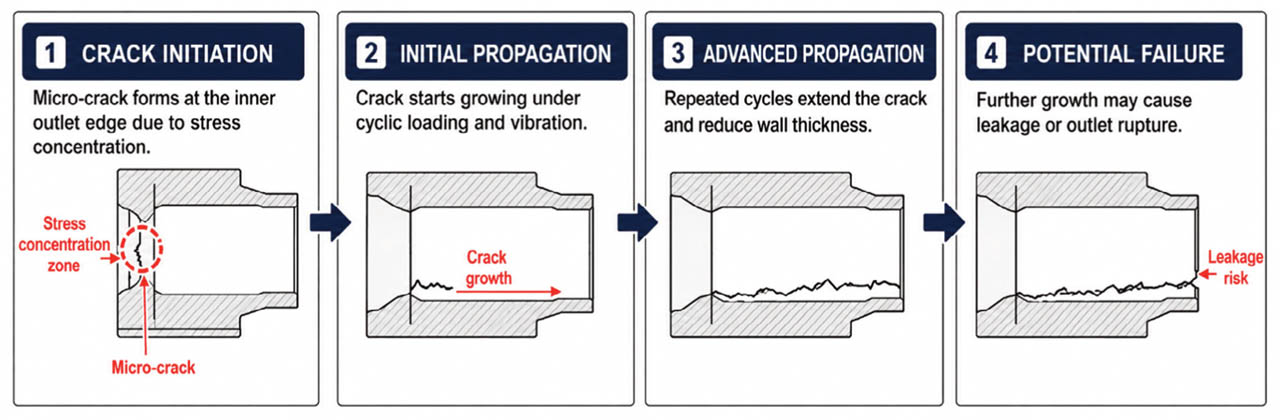
Fig. 6.
Schematic of crack initiation and propagation mechanism.
Table 3.
FMEA results with RPN values.
| Component | Failure Mode | Cause | Effect | S | O | D | RPN | Mitigation |
|---|---|---|---|---|---|---|---|---|
| Outlet Discharge | Crack | Fatigue, vibration, thermal | Leakage | 9 | 6 | 5 | 270 | Replacement |
| Distribution Piping | Blockage | Debris | Flow restriction | 7 | 4 | 4 | 112 | Cleaning |
| Extinguisher Bottle | Pressure loss | Seal failure | System failure | 10 | 3 | 3 | 90 | Inspection |
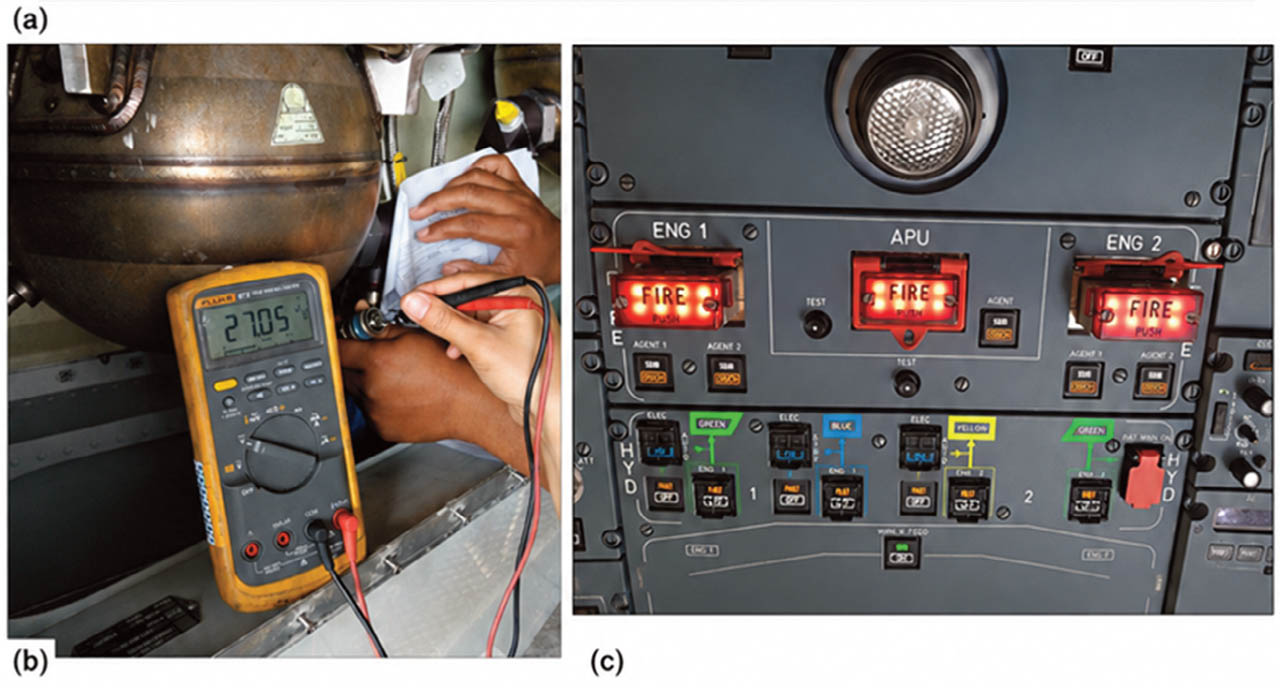
Fig. 7.
Post-maintenance functional test sequence of the fire extinguisher system: (a) cropped excerpt of the approved task card used as the maintenance reference; (b) verification process performed on the aircraft; and (c) normal cockpit fire panel indication confirming system serviceability.
| ACTION | RESULT |
|---|---|
1. On the ENG/FIRE control panel 255VU:
|
|
2. On the ENG/FIRE control panel 255VU:
|
|