
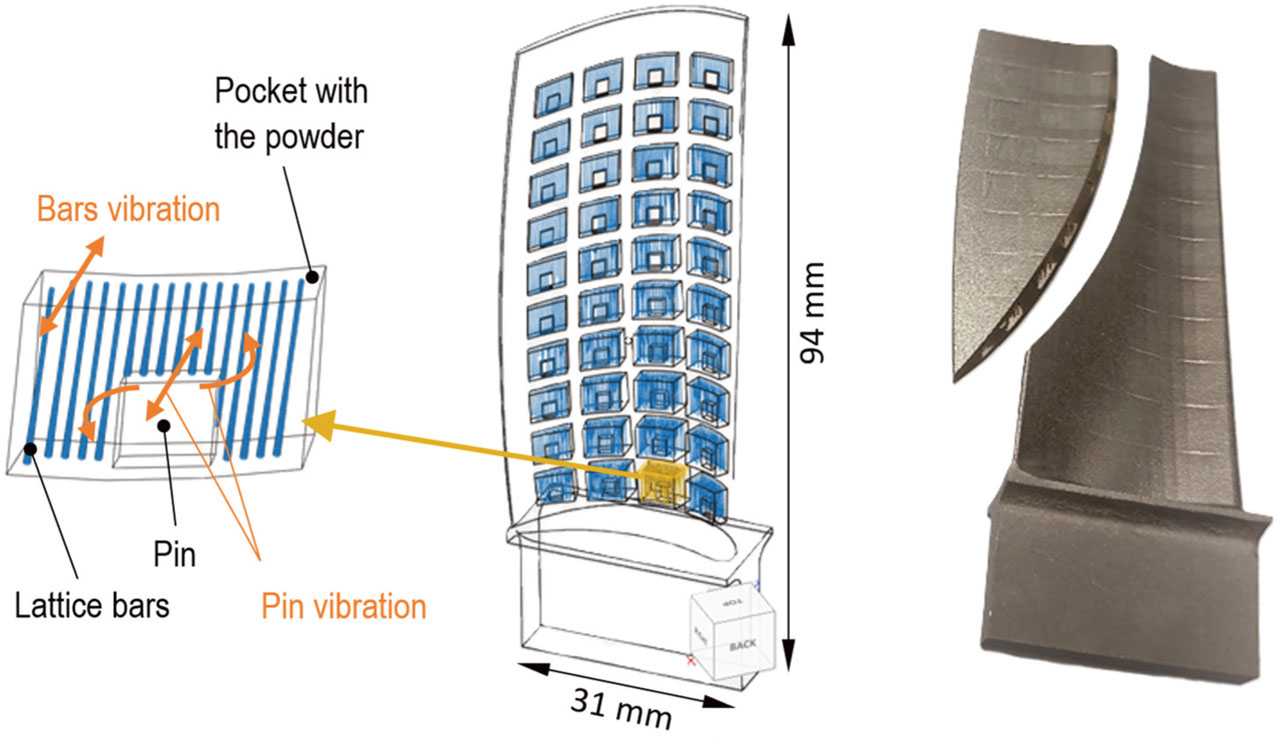
Figure 1.
Internal blade structure (middle), powder-filled pocket with damping elements (left), and cross-section of the manufactured blade prototype (right).
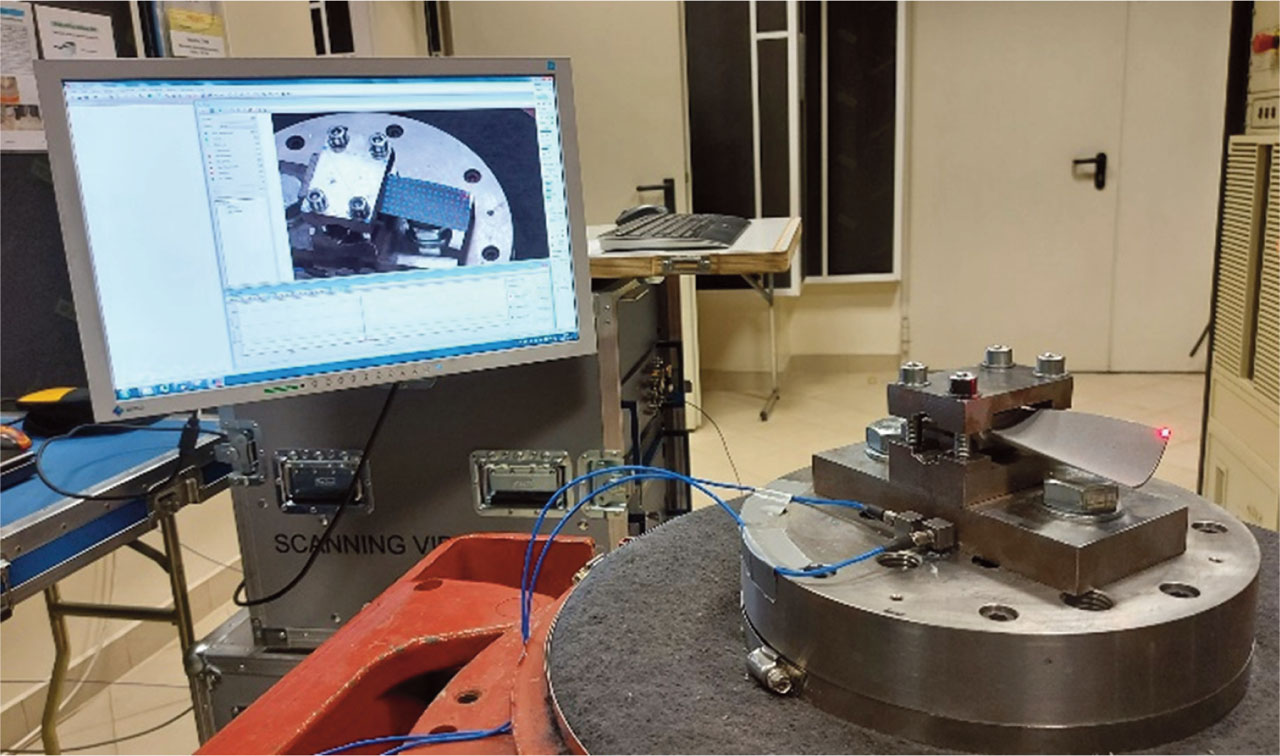
Figure 2.
Blade mounted in the fixture on the shaker and view of the measuring system.
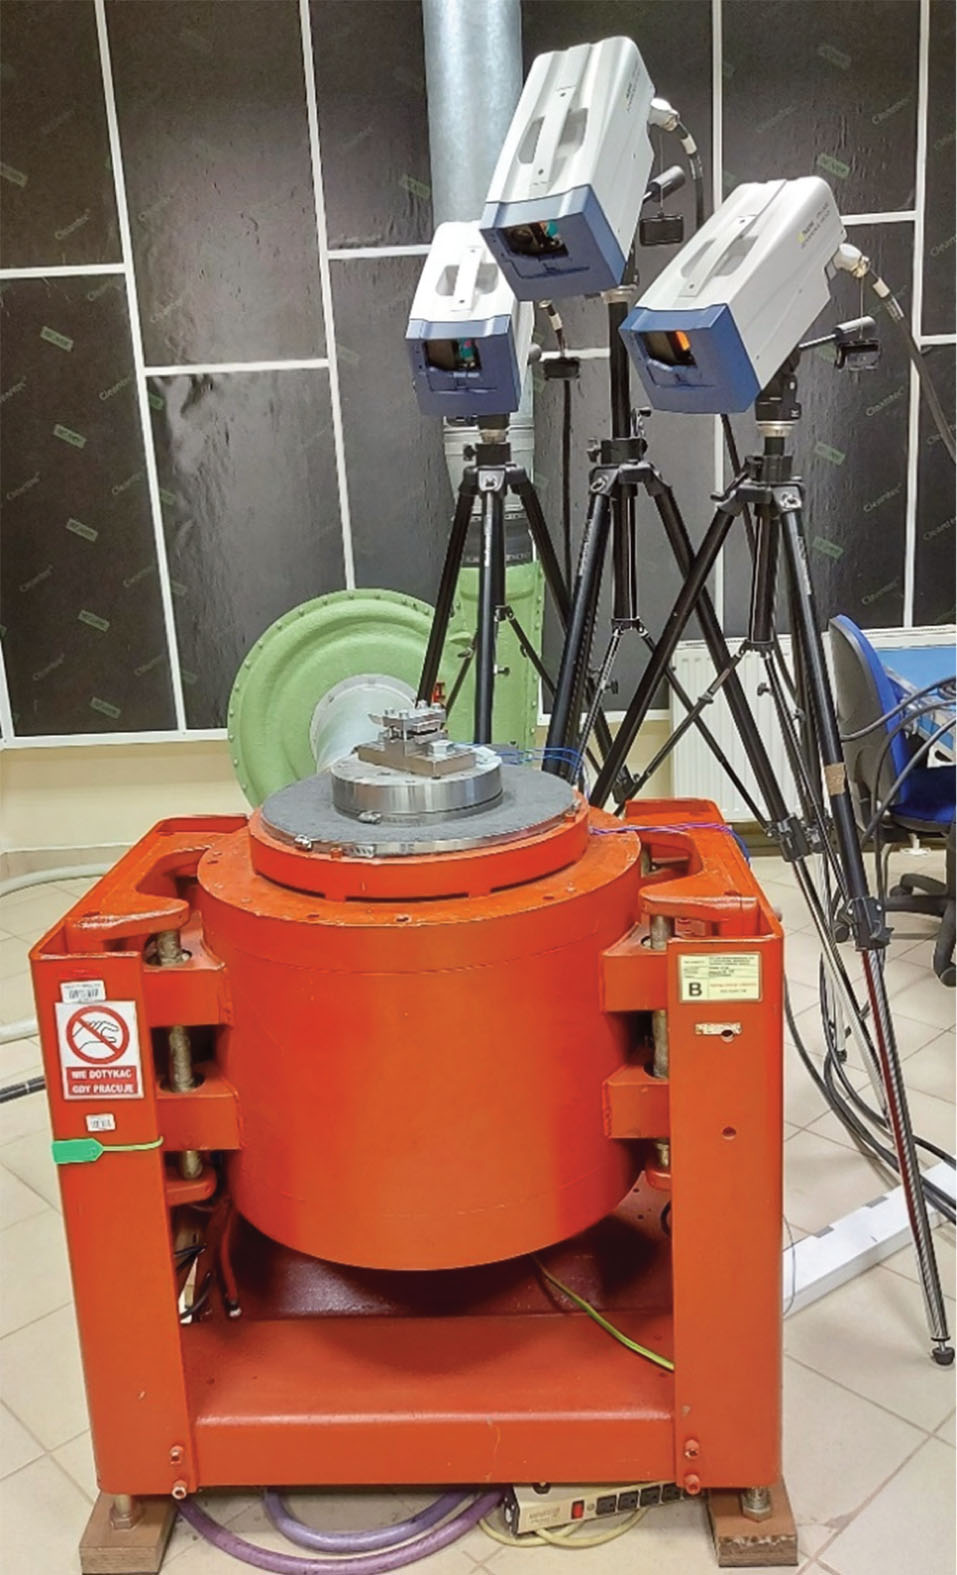
Figure 3.
Test stand: E-390 shaker and heads of the PSV 500 3D scanning vibrometer.
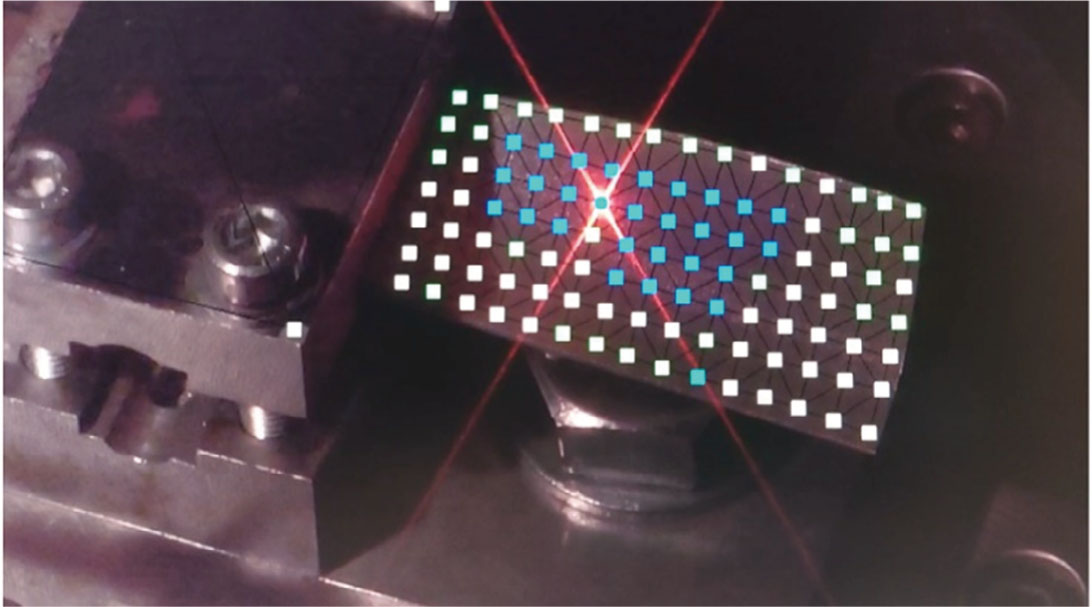
Figure 4.
Measurement point grid for vibration mode shape acquisition.
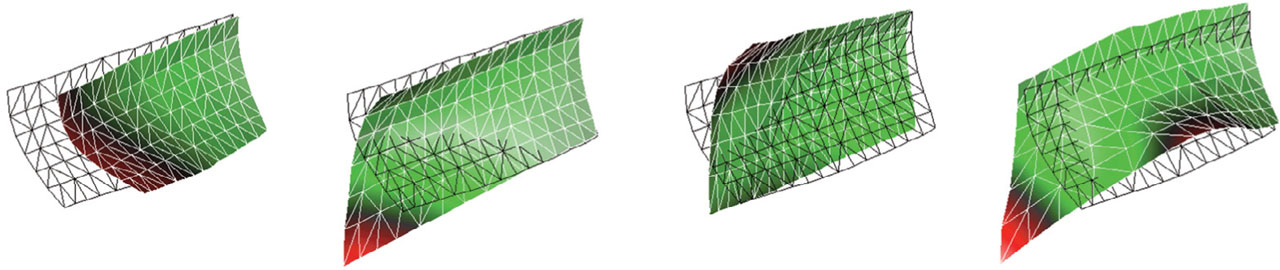
Figure 5.
Mode shapes obtained from vibration testing.
Table 1.
Natural frequencies of the blades obtained from experimental testing.
| Object | Mode | ||||
|---|---|---|---|---|---|
| 1 | 2 | 3 | 4 | ||
| Solid Blade | f [Hz] | 1076 | 2529 | 3745 | 4928 |
| Lattice Blade | f [Hz] | 1019 | 2293 | 3357 | 4463 |
| Relative Difference | −5% | −9% | −10% | −9% | |
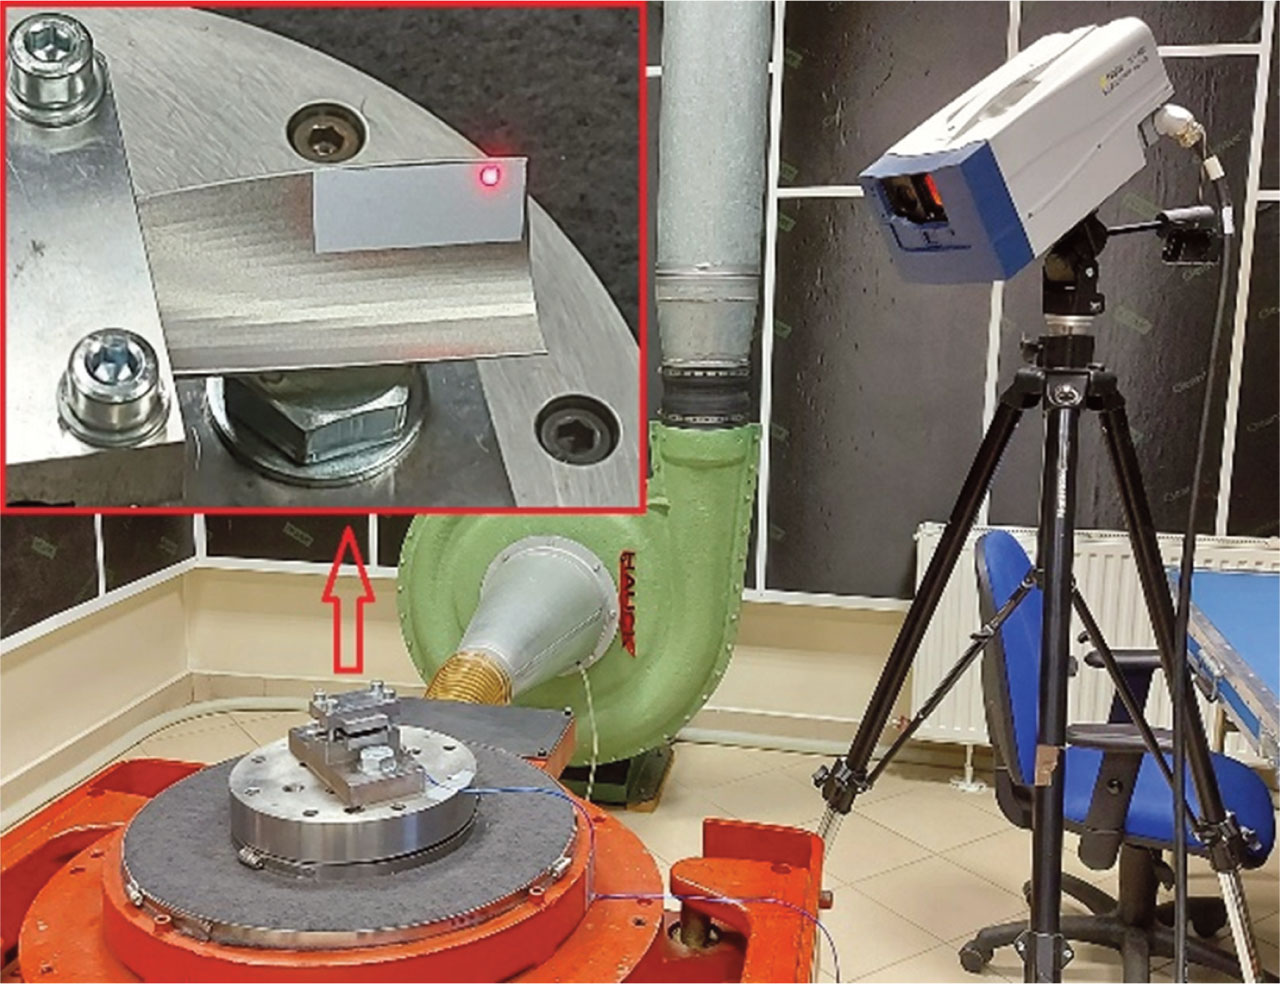
Figure 6.
Test stand for measuring vibration damping.
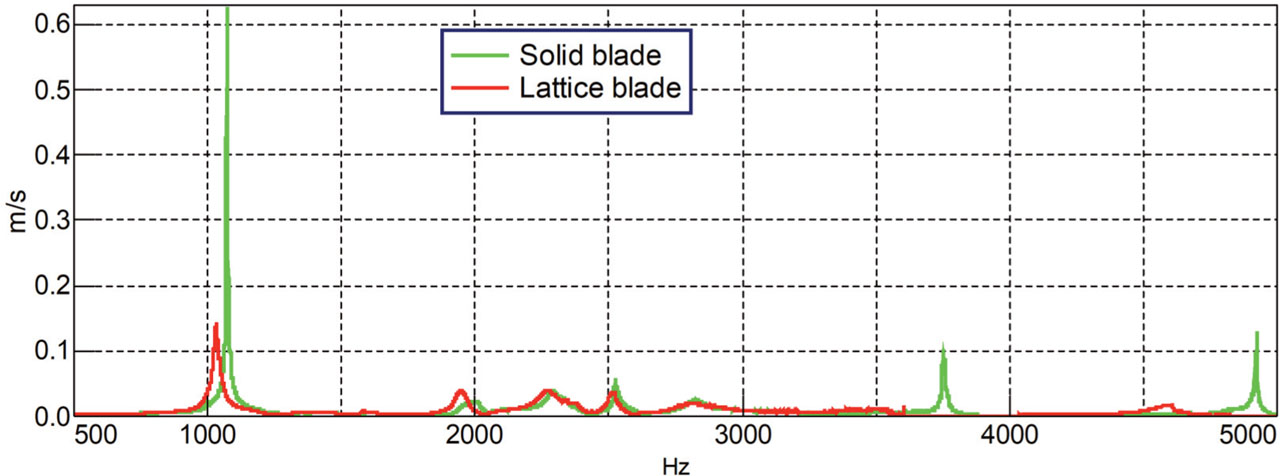
Figure 7.
Amplitude-frequency characteristics of the Lattice and Solid blades.
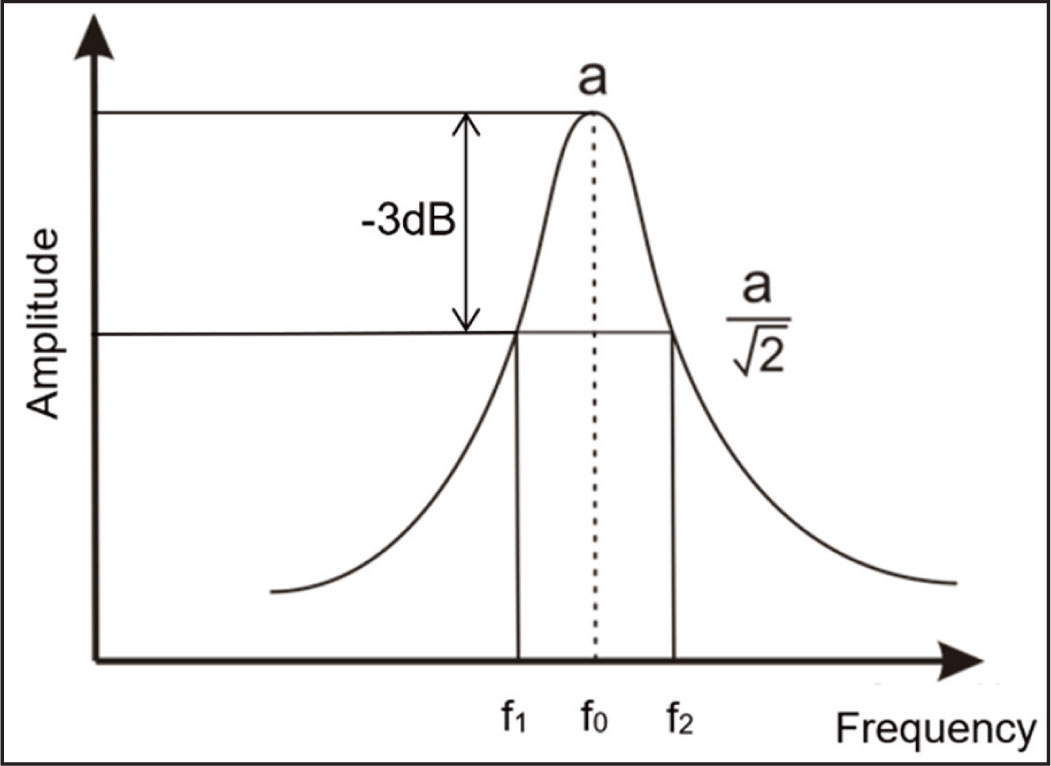
Figure 8.
Determination of vibration damping by the half-power method (Braun et al., 2002).
Table 2.
Damping ratio for excitation amplitude 1g.
| Object | Mode | ||||
|---|---|---|---|---|---|
| 1 | 2 | 3 | 4 | ||
| Solid Blade | ζ [Hz] | 0.16 | 0.28 | 0.11 | 0.06 |
| Lattice Blade | ζ [Hz] | 0.86 | 0.53 | 0.29 | 0.72 |
| Damping increase | 5.4× | 1.9× | 2.6× | 12× | |
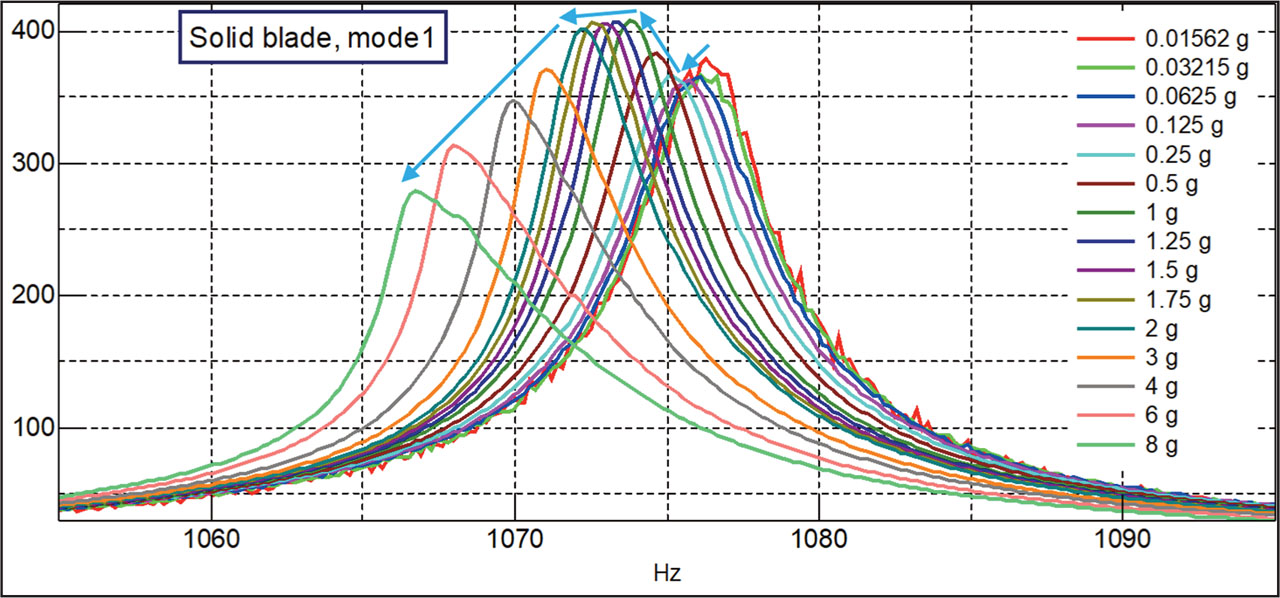
Figure 9.
Solid blade frequency characteristics for various amplitude of excited vibrations (1st mode).
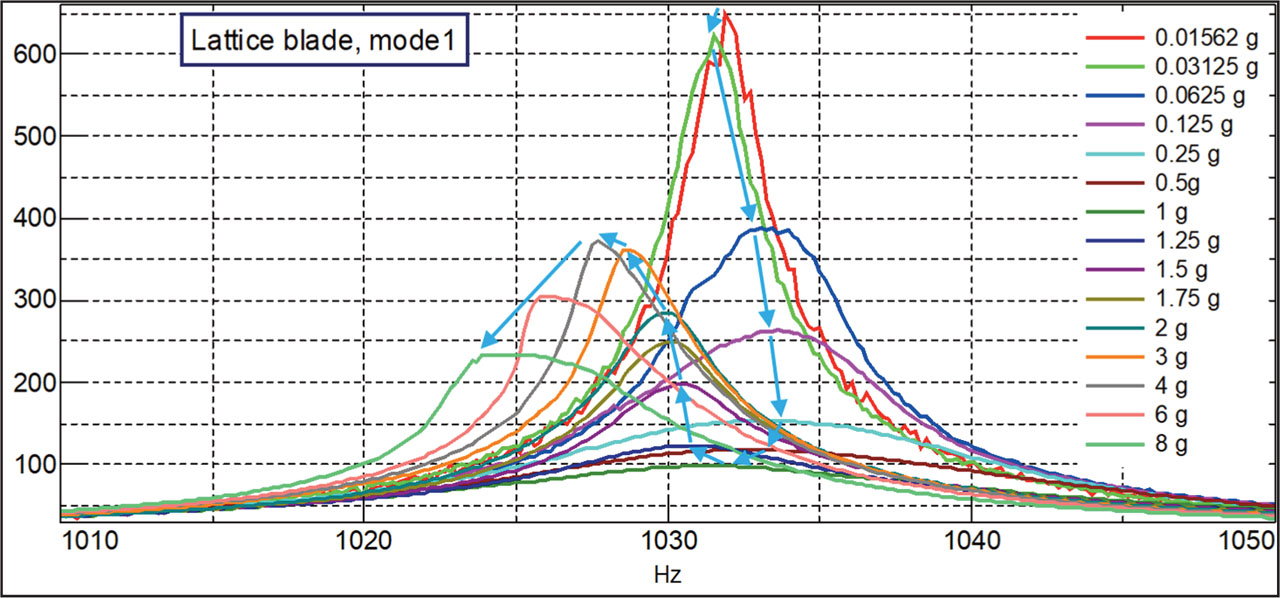
Figure 10.
Lattice blade frequency characteristics for various amplitude of excited vibrations (1st mode).
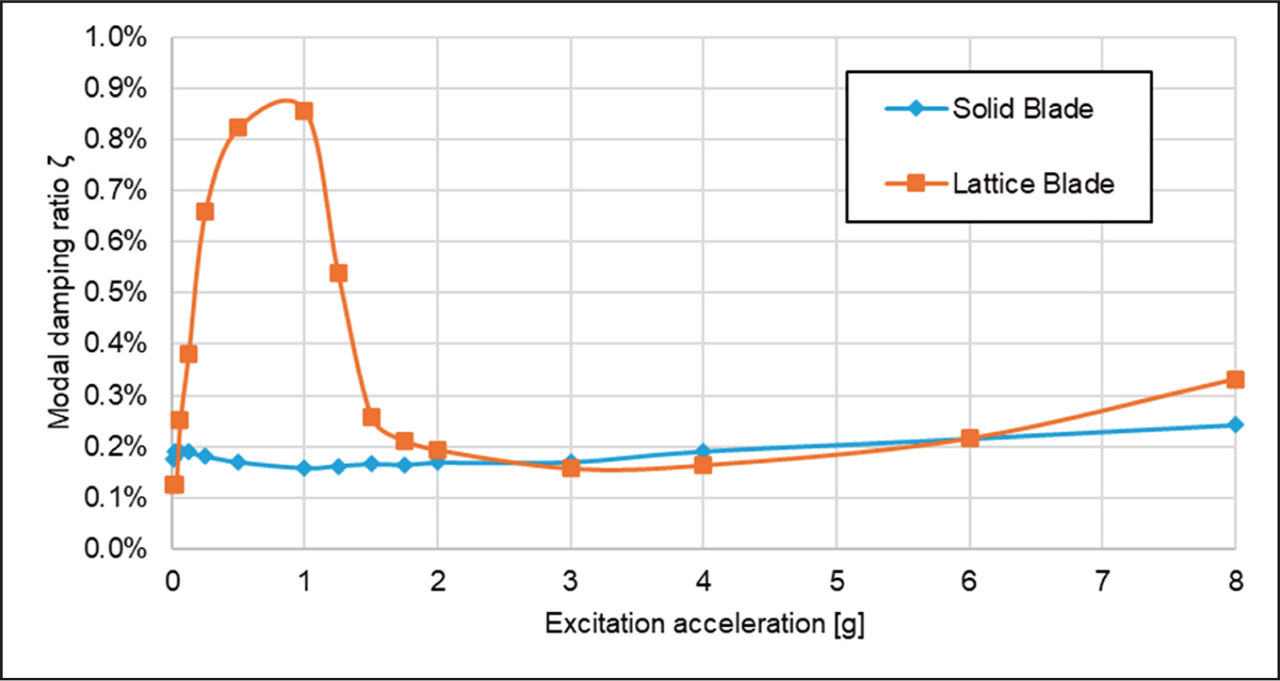
Figure 11.
Damping ratio as a function of excited vibration amplitude (Moneta et al., 2022b).