
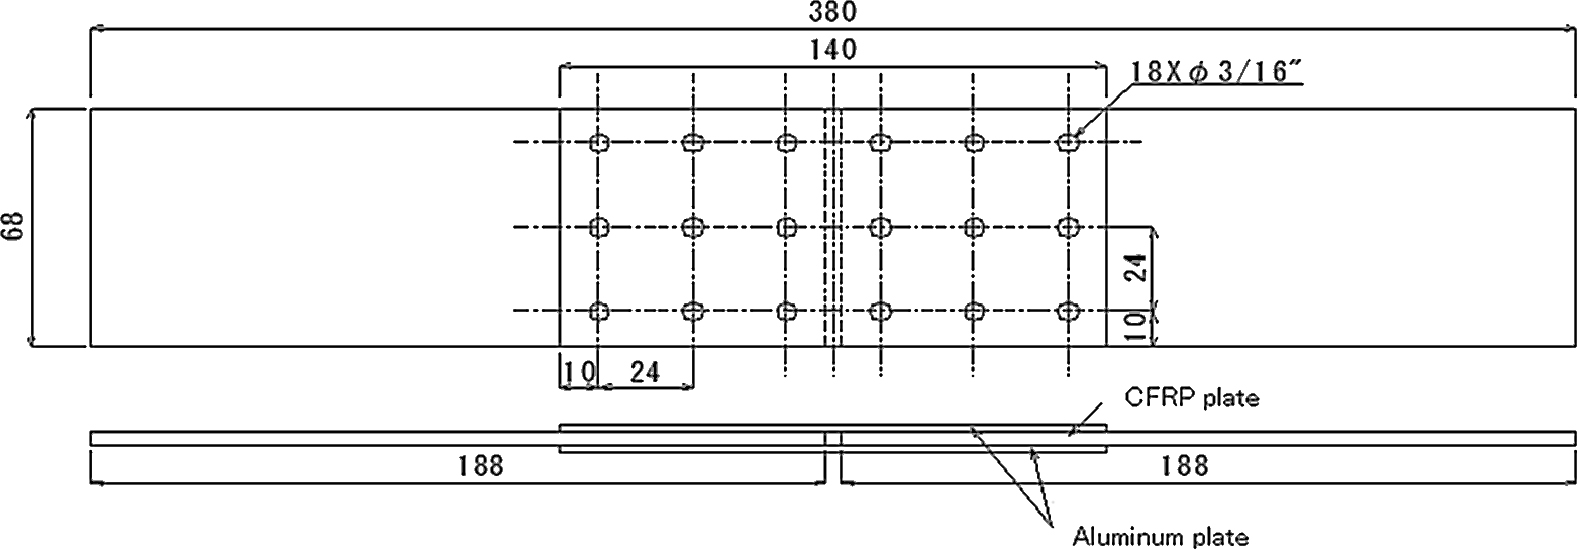
Figure 1.
Geometry of hybrid specimen.
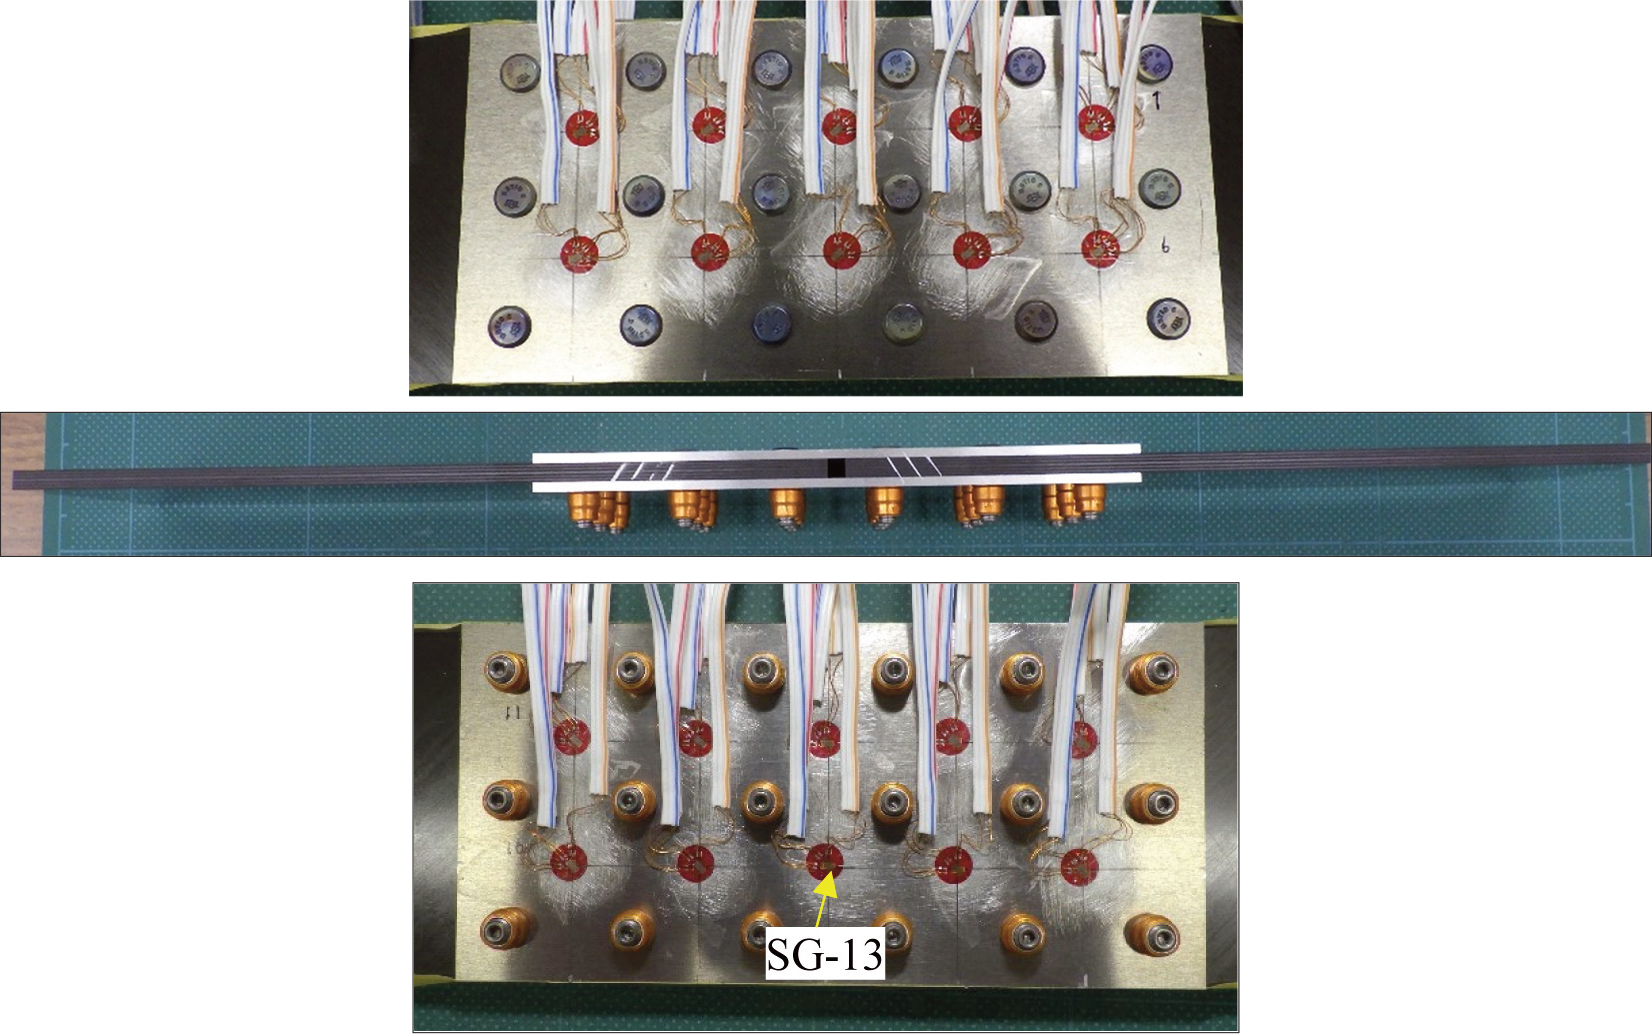
Figure 2.
Strain gauge location on hybrid specimen.
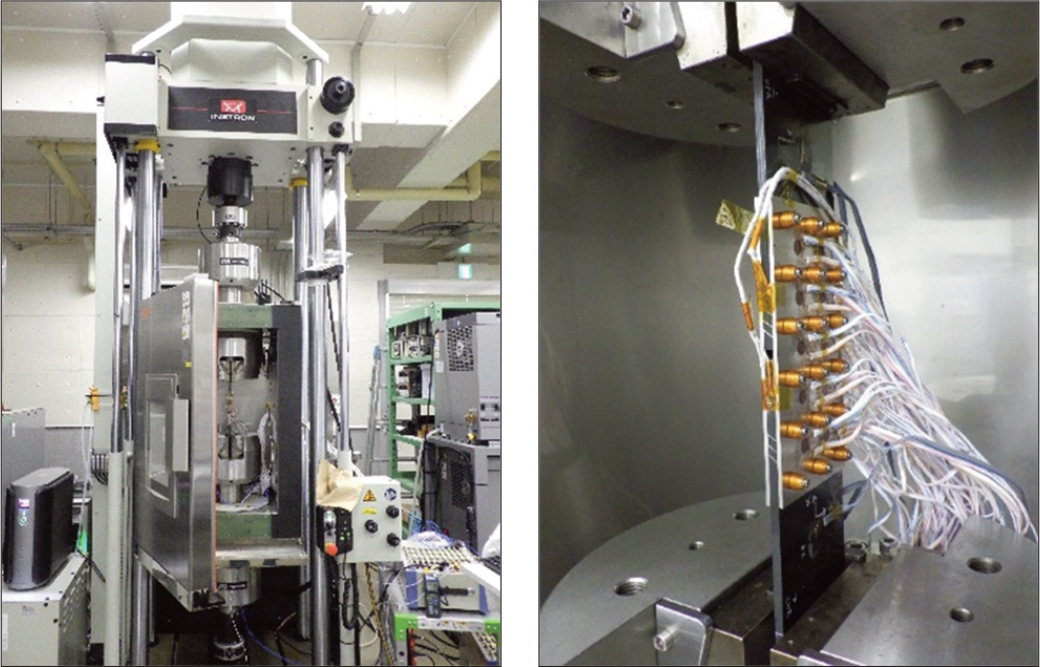
Figure 3.
Test setup.
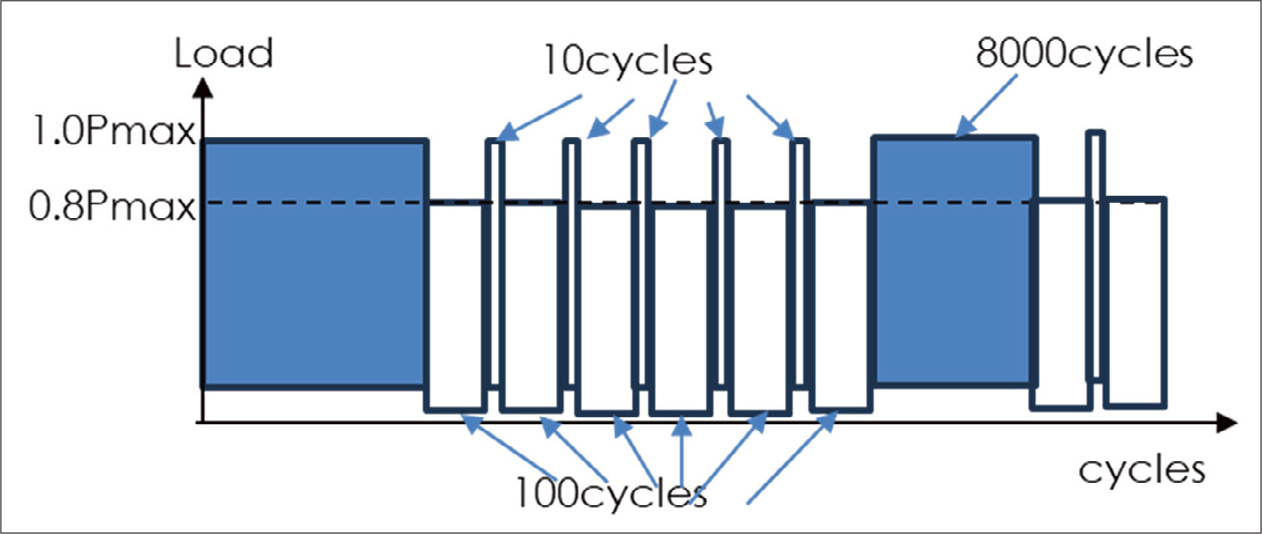
Figure 4.
Schematic diagram of marker band waveform.
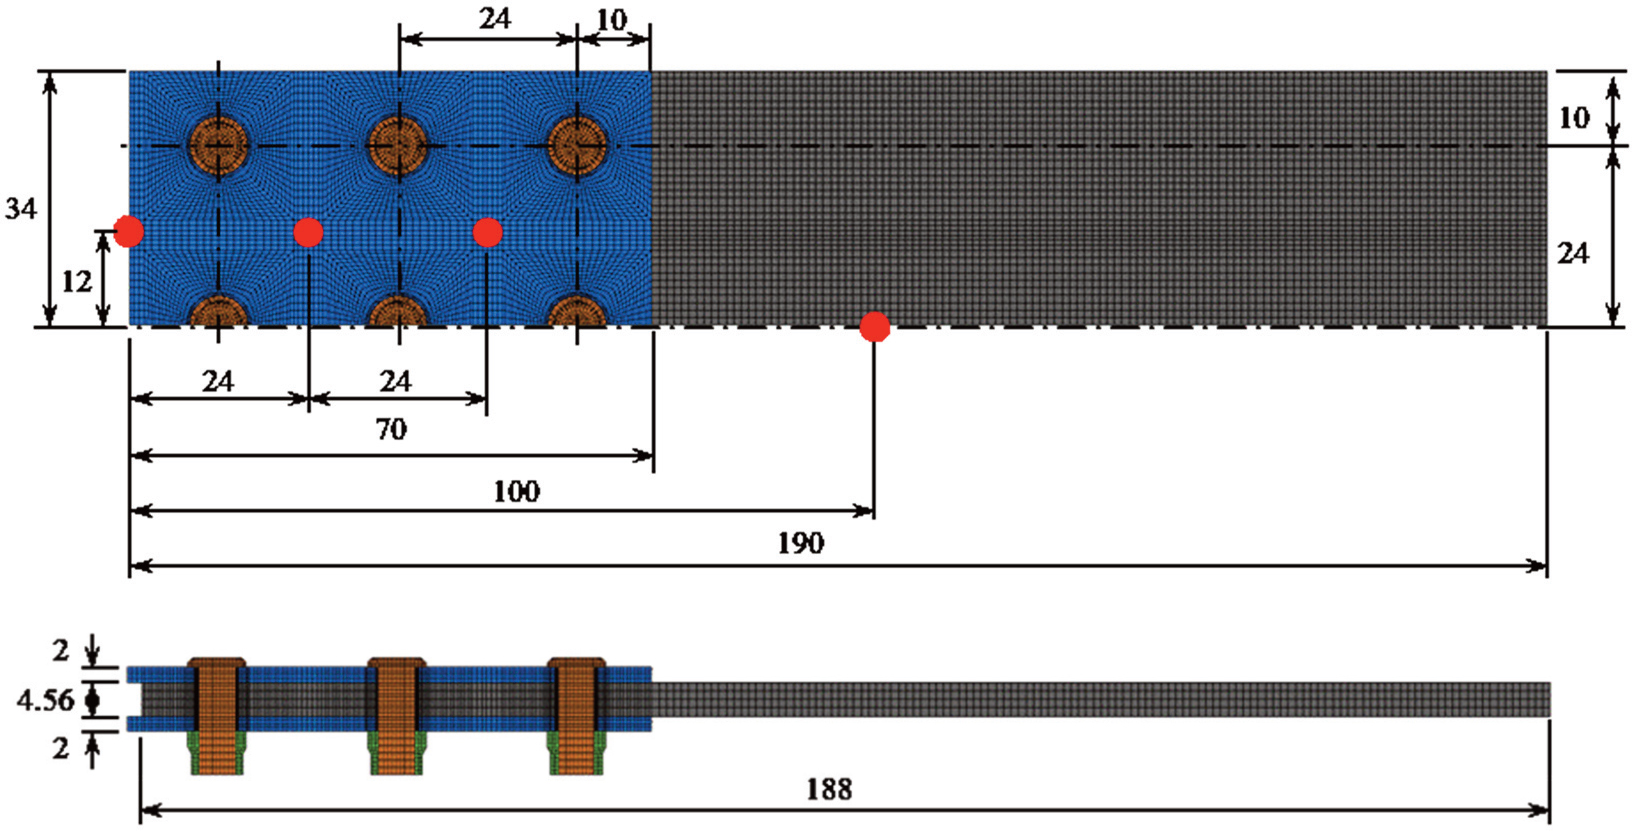
Figure 5.
FEM model.
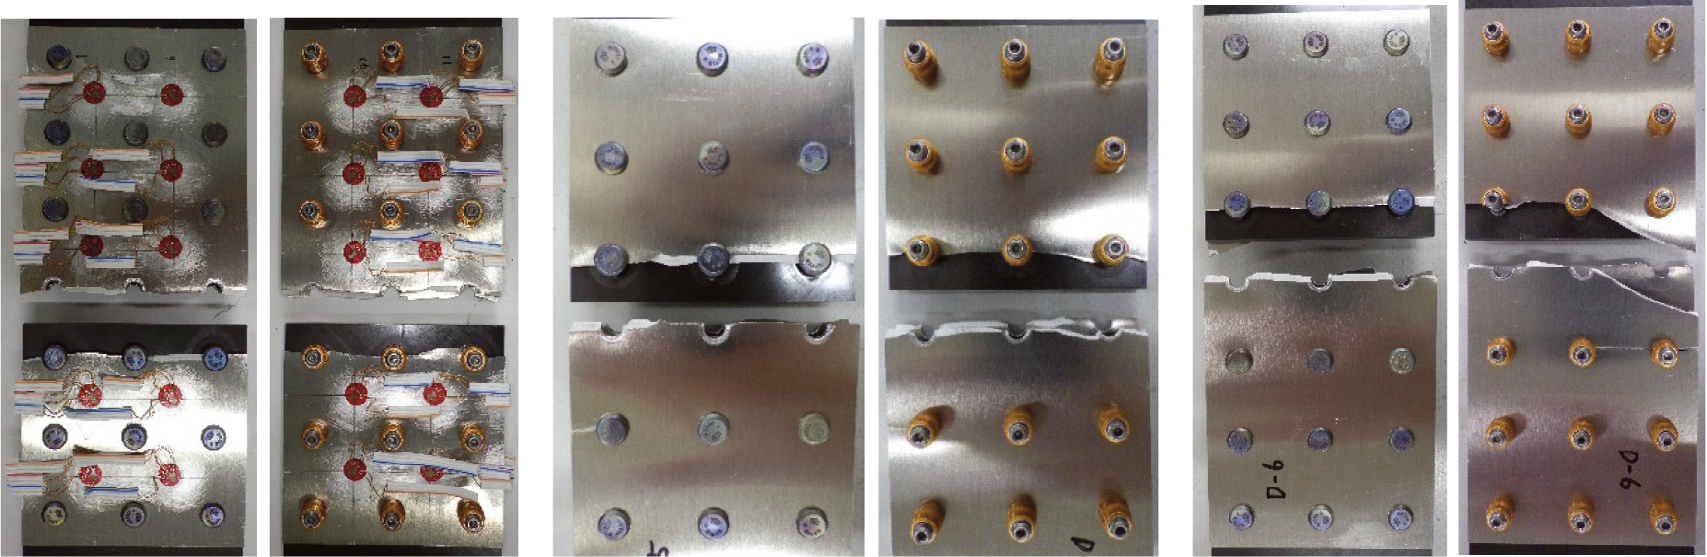
Figure 6.
Test specimen after fatigue test. (Left: 25 degrees Celsius, Middel and Right: 85 degrees Celsius)
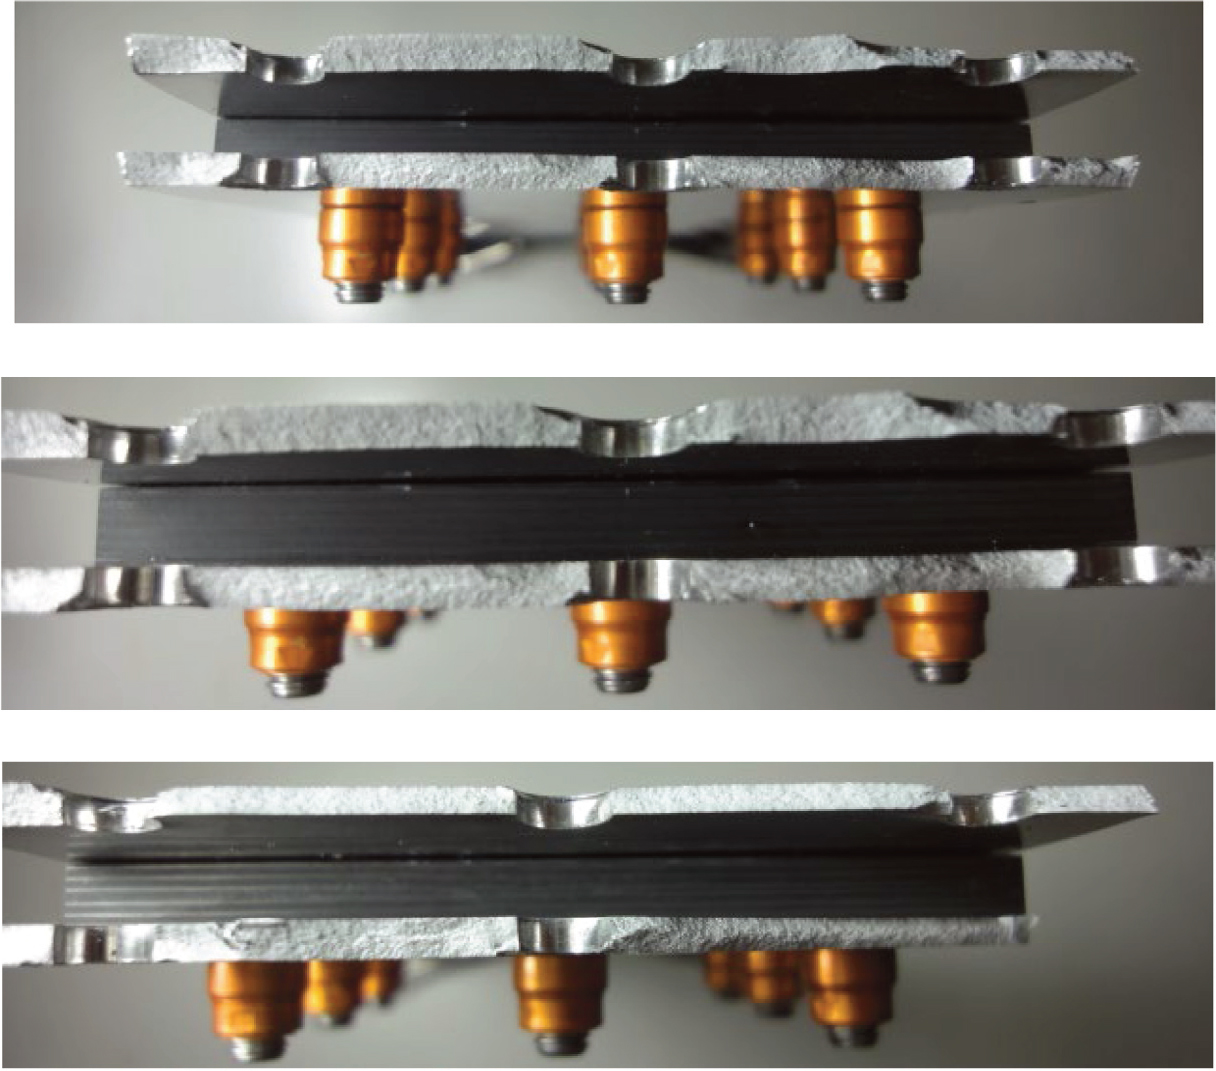
Figure 7.
Fracture surface of test specimen. (Top: 25 degrees Celsius, Middel and Bottom: 85 degrees Celsius)
Table 2.
Test results.
| Test temperature (degrees Celsius) | Total cycles | Initial cycles | No. of MB |
|---|---|---|---|
| 25 | 209,995 | 200,000 | 1 |
| 85 | 141,107 | 141,107 | 0 |
| 85 | 136,924 | 130,000 | 2 |
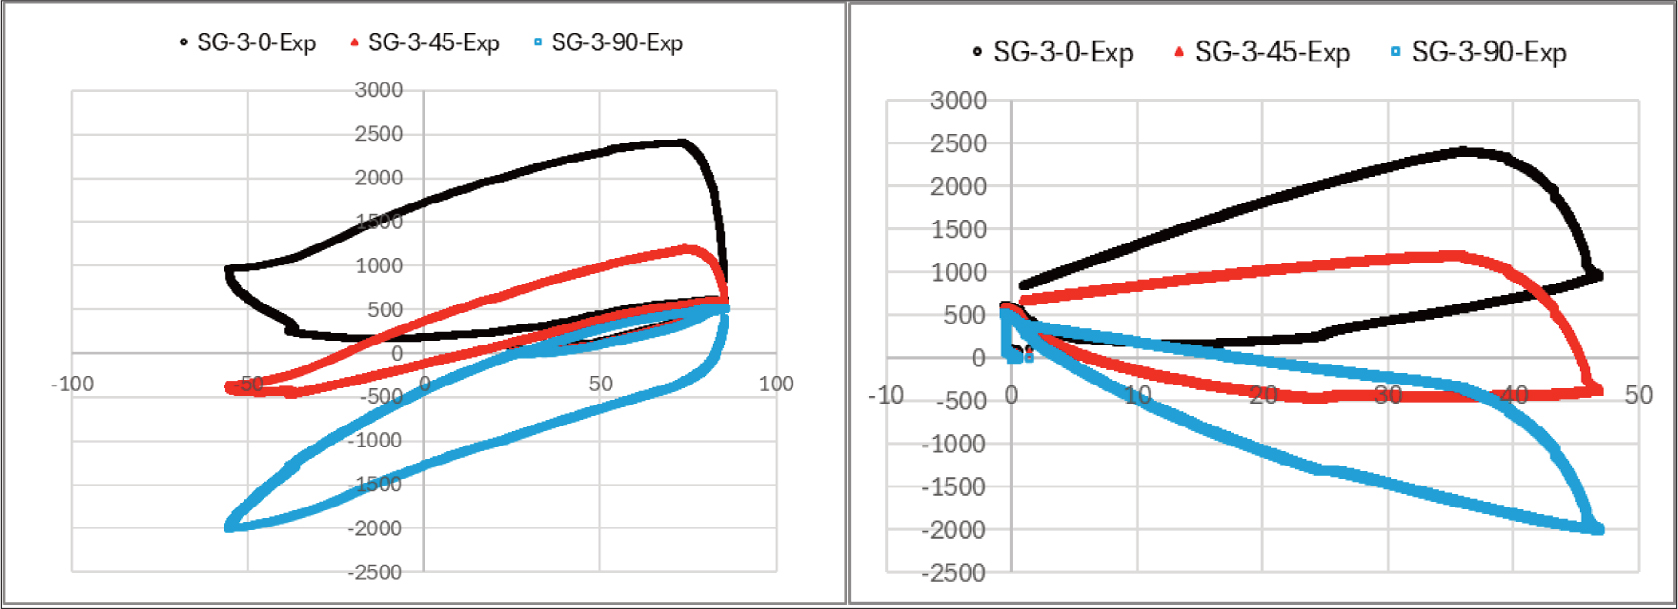
Figure 8.
Strain at SG-3 during repeated loading by coupling thermal and external loads. (Left: total strain vs test temperature, Right: total strain vs external load)
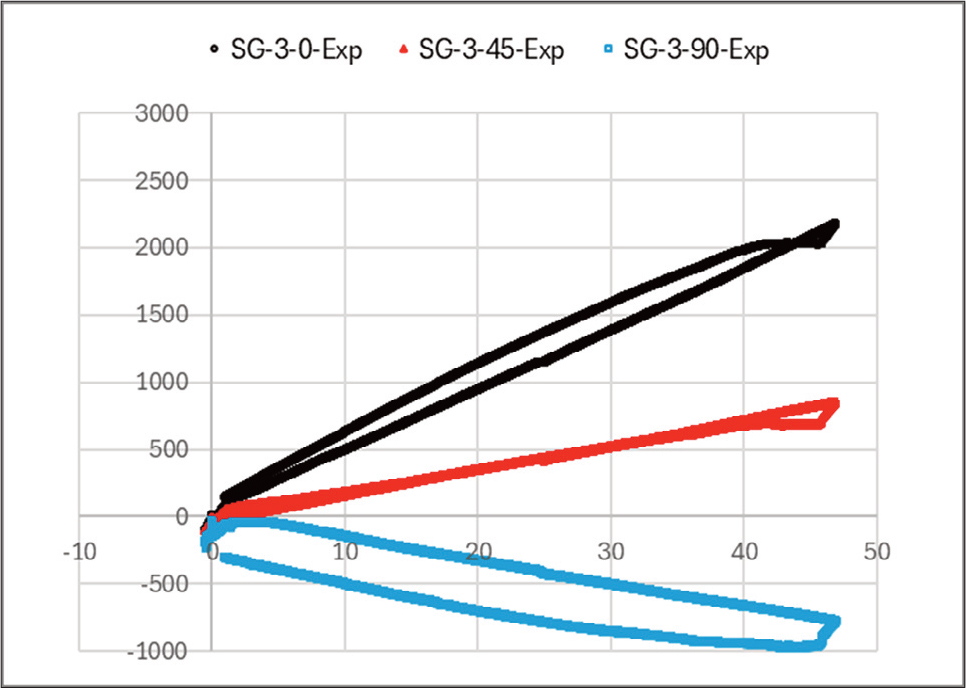
Figure 9.
Elastic strain behavior at SG-3 during repeated loading by coupling thermal and external loads.
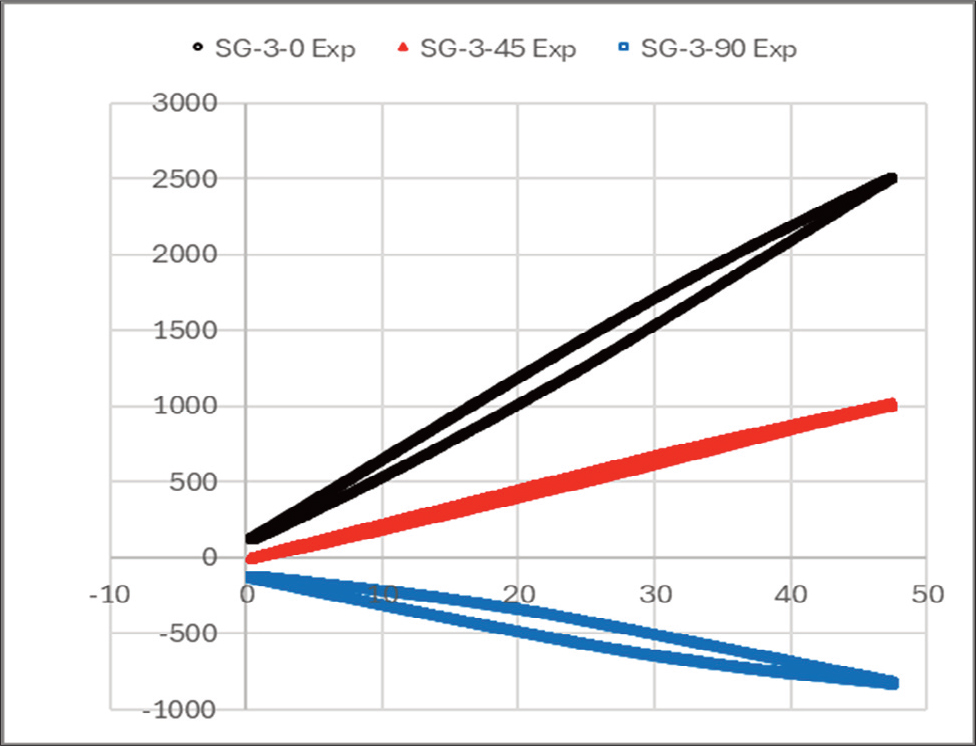
Figure 10.
Elastic strain behavior at SG-3 during cyclic external loading.
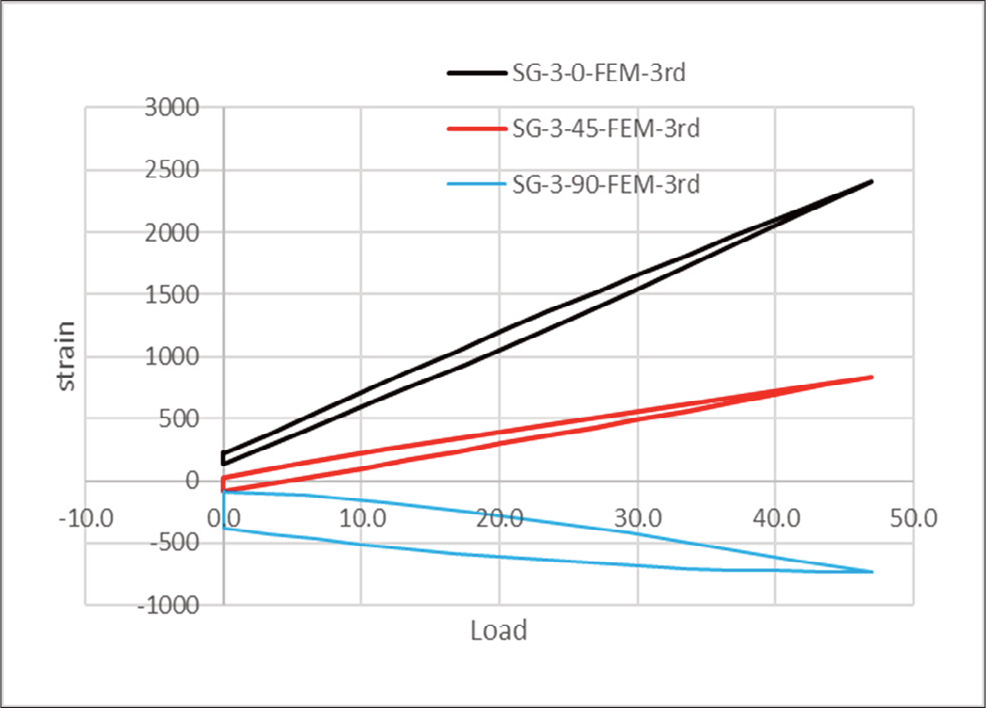
Figure 11.
Elastic strain behavior obtained by FEM at SG-3 during repeated loading by coupling thermal and external loads.
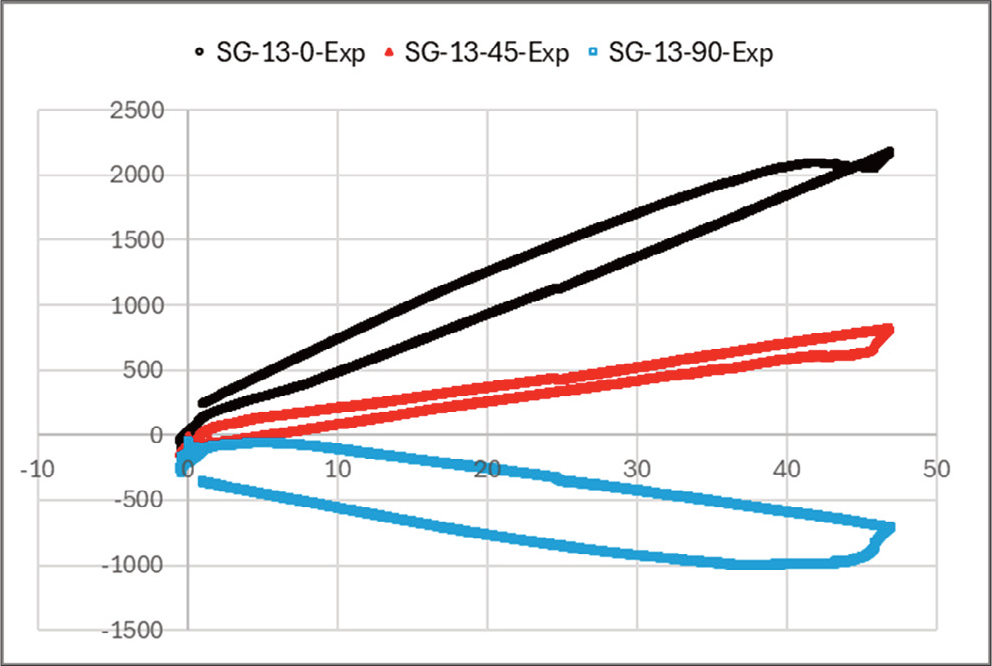
Figure 12.
Elastic strain behavior at SG-13 during repeated loading by coupling thermal and external loads.
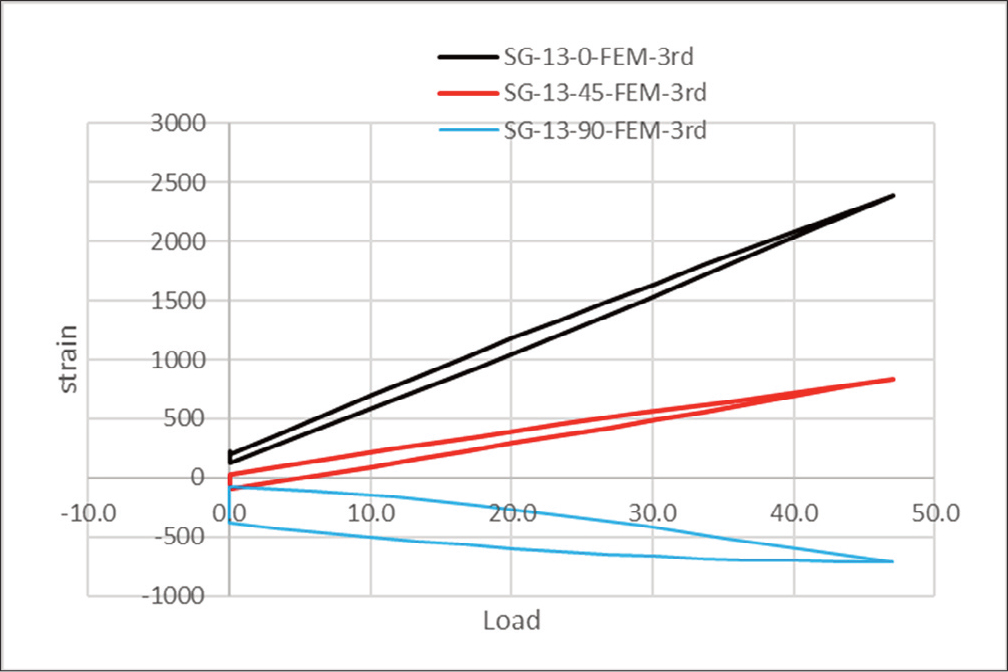
Figure 13.
Elastic strain behavior obtained by FEM at SG-13 during repeated loading by coupling thermal and external loads.
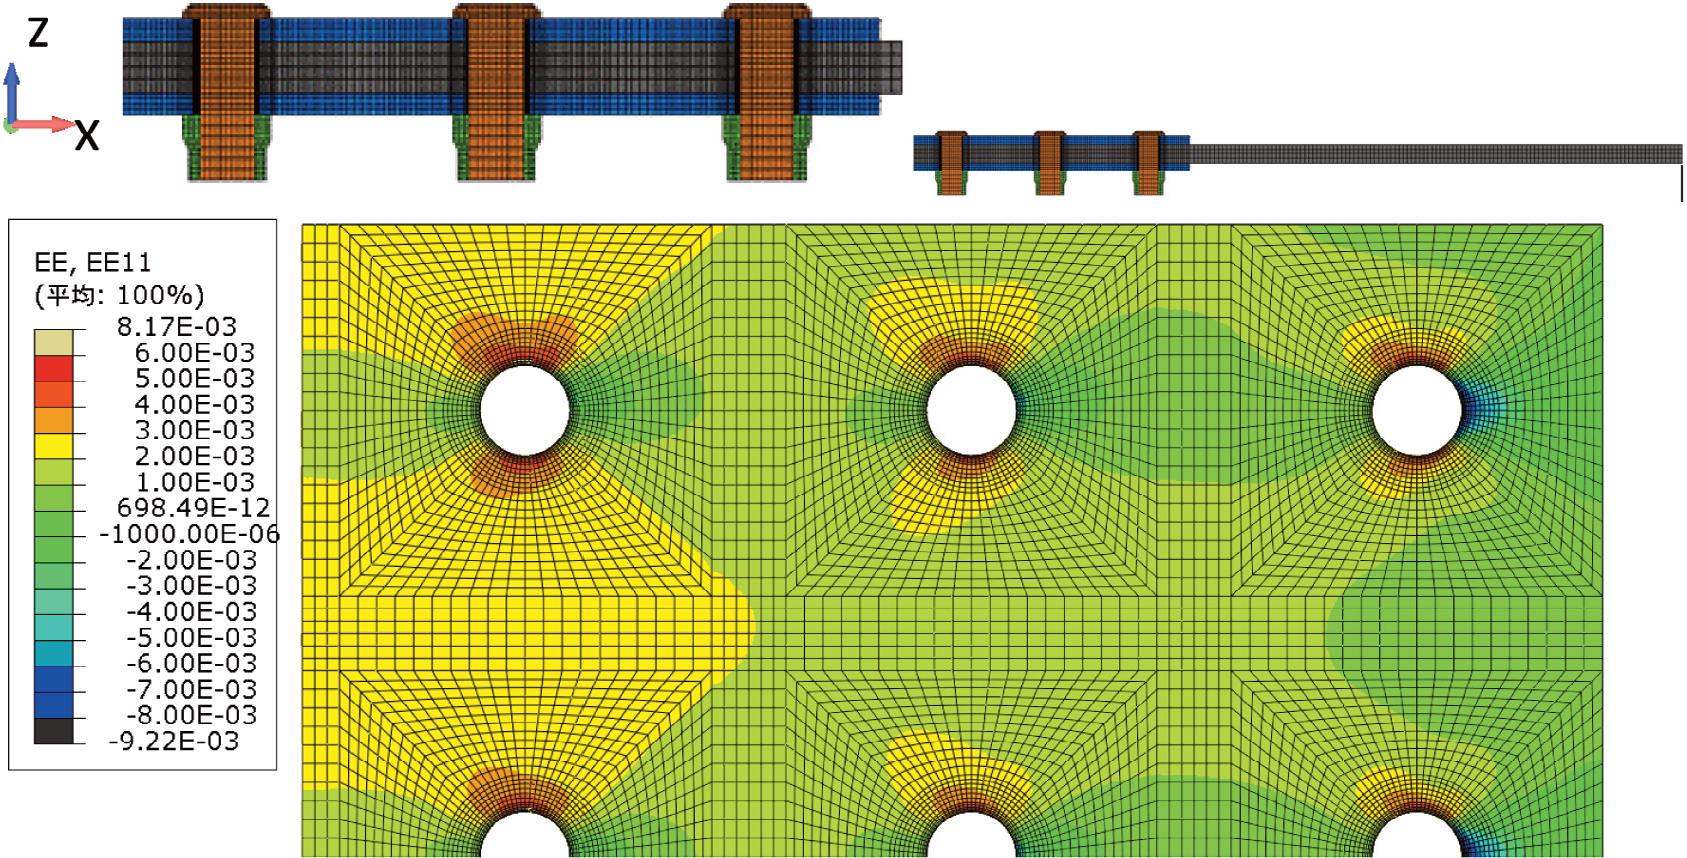
Figure 14.
Elastic strain contour on Aluminum plate (z = -2.28) obtained by FEM. (P = 47 kN, -55 degrees Celsius)
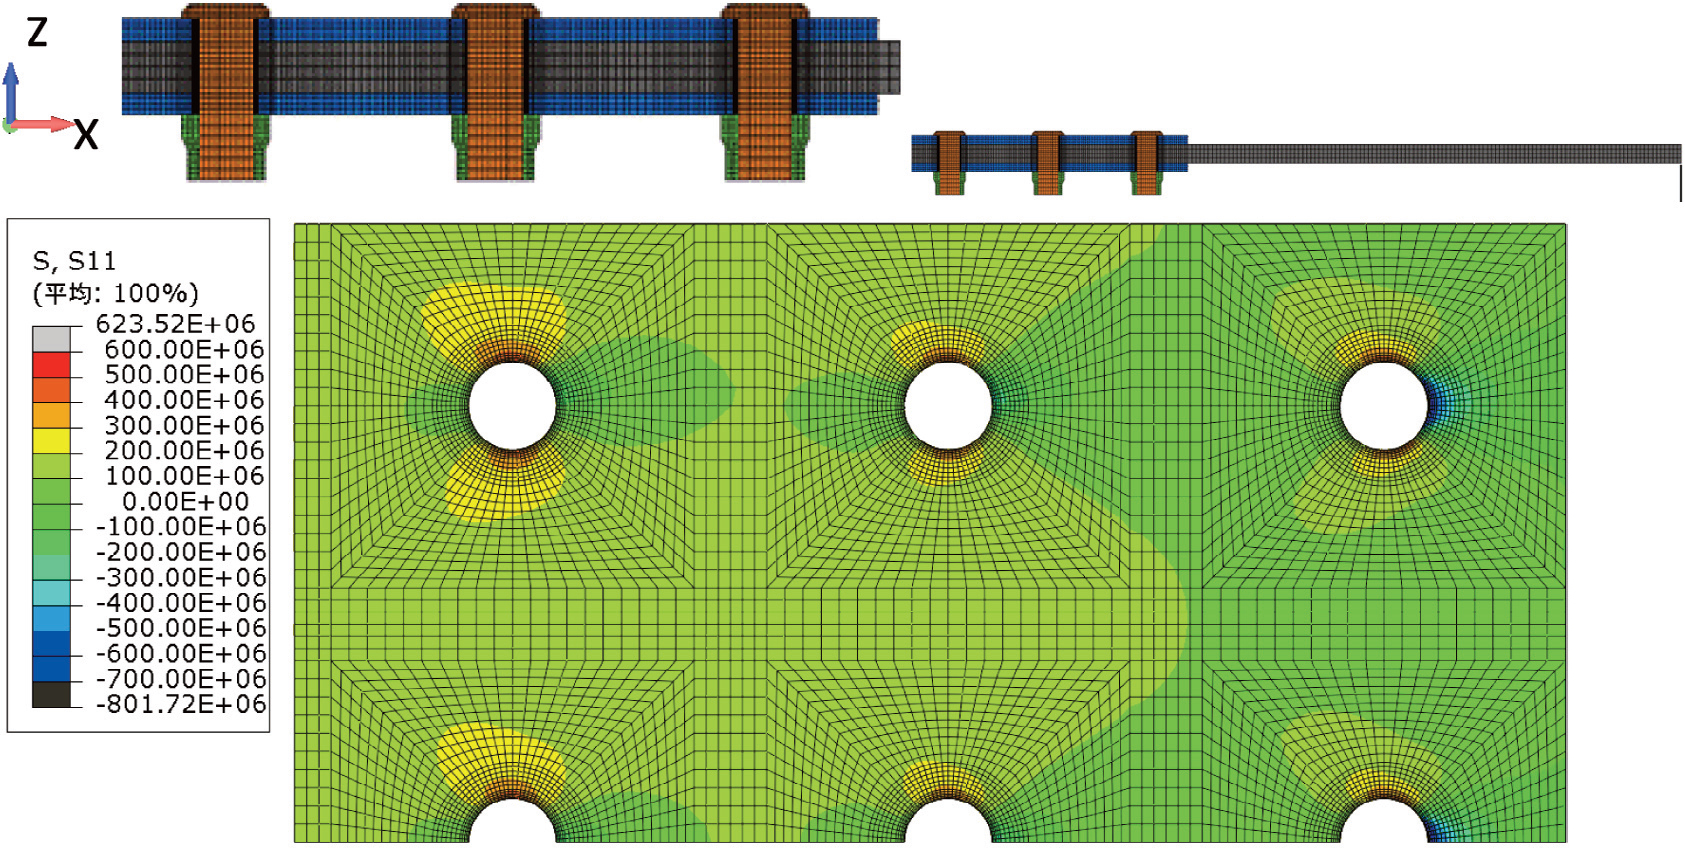
Figure 15.
Stress contour on Aluminum plate (z = -2.28) obtained by FEM. (P = 47 kN, -55 degrees Celsius)