
Table 1
Olive oil attributes researched in the scientific literature
| Attributes | Authors |
|---|---|
| Price; origin; type; taste; purchasing place | Chan-Halbrendt et al., 2010 |
| Price; origin; packaging; appearance; colour; production method | Menapace et al., 2011 |
| Country of origin; region of origin; price; brand; olive variety; producer; taste; “extra virgin” mention; colour; appearance; package; PDO label; “organic” label | Dekhili et al., 2011 |
| Area of origin; geographical designation (PDO and PGI); organic certification and price | Di Vita et al., 2013 |
| Type; taste; colour; packaging; region of origin; and price | Mtimet et al., 2013 |
| Price; origin; colour; packaging | Erraach et al., 2014 |
| Price; type (extra virgin olive oil, virgin olive oil, and olive oil); bottle (glass, plastic); and production system (organic, conventional) | Bernabéu and Díaz, 2017 |
[i] Source: Own contribution.
Table 2
Socio-demographic characteristic and travelling behaviour of the sample
| Socio-demographic characteristic (N=452) | Total sample | Non-buyers of olive oil at the destination | Buyers of olive oil at the destination | |||||
|---|---|---|---|---|---|---|---|---|
| N | % | N | % | N | % | |||
| Variable | Gender | Male | 152 | 36.9 | 59 | 34.7 | 93 | 38.6 |
| Female | 259 | 63.1 | 111 | 65.3 | 148 | 61.4 | ||
| Elementary school | 13 | 3.1 | 7 | 3.6 | 6 | 2.6 | ||
| Education | High school | 134 | 31.8 | 71 | 36.4 | 63 | 27.8 | |
| University and more | 275 | 65.1 | 117 | 60 | 158 | 69.6 | ||
| Self-employed | 74 | 17.4 | 37 | 18.9 | 37 | 15.9 | ||
| Employed | 306 | 71.8 | 140 | 71.8 | 166 | 71.8 | ||
| Occupation | Retired | 26 | 6.1 | 10 | 5.1 | 16 | 6.9 | |
| Student | 16 | 3.8 | 3 | 1.7 | 13 | 5.4 | ||
| Unemployed | 4 | 0.9 | 4 | 2.5 | 0 | 0 | ||
| Up to 25 | 35 | 8.5 | 16 | 8.6 | 19 | 8.4 | ||
| 26–40 | 134 | 32.5 | 56 | 29.9 | 78 | 34.7 | ||
| Age | 41–55 | 181 | 43.9 | 86 | 46 | 95 | 42.2 | |
| 56–66 | 46 | 11.2 | 23 | 12.3 | 23 | 10.2 | ||
| 67 and more | 16 | 3.9 | 6 | 3.2 | 10 | 4.5 | ||
| Income | Up to 700 euro | 18 | 5.2 | 6 | 4.1 | 12 | 6.0 | |
| 700–1,000 euro | 53 | 15.3 | 21 | 14.4 | 32 | 15.9 | ||
| 1,001–1,500 euro | 84 | 24.2 | 41 | 28.1 | 43 | 21.4 | ||
| 1,501–2,500 euro | 101 | 29.1 | 42 | 28.7 | 59 | 29.4 | ||
| More than 2,500 euro | 91 | 26.2 | 36 | 24.7 | 55 | 27.3 | ||
| Country of origin | Austria | 101 | 23.8 | 38 | 19.7 | 63 | 25.3 | |
| Germany | 90 | 21.2 | 37 | 19.1 | 53 | 21.3 | ||
| Italy | 86 | 20.2 | 65 | 33.7 | 21 | 8.4 | ||
| Croatia | 32 | 7.5 | 7 | 3.6 | 25 | 10 | ||
| Slovenia | 31 | 7.3 | 9 | 4.7 | 22 | 8.8 | ||
| Other | 85 | 20 | 37 | 19.2 | 48 | 26.2 | ||
| Country producing or not producing of olive oil | Producer | 150 | 35.3 | 81 | 42.1 | 69 | 29.6 | |
| Nonproducer | 275 | 64.7 | 111 | 57.9 | 164 | 70.4 | ||
| Travel behaviour (N=452) | N | % | N | % | N | % | ||
| Variable | Type of accommodation | Hotel | 338 | 74.8 | 161 | 79.9 | 177 | 71 |
| Campsite | 114 | 25.2 | 42 | 20.1 | 72 | 29 | ||
| Length of stay | 1–2 days | 4 | 1 | 1 | 0.5 | 3 | 1.4 | |
| 3–6 days | 96 | 24.2 | 55 | 29.3 | 41 | 19.5 | ||
| 7 and more | 298 | 74.8 | 132 | 70.2 | 166 | 79.1 | ||
| Number of previous visits | No previous visits | 84 | 21.6 | 44 | 23.9 | 40 | 19.2 | |
| 1–2 times | 56 | 14.4 | 35 | 19 | 24 | 11.5 | ||
| 3 or more times | 249 | 64.0 | 105 | 57.1 | 144 | 69.3 | ||
[i] Source: Own elaboration.
Table 3
The impact of socio-demographic and travel behaviour variables on the purchase of local olive oil using binary logistic regression analysis
| Variables Not in the Equation | |||||||
| Step 0 | Variables | Score | df | Sig | |||
| Gender | 1.243 | 1 | .537 | ||||
| Age | 1.331 | 1 | .856 | ||||
| Education | 2.390 | 1 | .495 | ||||
| Occupation | 1.783 | 1 | .776 | ||||
| Income | 3.686 | 1 | .450 | ||||
| Type of accommodation | 1.751 | 1 | .186 | ||||
| Length of stay | 2.294 | 1 | .318 | ||||
| Number of previous visits | 5.408 | 1 | .020 | ||||
| From a country producing or not producing olive oil | 10.066 | 1 | .002 | ||||
| Overall statistics | 31.639 | 9 | .084 | ||||
| Overall percentage correct | 54.7% | ||||||
| The cut value | 0.500 | ||||||
| Variables in the Equation | |||||||
| Step 1 | Variables | B | SE. | Wald | df | Sig. | Exp (B) |
| Gender | .229 | .297 | .592 | 1 | .442 | 1.257 | |
| Age | .273 | .642 | .181 | 1 | .671 | 1.314 | |
| Education | 1.083 | .951 | 1.299 | 1 | .254 | 2.955 | |
| Occupation | .776 | .770 | 1.015 | 1 | .314 | 1.072 | |
| Income | −.947 | .956 | .981 | 1 | .322 | 2.181 | |
| Type of accommodation | −.294 | .315 | .869 | 1 | .351 | .738 | |
| Length of stay | −.197 | .338 | .339 | 1 | .560 | .821 | |
| Number of previous visits: 3 or more times | .894 | .351 | 6.488 | 1 | .011 | 2.318 | |
| Provenance from a country producing or not producing olive oil | 1.059 | .324 | 10.713 | 1 | .001 | 2.828 | |
| Constant | −2.052 | 1.420 | 2.086 | 1 | .149 | .129 | |
| Model diagnostics Classification of variables in equation results | |||||||
| Overall percentage correct | 62.6% | ||||||
| The cut value | 0.500 | ||||||
| Omnibus test of model coefficients | Chi-Square: 34.175 | Sig: .047 | |||||
| Hosmer and Lemeshow test | Chi-Square: 9.209 | Sig: .325 | |||||
| Cox and Snell R square | .121 | ||||||
| Nagelkerke R square | .162 | ||||||
[i] Note: STEP 0 shows the results of a score test. The column labelled “Score” gives the estimated change in the model fit if the term is added to the model, the other two columns give the degrees of freedom (df) and p-value (Sig.).
[ii] STEP 1 shows the regression coefficients (B), their standard errors (SE), the Wald test statistic with associated degrees of freedom (df) and p-values (Sig.), and the Exp (B) (exponentiated coefficient).
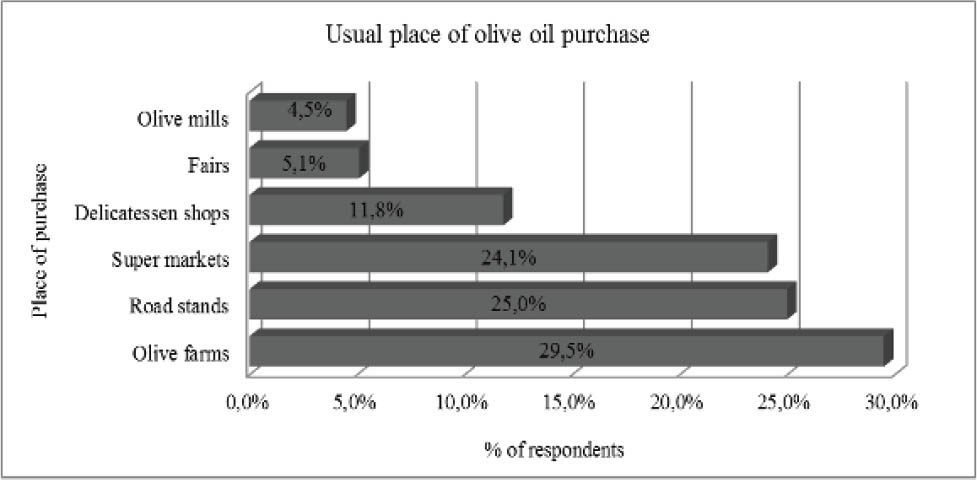
Figure 1
Usual place of olive oil purchase
Source: Own elaboration.
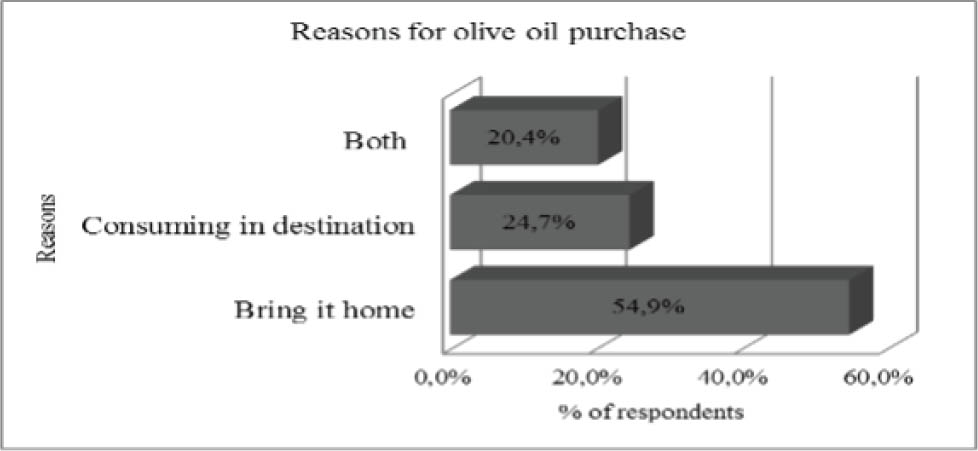
Figure 2
Reasons for olive oil purchase
Source: Own elaboration.
Table 4
Importance of intrinsic and extrinsic attributes of olive oil for tourists (buyers) of olive oil in Croatia
| Intrinsic attributes | Mean (M) | SD |
|---|---|---|
| Taste | 4.62 | 0.680 |
| Aroma | 4.51 | 0.744 |
| Colour | 3.84 | 0.995 |
| Extrinsic attributes | ||
| Olive oil category (virgin, extra virgin) | 4.21 | 0.907 |
| Method of production (cold-pressed) | 4.12 | 1.035 |
| Protected designation of origin (PDO)/protected geographical indication (PGI) | 3.90 | 1.043 |
| Product eco-label | 3.90 | 1.007 |
| Country of origin | 3.82 | 1.037 |
| Price | 3.44 | 0.883 |
| Packaging | 3.18 | 1.112 |
[i] Source: Own elaboration.
Table 5
Principal component analysis for the importance of local olive oil attributes
| Component/item (% of explained variance) | Mean (M) | SD | Factor loading | Cronbach α |
|---|---|---|---|---|
| Component 1: Information (40.651%) | .845 | |||
| Protected designation (origin, geographical indication) | 3.90 | 1.043 | 0.828 | |
| Product eco-label | 3.90 | 1.007 | 0.798 | |
| Country of origin | 3.82 | 1.037 | 0.759 | |
| Method of production (cold pressed) | 4.12 | 1.035 | 0.757 | |
| Olive oil category (virgin, extra virgin) | 4.21 | 0.907 | 0.654 | |
| Component 2: Flavour (15.247%) | .844 | |||
| Taste | 4.62 | 0.680 | 0.900 | |
| Aroma | 4.51 | 0.744 | 0.891 | |
| Component 3: Price and packaging (14.606%) | .681 | |||
| Price | 3.44 | 0.883 | 0.856 | |
| Packaging | 3.18 | 1.112 | 0.800 |
[i] Source: Own elaboration.
Table 6
Final cluster centers
| Component | Cluster | F – value | |||
|---|---|---|---|---|---|
| 1 | 2 | 3 | 4 | ||
| The exterior lovers | The labels lovers | The indifferent consumers | The experts | ||
| Information | .551127 | .637358 | −.793931 | −.997363 | 96.276** |
| Flavour | −.008902 | .138469 | −2.067185 | .623947 | 107.501** |
| Price and packaging | .823677 | −1.150956 | −.433139 | .055069 | 98.627** |
| Sample size (%) | 37.4%, n=86 | 24.3%, n=56 | 10%, n=23 | 28.3%, n=65 | |