

Table 1.
Variable definitions, measurement and data sources
| Variable | Measurement | Unit | Level | Source |
|---|---|---|---|---|
| Startupsict | Newly established cleantech and environmentally oriented start-ups | Count | Industry–country–year | Dealroom.co; PitchBook; regional cleantech reports |
| VCict | Venture-capital and private-equity funding raised by green start-ups | Constant 2015 EUR | Industry–country–year | Dealroom.co; PitchBook; regional cleantech reports; Eurostat HICP |
| Patentsict | Patent applications in CPC Y02 and related climate-technology subclasses | Count | Industry–country–year | OECD Patent Statistics Database; EPO PATSTAT |
| DTRIict | DTRI (first principal component of AI, IoT, cloud, big data and ICT specialists) | PCA index | Industry–country–year | Eurostat ICT survey |
| GVAict | Gross value added | EUR | Industry–country–year | Eurostat National Accounts |
| GFCFict | Gross fixed capital formation | EUR | Industry–country–year | Eurostat National Accounts |
| EMPict | Employment | Tens of thousands of persons | Industry–country–year | Eurostat National Accounts |
| GDP pcict | GDP per capita (PPP) | Constant international dollars | Country–year | World Bank; IMF |
| RnDict | R&D expenditure | % of GDP | Country–year | Eurostat; OECD |
| EDUict | Population aged 25–34 with tertiary education | % | Country–year | Eurostat |
[i] Source: Authors' elaboration based on Dealroom.co, PitchBook, regional cleantech reports, OECD Patent Statistics Database, EPO PATSTAT, Eurostat, WIPO, World Bank, IMF and OECD.
[iii] AI, artificial intelligence; DTRI, digital twin readiness index; ICT, information and communication technology; EUR, euro; GDP, gross domestic product; HICP, Harmonised Index of Consumer Prices; IMF, International Monetary Fund; IoT, Internet of Things; OECD, Organisation for Economic Co-operation and Development; PATSTAT, Worldwide Patent Statistical Database of the European Patent Office; PCA, principal component analysis; PPP, purchasing power parity; R&D, research and development.
Table 2.
PCA construction of the DTRI
| Indicator | Mean | SD | PCA coefficient | Factor loading | Direction |
|---|---|---|---|---|---|
| AI use | 8.16 | 7.891 | 0.518 | 0.912 | Positive |
| IoT use | 26.075 | 10.132 | 0.056 | 0.098 | Positive |
| Cloud computing | 28.575 | 16.036 | 0.403 | 0.71 | Positive |
| Big data analytics | 11.651 | 5.21 | 0.519 | 0.914 | Positive |
| ICT specialists | 22.374 | 20.008 | 0.544 | 0.959 | Positive |
| Explained variance of PC1 | 62.03% |
[i] Note: All indicators are standardised over the pooled country–industry–year sample before PCA. PCA coefficients refer to the eigenvector weights used to construct the first principal component. Factor loadings report the correlation between each standardised indicator and the DTRI score. The sign of PC1 is normalised so that higher values indicate stronger digital twin-related readiness.
Table 3.
Descriptive statistics for key variables, 2015–2024
| Variables | Observations (N) | Mean | SD | Minimum | Maximum |
|---|---|---|---|---|---|
| Yict | |||||
| Startupsict (number) | 270 | 0.61 | 1.23 | 0 | 5 |
| VCict (millions of euros) | 270 | 45.89 | 203.15 | 0 | 2679.5 |
| Patentsict (number) | 270 | 5.38 | 9.01 | 0 | 42 |
| Xict | |||||
| DTRIict (index) | 270 | −0.16 | 1.45 | −2.38 | 6.08 |
| Industry-level control variable | |||||
| GVAict (billions of euros) | 270 | 12.37 | 15.81 | 0.03 | 70.92 |
| GFCFict (billions of euros) | 270 | 2.95 | 4.12 | 0.03 | 16.88 |
| EMPict (tens of thousands of people) | 270 | 2.51 | 2.68 | 0.03 | 10.94 |
| Country-level control variable | |||||
| GDP_pcict (thousands of constant international dollars) | 270 | 18.35 | 4.87 | 12.01 | 28.74 |
| RnDict (% of GDP) | 270 | 0.46 | 0.29 | 0.11 | 1.06 |
| EDUict (% of pop. 25–34) | 270 | 47.11 | 6.78 | 38.5 | 58.2 |
[i] Source: own calculations based on the dataset described in Table 1; Eurostat ICT usage and e-commerce survey indicators (for DTRI components) and Eurostat National Accounts (industry controls), with country-level indicators from World Bank/IMF and Eurostat/OECD.
[iii] DTRI, digital twin readiness index; ICT, information and communication technology; SD, standard deviation; EMP, employment; GFCF, gross fixed capital formation; GDP, gross domestic product; GVA, gross value added; IMF, International Monetary Fund; OECD, Organisation for Economic Co-operation and Development; R&D, research and development; VC, venture capital.
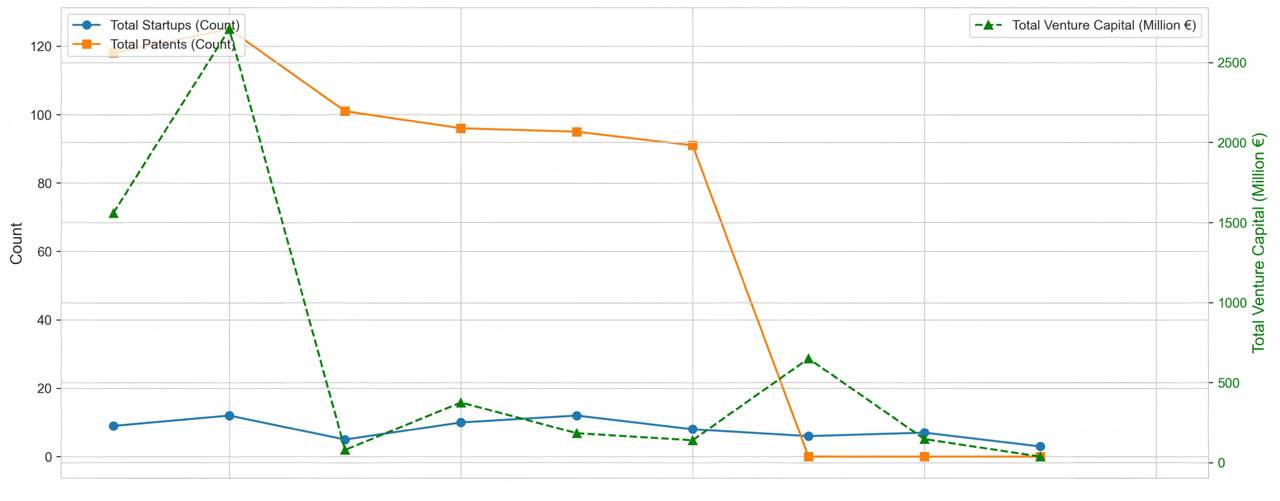
Figure 1.
Trends in Baltic green entrepreneurial outcomes, 2015–2024. Source: Authors' calculations based on the country–industry–year panel described in Section 3 and Table 1
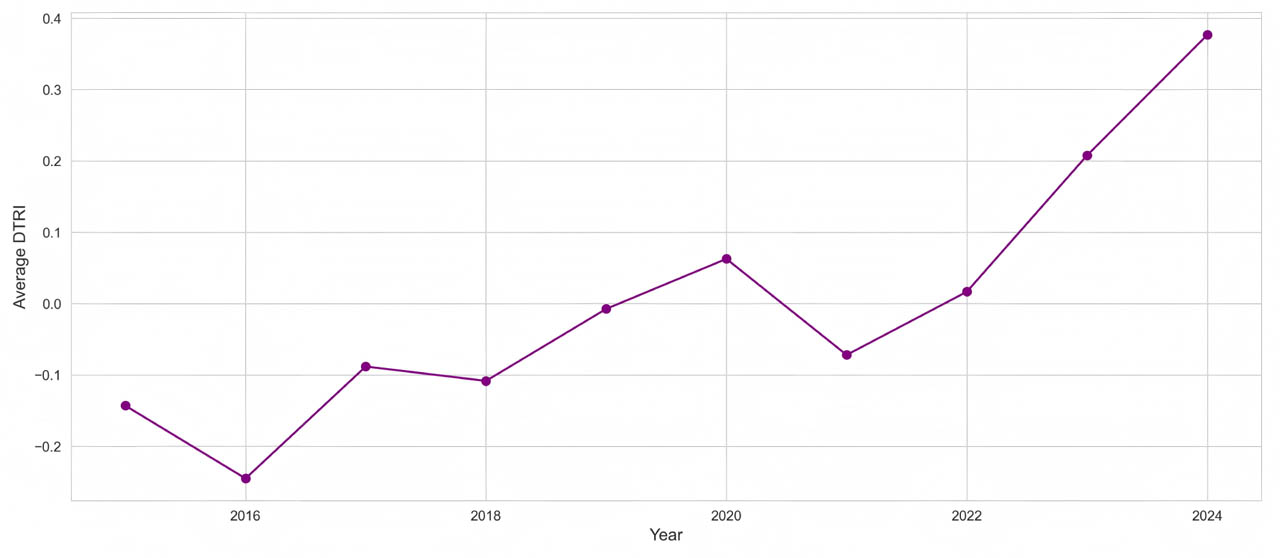
Figure 2.
Average DTRI in the Baltic States, 2015–2024. Source: Own calculations based on Eurostat ‘Enterprise use of ICTs and e-commerce’ survey indicators. DTRI, digital twin readiness index; ICT, information and communication technology
Table 4.
Baseline fixed-effects regression results for green entrepreneurial outcomes
| Variables | (1) ln(1 + Startupsict) | (2) ln(1 + VCict) | (3) ln(1 + Patentsict) |
|---|---|---|---|
| DTRI | 0.079* | 0.142** | 0.103** |
| (0.042) | (0.061) | (0.049) | |
| ln(GVA) | 0.195** | 0.321*** | 0.174* |
| (0.088) | (0.105) | (0.096) | |
| ln(GFCF) | 0.091 | 0.182* | 0.088 |
| (0.071) | (0.095) | (0.080) | |
| GDP_pcct | 0.488** | 0.815*** | 0.601** |
| (0.225) | (0.287) | (0.271) | |
| R&D | 1.192** | 2.433*** | 1.895*** |
| (0.510) | (0.721) | (0.654) | |
| Fixed effects | |||
| Industry | Yes | Yes | Yes |
| Country | Yes | Yes | Yes |
| Year | Yes | Yes | Yes |
| Statistic | |||
| Observations (N) | 270 | 270 | 270 |
| Within-group R-squared | 0.27 | 0.34 | 0.30 |
Source: Own calculations based on the dataset described in Table 1 (2015–2024).
Table 5.
Difference-in-differences estimates around digitalisation policy exposure
| Dependent Variable | ATT |
|---|---|
| ln(1 + Startupsict) | 0.168* |
| (0.091) | |
| ln(1 + VCict) | 0.275** |
| (0.113) | |
| ln(1 + Patentsict) | 0.221** |
| (0.098) |
Source: Own calculations based on the dataset described in Table 1.
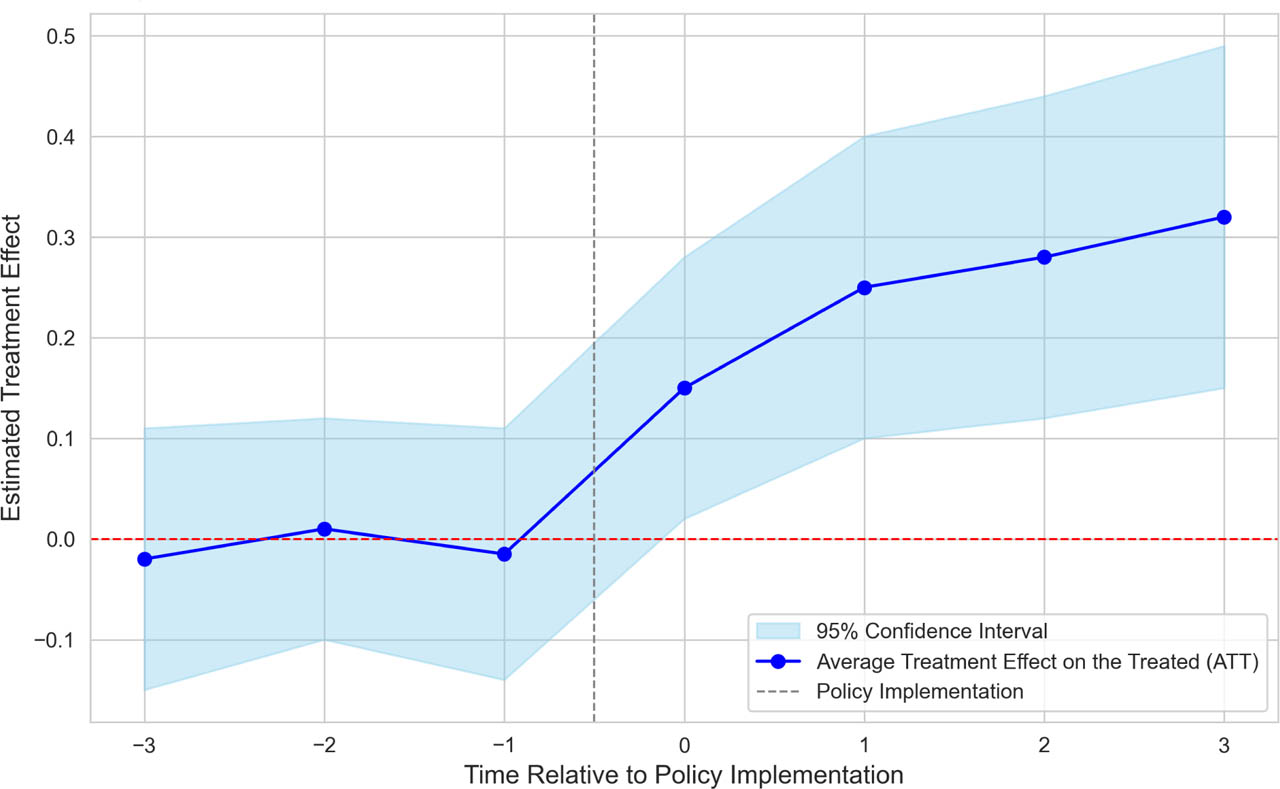
Figure 3.
Event-study estimates around digitalisation policy exposure and green entrepreneurial outcomes Source: Own calculations based on the dataset described in Table 1
Table 6.
Instrumental-variable regression results
| (1) ln(1 + Startupsict) | (2) ln(1 + VCict) | (3) ln(1 + Patentsict) | |
|---|---|---|---|
| Panel A: First-stage regression (dependent variable: DTRI) | |||
| Instrumental variable (IV) | 0.812*** | 0.812*** | 0.812*** |
| (0.185) | (0.185) | (0.185) | |
| Kleibergen–Paap F-statistic | 19.24 | 19.24 | 19.24 |
| Panel B: Second-stage regression (dependent variable: green entrepreneurial outcomes) | |||
| DTRI (instrumental variables approach) | 0.181* | 0.315*** | 0.266*** |
| (0.098) | (0.109) | (0.092) | |
| Statistic | |||
| Observations (N) | 270 | 270 | 270 |
Source: Own calculations based on the dataset described in Table 1.
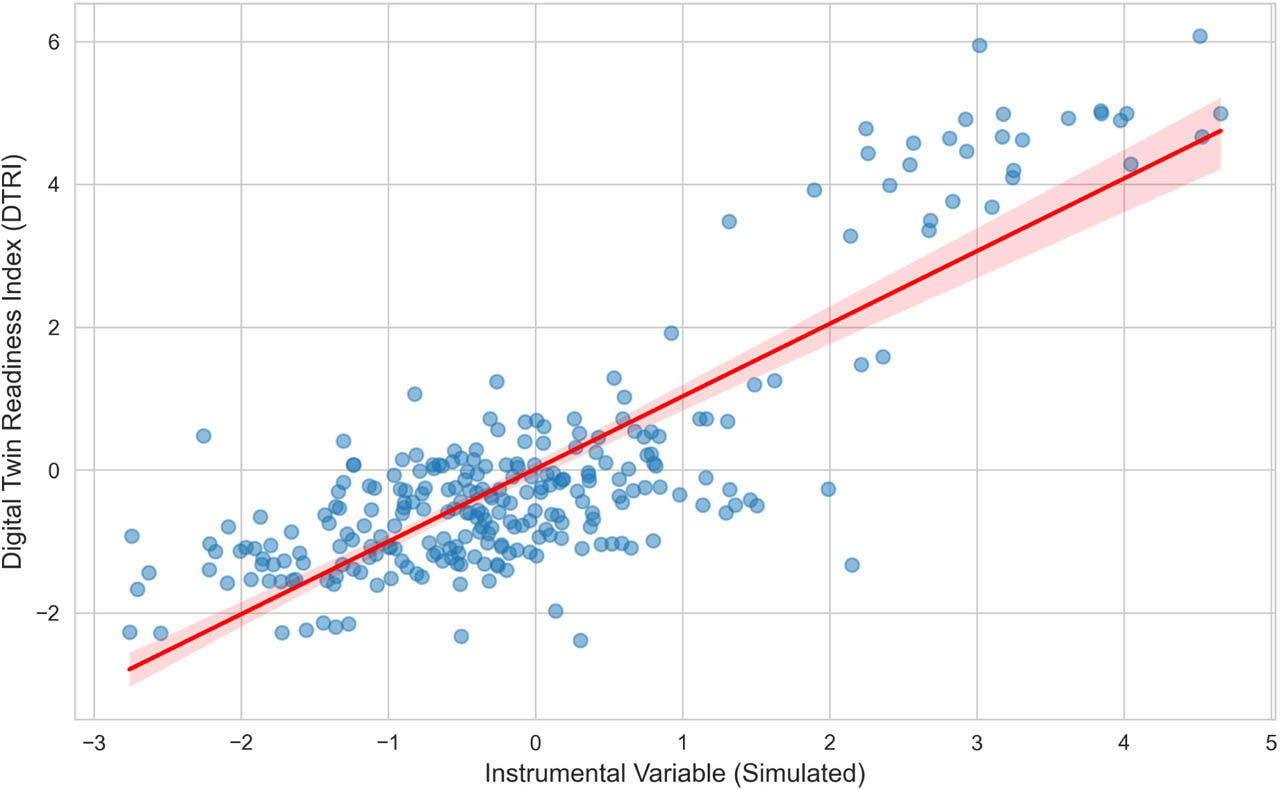
Figure 4.
First-stage relationship in the instrumental-variable specification.
Source: Authors' calculations based on the country–industry–year panel described in Section 3 and Table 1
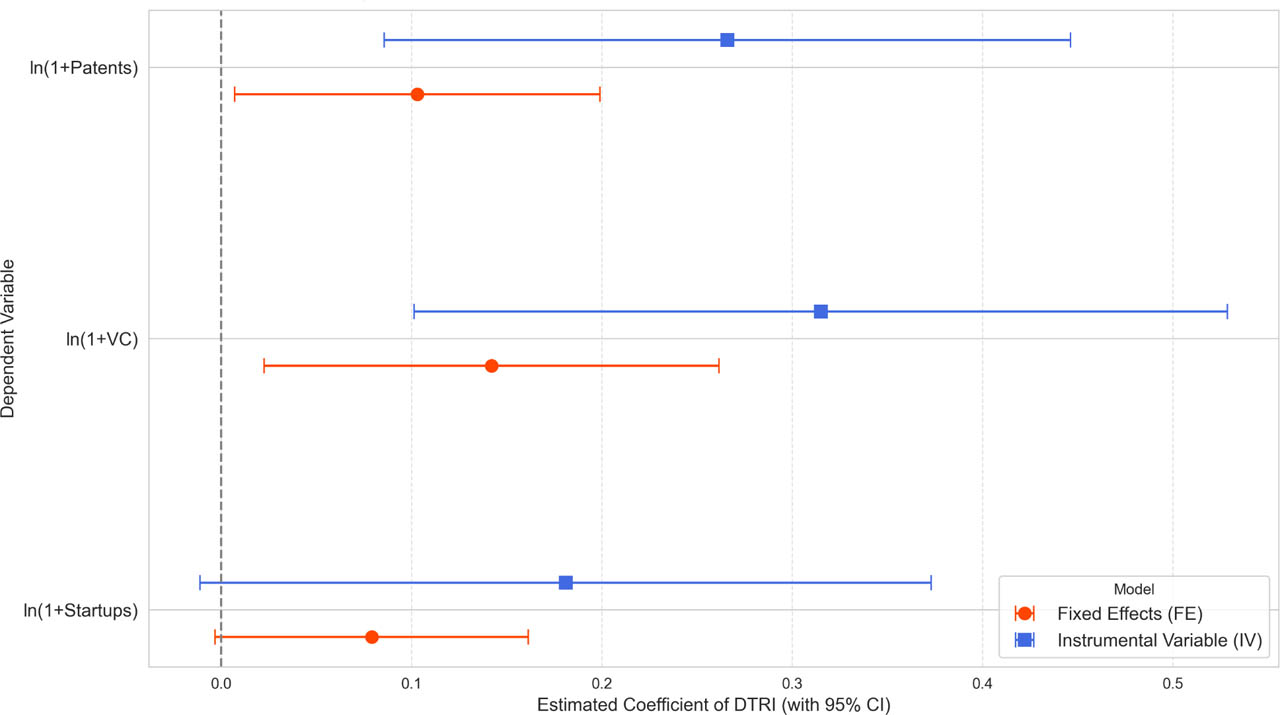
Figure 5.
Comparison of DTRI coefficients across empirical models
Source: Authors' calculations based on the regression results reported in Tables 4–6. DTRI, digital twin readiness index
Table A.1.
FE and IV regression results for the later-period subsample, 2021–2024
| Variables | (1) ln(1 + Startups) (FE) | (2) ln(1 + VC) (FE) | (3) ln(1 + Patents) (FE) | (4) ln(1 + Startups) (IV) | (5) ln(1 + VC) (IV) | (6) ln(1 + Patents) (IV) |
|---|---|---|---|---|---|---|
| DTRI | 0.091* | 0.137** | 0.115* | 0.195* | 0.302** | 0.255** |
| −0.052 | −0.065 | −0.061 | −0.105 | −0.122 | −0.114 | |
| Controls | Yes | Yes | Yes | Yes | Yes | Yes |
| Fixed effects | Yes | Yes | Yes | Yes | Yes | Yes |
| Observations | 108 | 108 | 108 | 108 | 108 | 108 |
| K-P F-stat | 15.88 | 15.88 | 15.88 |
Note: Robust standard errors clustered at the country–industry level are reported in parentheses. The subsample contains 108 country–industry–year observations from 2021 to 2024. Reported controls follow the baseline specification: ln(GVA), ln(GFCF), GDP per capita and R&D intensity. The Kleibergen–Paap F-statistic is reported only for the IV specifications.