

1. Introduction
In the European Union (EU), green and digital transformations are increasingly regarded as mutually reinforcing pillars of economic transformation, industrial modernisation and sustainable development (Mondejar et al., 2021; Bianchini, Damioli & Ghisetti, 2022; Liu, Liu & Ren, 2023; Zou & Ahmad, 2023). Recent studies have further shifted the twin transition debate towards regional specialisation, green finance policy and the uneven co-location of green, digital and twin economic activities (Cicerone, Losacker & Ortega-Argilés, 2026; Wang et al., 2026). This literature suggests that the green–digital nexus is not only a macro-level policy agenda but also a meso-level question of whether specific regions and industries possess related capabilities that allow digital and environmental activities to reinforce each other. At the same time, digital twin research has gradually moved beyond engineering applications and firm-level deployment studies towards sustainability-oriented and entrepreneurship-related contexts, including smart sustainable infrastructure, environmental management and digital-twin-enabled sustainability practices (Allam & Jones, 2021; Soori, Arezoo & Dastres, 2023; Ba et al., 2025; Huy & Phuc, 2026; Samiepour, Barricelli & Fogli, 2026).
Nevertheless, three research gaps remain. First, although recent studies have examined digital transformation and green innovation, the relationship is still debated because digitalisation may support either substantive green innovation or more strategic, compliance-oriented responses, depending on organisational and institutional conditions (Liu, Ma & Yang, 2026). Second, most digital twin studies continue to focus on technology deployment, engineering applications or individual enterprises, whereas less is known about whether the readiness conditions for digital twin-related systems matter at the country–industry level. Third, green entrepreneurship is often treated as a single outcome, even though start-up entry, venture-capital mobilisation and green patenting capture different margins of entrepreneurial activity. These gaps are particularly important for post-transition economies, where digital capabilities, sectoral structures and green innovation systems remain unevenly distributed. This study, therefore, examines whether digital twin readiness is systematically associated with different green entrepreneurial outcomes in the Baltic countries.
The Baltic countries provide a theoretically useful but still underexplored context for studying the twin transition nexus. These post-socialist economies share the common policy environment of the EU but differ in their trajectories of digitalisation, green restructuring and industrial specialisation (Eteris, 2020; Vettik-Leemet, Raudsaar & Kaseorg, 2020, pp. 49–80; Muench et al., 2022; Veugelers et al., 2023). Recent regional evidence shows that the development of green, digital and twin economic activities is shaped by relatedness and regional specialisation, not by uniform technological diffusion (Cicerone et al., 2026). This view is particularly important for the Baltic countries, because the environmental upgrading and industrial modernisation of these countries are constrained by factors such as uneven digital capabilities, shortage of skills and inherited sectoral structures (Štreimikienė, 2021; Bănică et al., 2024). Therefore, the region provides a suitable setting to examine whether industries with high digital twin readiness also show stronger green entrepreneurship outcomes. This study does not regard digital twin readiness as a direct adoption or sufficient causal driver but as an enabling condition. Its association with green entrepreneurship may vary depending on entry, financing and innovation outcomes.
This study uses a harmonised country–industry–year panel dataset for Estonia, Latvia and Lithuania from 2015 to 2024 for empirical analysis. The research constructs a digital twin readiness index (DTRI) based on five indicators in Eurostat's Enterprise Information and Communication Technology Survey: artificial intelligence (AI), the Internet of Things (IoT), cloud computing, big data analytics and information and communication technology (ICT) specialists. DTRI is not intended to measure the actual deployment of digital twins but reflects the extent to which an industry has the digital and human capital foundations required for digital twin-related systems. The output of green entrepreneurship is measured through three dimensions: the establishment of clean technology start-ups, the mobilisation of green venture capital and environment-related patent applications. The empirical strategy combines two-way fixed-effects models, staggered difference-in-differences estimation and an instrumental-variable design. The results show that the association of high digital twin readiness with venture capital and green patent applications is more consistent than the association with the establishment of start-ups. The strongest estimated associations appear in Lithuania's energy-related activities and Estonia's manufacturing sector, suggesting that digital twin-related readiness is more closely connected to the financing and innovation margins of green entrepreneurship than to entrepreneurial entry alone.
This study makes three contributions that correspond to the research gaps identified above. First, it extends digital twin research beyond firm-level engineering deployment by conceptualising digital twin readiness as a country–industry–year capability condition. Second, it contributes to the green entrepreneurship literature by distinguishing between entrepreneurial entry, venture-capital mobilisation and green patenting, thereby showing that digital twin-related readiness is not equally associated with all entrepreneurial outcomes. Third, it adds evidence from the Baltic States, a small open post-transition region where EU policy exposure, uneven digital capabilities and sectoral specialisation create a theoretically useful setting for studying the twin transition at the meso level. Taken together, these contributions clarify how digital twin-related readiness is connected to the depth, rather than only the scale, of green entrepreneurial activity.
The remainder of this study is organised as follows. Section 2 develops the conceptual framework and hypotheses. Section 3 describes the data sources, variable construction and empirical strategy. Section 4 reports the fixed-effects, difference-in-differences and instrumental-variable results. Section 5 discusses the theoretical and practical implications of the findings and concludes the paper.
2. Conceptual Framework and Hypotheses
Building on the research gaps identified in the Introduction, this section develops the conceptual framework in four steps. First, it defines digital twin readiness as an enabling capability condition rather than direct digital twin adoption. Second, it explains the channels through which such readiness may be associated with green entrepreneurial outcomes. Third, it clarifies why the relationship is expected to differ across start-up formation, venture-capital mobilisation and green patent applications. Finally, it derives the hypotheses tested in the empirical analysis.
2.1. Digital twin readiness as an enabling capability condition
The core argument of this study first distinguishes between digital twin readiness and digital twin application. Digital twins are usually understood as integrated systems that link physical assets, processes or infrastructure with digital representations through continuous data collection, data integration, simulation and analytical feedback (Glaessgen & Stargel, 2012, p. 1818; Tao et al., 2018; Zhou, Kriviņš & Kaze, 2025a, 2025b). Recent studies also show that digital twins are increasingly discussed in relation to sustainability-oriented infrastructure, environmental management and broader sustainability practices, rather than only as engineering tools (Huy & Phuc, 2026; Samiepour et al., 2026). However, such systems do not rely on a single technology. They require interconnected data environments, scalable computing and storage capacity, analytical capabilities, modelling competence and professional technical skills that can transform real-time information into operational and strategic decision-making (Allam & Jones, 2021; Bauer, Stevens & Hazeleger, 2021; Ba et al., 2025). From an economic perspective, the key issue is, therefore, not whether firms use one advanced technology in isolation but whether an industry has the complementary capability base that makes digital twin-related deployment feasible.
This difference is particularly important in the study of the meso-level of post-transition economies. Baltic countries lack consistent industry-level time series data on the actual digital twin deployment of enterprises. Therefore, this study does not try to directly measure actual adoption but focusses on whether each industry has the ability to make such deployment more feasible. This is the theoretical basis of the DTRI.
A potential concern is that an index based on general digital technologies may capture broad digitisation rather than digital twin readiness specifically. This study addresses this concern conceptually by treating AI, IoT, cloud computing, big data analytics and ICT specialists as the minimum complementary capability base associated with digital twin-related systems, not as evidence of actual digital twin adoption. These components correspond to the foundations that are repeatedly emphasised in the digital twin literature: connected data collection, data integration and storage, modelling and prediction, computational scalability and the professional skills required to implement and maintain such systems (Tao et al., 2018; Allam & Jones, 2021; Bauer et al., 2021; Fraga-Lamas, Lopes & Fernández-Caramés, 2021; Ba et al., 2025). In this sense, DTRI should be interpreted as a readiness proxy that captures whether a country–industry–year unit has the capability conditions associated with digital twin-related deployment.
This interpretation is also consistent with the broader literature on the twin transition. Existing research shows that digitisation does not automatically translate into more environmentally favourable outcomes; the relationship depends on complementary capabilities, institutional support, sectoral structure and regional development conditions (Bianchini et al., 2022; Zou & Ahmad, 2023; Bănică et al., 2024; Cicerone et al., 2026). In post-transition economies, where digital capabilities, skills and industrial structures remain unevenly distributed, digital twin readiness is best understood as an enabling condition rather than as a direct measure of adoption or a deterministic causal force. It cannot mechanically create entrepreneurial outcomes, but it may relax constraints that limit experimentation, coordination, verification and scale-up in green economic activities.
2.2. The connection channels between digital twin readiness and green entrepreneurial output
Green entrepreneurial output refers to the creation and development of environment-oriented entrepreneurial activities. Green entrepreneurship describes firms that operate under profitability, investor evaluation and competitive selection while commercialising products, services or technologies with measurable environmental benefits (Kraus et al., 2017; Odeyemi et al., 2024; Petersen & Rasmussen, 2024). Recent studies and policy-oriented evidence show that such activities depend on knowledge capabilities, digital financial literacy, dynamic capabilities, digital cognition and access to digital tools that support circular or sustainability-oriented practices (Acelera Pyme, 2023; Ahmed et al., 2026; Christofi et al., 2026; Huang et al., 2026). The question is whether digital twin readiness provides a capability environment that is associated with stronger entrepreneurial entry, financing and innovation outcomes.
This study identifies three channels through which digital twin readiness may reduce operational, innovation-related and credibility-related frictions. The operational efficiency channel concerns process monitoring, identification of inefficient links, simulation of alternatives and optimisation of resource use (Fraga-Lamas et al., 2021; Arsecularatne, Rodrigo & Chang, 2024). These functions matter because green commercialisation often depends on controlling energy costs, material losses and process uncertainty. When formal resources are limited, digital tools can also help entrepreneurs coordinate circular economy practices and environmental engagement (Christofi et al., 2026).
The innovation acceleration channel involves experimentation and knowledge creation. The readiness of digital twin-related systems can shorten the development cycle and reduce the uncertainty in the testing of complex products or production systems. This is especially important when green innovation requires a long development cycle and the integration of engineering, environmental and digital knowledge (Christensen, 2015; Chen, 2022). Evidence for small- and medium-sized enterprises also shows that green knowledge capabilities and digital financial literacy support ambidextrous green innovation by helping firms combine exploratory and exploitative activities (Huang et al., 2026).
The market formation and credibility channel involves signalling and external evaluation. Green enterprises face information problems because investors and partners must assess whether a technology is effective, scalable and can be integrated into a viable business model (Magretta, 2002; Broccardo et al., 2023; Ozturkoglu, Ozturkoglu & Danisman, 2025). Dynamic capabilities and digital cognition also affect how technology-based firms engage with sustainability and communicate their environmental commitments (Ahmed et al., 2026). By improving modelling, verification and data transparency, digital twin-related capabilities can make green projects more credible and easier to evaluate.
These channels are interconnected but distinct. Operational efficiency focusses on cost control and feasibility, innovation acceleration focusses on experimentation and knowledge creation, while market formation focusses on credibility and investor confidence. This distinction is crucial because the outcome variables reflect the different dimensions of entrepreneurship.
2.3. Why the association may differ across start-ups, venture capital and patents
The above mechanisms are not expected to apply equally to all indicators that measure the output of green entrepreneurship. Green patent applications should be most closely related to digital twin readiness, because experimentation, modelling and iterative development are the most prominent in the margin of knowledge creation. This expectation is consistent with relevant research results. These studies show that the impact of digital transformation on green innovation may vary depending on whether enterprises pursue substantive innovation or strategic responses (Liu et al., 2026). Patent applications, therefore, provide an observable, although incomplete, indicator of the innovation-oriented dimension of green entrepreneurship.
Venture capital is also expected to show a strong association. Investors are sensitive to signals of technical capability, scalability and credible growth potential. Digital twin readiness may improve the technical quality, visibility and assessability of green projects. Recent research on small and medium-sized enterprises (SMEs) indicates that green knowledge capabilities and digital financial literacy can support the conversion of green entrepreneurial intention into ambidextrous green innovation (Huang et al., 2026). This supports the expectation that readiness conditions are more closely related to financing and innovation outcomes than to firm counts.
The association with start-up formation may be weaker and less stable. New firm entry depends on market size, regulatory barriers, entrepreneurial culture, early-stage finance, sector-specific demand and the design of entrepreneurial support ecosystems (Matricano & Liguori, 2026). Even when digital twin readiness improves the capability environment, these constraints may still limit entry. Readiness is, therefore, expected to appear more clearly in the quality, credibility and innovation intensity of entrepreneurial activity than in the number of newly established firms.
2.4. Hypotheses
The conceptual framework leads to three testable hypotheses.
H1. Higher digital twin readiness is positively associated with green entrepreneurial output.
This benchmark hypothesis reflects the expectation that digital twin readiness can relax operational, informational and coordination constraints in green economic activities, thereby improving the conditions under which environment-oriented entrepreneurship can develop.
H2. The positive association between digital twin readiness and green entrepreneurial output is stronger for green patent applications and venture-capital mobilisation than for start-up formation.
This hypothesis reflects the expectation that readiness conditions are more closely connected to innovation intensity and scale-up credibility than to the simple number of new entrants.
H3. The positive association between digital twin readiness and green entrepreneurial output is stronger in industries where green production and commercialisation rely more heavily on complementary digital capabilities.
This hypothesis follows from the enabling-condition logic developed above. Where optimisation, monitoring, verification and data integration are more important for production and commercialisation, digital twin readiness should be more closely related to green entrepreneurial outcomes.
3. Methodology
The empirical strategy follows a layered research design. First, the study constructs a harmonised country–industry–year panel in order to examine whether industries with stronger digital twin-related readiness also display stronger green entrepreneurial outcomes. Second, a two-way fixed-effects model is used as the baseline specification to estimate within-panel associations after controlling for time-invariant industry and country heterogeneity and common year shocks. Third, a staggered difference-in-differences design is used to examine whether green entrepreneurial outcomes change around digitalisation policy exposure in treated industries. Fourth, an instrumental-variable specification based on a Bartik-style semiconductor price shock interacted with historical ICT intensity is used as an additional identification exercise to reduce endogeneity concerns. The subsections below first describe the data sources and sample construction, then define the variables and the DTRI construction procedure, and finally present the fixed-effects, difference-in-differences and instrumental-variable specifications.
3.1. Data sources, sample construction and panel structure
This study uses a harmonised country–industry–year panel dataset built between 2015 and 2024 for Estonia, Latvia and Lithuania. The observation unit is an industry within each country and year, classified according to the Statistical Classification of Economic Activities in the European Community, Revision 2 (NACE Rev. 2). The panel data integrates information such as green start-up formation, venture capital financing, patent application activities, enterprise digitalisation capabilities, industry structure and macroeconomic situations at the national level.
The construction of the dataset is divided into three steps. First, the observations at the enterprise level and the patent level are assigned to a unified NACE Rev.2 classification to make information from different sources comparable. Second, these observations are aggregated into annual industry-country units. Third, currency values are converted to constant 2015 euros, and the components of DTRI are standardised before building the DTRI. This procedure generates a harmonised meso-level panel dataset suitable for examining whether industries with stronger digital twin-related readiness also display stronger green entrepreneurial outcomes.
Data sources differ by variable type. Information about green start-ups and financing rounds comes from Dealroom.co, PitchBook and regional cleantech reports. Patent data come from the Organisation for Economic Co-operation and Development (OECD) Patent Statistics Database and the Worldwide Patent Statistical Database (PATSTAT) of the European Patent Office. The digital capability indicators come from the Enterprise Use of ICTs and E-commerce survey of Eurostat. The control variables at the industry-level come from the national accounts of Eurostat, while the control variables at the national level come from Eurostat, the OECD, the World Bank and the International Monetary Fund. This unified country–industry–year structure makes it possible to integrate these data sources into a single empirical framework. The raw data sources are unevenly observed across indicators and years, especially for some ICT indicators in the earlier part of the sample. However, after aggregation and limited interpolation or backward projection of selected DTRI components, the final analytical panel contains 270 country–industry–year observations. The robustness analysis, therefore, re-estimates the core models using a later-period subsample with less reliance on interpolation and backward projection.
3.2. Variables, measurement and DTRI construction
Green entrepreneurial output is measured through three complementary indicators at the country–industry–year level. Start-up formation refers to the number of newly established clean technology and environmentally oriented firms, identified from business descriptions and supplementary company information before being assigned to a main NACE Rev.2 industry. Venture capital mobilisation is measured by the publicly disclosed venture capital and private equity funding raised by green start-ups, with all monetary values converted into constant 2015 euros using the EU Harmonised Index of Consumer Prices. Green patenting is measured by annual patent applications under CPC Y02 and related climate technology subclasses. Patents are assigned by inventor residence and mapped to NACE Rev.2 industries using concordance tables from Eurostat and the World Intellectual Property Organisation.
The main explanatory variable is the DTRI, which is interpreted as a readiness proxy rather than as direct evidence of firm-level digital twin adoption. It is constructed from five Eurostat enterprise ICT survey indicators: AI use, Internet of Things use, cloud computing, big data analytics and ICT specialist employment. These indicators capture the complementary technological and human capital foundations associated with digital twin-related systems, including connected data collection, scalable computing, data integration, modelling capacity and specialist skills.
The dataset includes both industry-level and country-level contextual variables. At the industry level, gross value added, gross fixed capital formation and employment are recorded to describe industrial scale, investment intensity and labour input. At the country level, gross domestic product (GDP) per capita in purchasing power parity (PPP) terms, research and development (R&D) expenditure as a percentage of GDP and tertiary educational attainment among people aged 25 to 34 are recorded to capture broader development, innovation and human-capital conditions. In the reported baseline regressions, the main controls are gross value added, gross fixed capital formation, GDP per capita and R&D intensity. Employment and tertiary educational attainment are retained in the dataset and reported in the descriptive statistics, but they are not reported as baseline regression controls. Because the dependent variables contain many zero observations and are strongly right-skewed, especially venture capital and patent applications, they are transformed as ln(1 + Y). Industry-scale controls are included in logarithmic form, while ratio-type national controls are retained in levels. Table 1 summarises the variable definitions, measurement levels and data sources.
Table 1.
Variable definitions, measurement and data sources
| Variable | Measurement | Unit | Level | Source |
|---|---|---|---|---|
| Startupsict | Newly established cleantech and environmentally oriented start-ups | Count | Industry–country–year | Dealroom.co; PitchBook; regional cleantech reports |
| VCict | Venture-capital and private-equity funding raised by green start-ups | Constant 2015 EUR | Industry–country–year | Dealroom.co; PitchBook; regional cleantech reports; Eurostat HICP |
| Patentsict | Patent applications in CPC Y02 and related climate-technology subclasses | Count | Industry–country–year | OECD Patent Statistics Database; EPO PATSTAT |
| DTRIict | DTRI (first principal component of AI, IoT, cloud, big data and ICT specialists) | PCA index | Industry–country–year | Eurostat ICT survey |
| GVAict | Gross value added | EUR | Industry–country–year | Eurostat National Accounts |
| GFCFict | Gross fixed capital formation | EUR | Industry–country–year | Eurostat National Accounts |
| EMPict | Employment | Tens of thousands of persons | Industry–country–year | Eurostat National Accounts |
| GDP pcict | GDP per capita (PPP) | Constant international dollars | Country–year | World Bank; IMF |
| RnDict | R&D expenditure | % of GDP | Country–year | Eurostat; OECD |
| EDUict | Population aged 25–34 with tertiary education | % | Country–year | Eurostat |
[i] Source: Authors' elaboration based on Dealroom.co, PitchBook, regional cleantech reports, OECD Patent Statistics Database, EPO PATSTAT, Eurostat, WIPO, World Bank, IMF and OECD.
[iii] AI, artificial intelligence; DTRI, digital twin readiness index; ICT, information and communication technology; EUR, euro; GDP, gross domestic product; HICP, Harmonised Index of Consumer Prices; IMF, International Monetary Fund; IoT, Internet of Things; OECD, Organisation for Economic Co-operation and Development; PATSTAT, Worldwide Patent Statistical Database of the European Patent Office; PCA, principal component analysis; PPP, purchasing power parity; R&D, research and development.
DTRI is constructed using principal component analysis (PCA). Before estimation, the five input indicators are standardised over the pooled country–industry–year sample. The first principal component (PC1) is retained because it captures the largest common variation among the five enabling capabilities, and its sign is normalised so that higher values indicate stronger digital twin-related readiness. Table 2 reports the PCA coefficients, factor loadings, explained variance, scaling direction and descriptive statistics.
Table 2.
PCA construction of the DTRI
| Indicator | Mean | SD | PCA coefficient | Factor loading | Direction |
|---|---|---|---|---|---|
| AI use | 8.16 | 7.891 | 0.518 | 0.912 | Positive |
| IoT use | 26.075 | 10.132 | 0.056 | 0.098 | Positive |
| Cloud computing | 28.575 | 16.036 | 0.403 | 0.71 | Positive |
| Big data analytics | 11.651 | 5.21 | 0.519 | 0.914 | Positive |
| ICT specialists | 22.374 | 20.008 | 0.544 | 0.959 | Positive |
| Explained variance of PC1 | 62.03% |
[i] Note: All indicators are standardised over the pooled country–industry–year sample before PCA. PCA coefficients refer to the eigenvector weights used to construct the first principal component. Factor loadings report the correlation between each standardised indicator and the DTRI score. The sign of PC1 is normalised so that higher values indicate stronger digital twin-related readiness.
Since the five indicators are standardised based on the pooled country–industry–year sample and the same PCA weights are applied to all observations, the DTRI scores across different countries, industries and years are comparable in the analytical sample from 2015 to 2024. The first principal component explains 62.03% of the total variance. All coefficients are positive, confirming a consistent scaling direction. ICT specialists, big data analytics and AI use receive the strongest weights, followed by cloud computing. The use of the Internet of Things has a smaller loading in this sample, but it is retained because it remains conceptually important for connected data collection and monitoring. Some ICT indicators are not continuously observed in the early sample period, especially before 2020. Missing DTRI components are, therefore, addressed through interpolation and limited backward projection based on observed country–industry trends. This improves temporal comparability but does not remove the data constraint, so the robustness analysis re-estimates the core models using a later-period subsample with less reliance on interpolation and backward projection.
3.3. Baseline fixed-effects model
First, a two-way fixed-effects panel model is used to estimate the three outcome variables:
where Yict represents one of the three green entrepreneurial outcomes in industry i, country c and year t; DTRIict is the DTRI; Zict is the vector of control variables; μi represents the industry fixed effects; νc indicates the country fixed effects and τt represents the year fixed effects.The model controls for differences between industries and countries that do not change over time, and for common shocks affecting all observations in a specific year. Therefore, the coefficient of interest, β, is estimated from within-panel changes in digital twin readiness over time, net of observed control variables and fixed effects. Standard errors are clustered at the country–industry level to allow for serial correlation and heteroskedasticity within panels. The fixed-effects model provides a baseline estimate, but it does not by itself eliminate concerns about reverse causality or time-varying omitted variables (Hill et al., 2021; De Chaisemartin & D'haultfoeuille, 2023; Yan, Zhang & Zhang, 2024; Christopoulos, Smyrnakis & Tzavalis, 2025).
3.4. Difference-in-differences design
In order to strengthen identification, this study next builds a quasi-experimental setting by taking advantage of the differences in the implementation timing of the digitalisation strategies across the three Baltic countries. Latvia adopted the Digital Transformation Guidelines 2021–2027 at the end of 2020, while Estonia's Digital Agenda 2030 and Lithuania's digital investments under the Recovery and Resilience framework were released in 2021. These differences provide the time variation required for a staggered difference-in-differences design (Clougherty & Moliterno, 2010).
Treatment intensity is defined at the industry level. The treated group consists of industries with high digital twin potential, namely manufacturing (NACE Rev. 2 Section C), energy and utilities (NACE Rev. 2 Sections D–E), and transportation and storage (NACE Rev. 2 Section H). The comparison group consists of industries where such capabilities are less central to production, namely accommodation and food services (NACE Rev. 2 Section I) and arts, entertainment and other services (NACE Rev. 2 Sections R–U).
The staggered difference-in-differences design is implemented in an event-study form:
where is an indicator for treated country–industry observations k years relative to digitalisation policy exposure, with k=−1 omitted as the reference period. The coefficients δk trace the evolution of green entrepreneurial outcomes before and after policy exposure. This event-study structure is used to examine pre-treatment patterns and post-exposure changes, while the staggered-adoption estimators reduce bias that can arise when treatment timing differs across units.Due to the staggered treatment timing across countries, standard two-way fixed-effects difference-in-differences estimators may be biased when earlier-treated units act as controls for later-treated units. Therefore, this analysis adopts the staggered-adoption estimators proposed by Callaway and Sant'Anna (2021) and Sun and Abraham (2021). In addition to the average treatment effect, this study also reports event-study estimates to assess pre-treatment dynamics and a placebo exercise based on a fictitious pre-policy intervention date.
3.5. Instrumental-variable strategy
The final empirical exercise uses an instrumental variable specification to reduce endogeneity concerns in the estimated relationship between DTRI and green entrepreneurial outcomes (Bascle, 2008; Marra & Radice, 2011). Endogeneity may arise if industries with stronger green entrepreneurial ecosystems invest more in digital capabilities, or if unobserved industry-level factors influence both digital twin-related readiness and green entrepreneurship. The instrumental variable (IV) strategy is, therefore, used as an additional identification exercise, not as a standalone proof of causality.
The instrument follows a Bartik-style shift-share logic by combining a global technology price shock with predetermined industry exposure (Autor, Dorn & Hanson, 2013; Goldsmith-Pinkham, Sorkin & Swift, 2020; Lowenstein, 2024). The shift component is the annual rate of change in the US Producer Price Index for Semiconductor and Other Electronic Components Manufacturing. The share component is the historical dependence of each industry on ICT capital, measured by the average proportion of ICT capital in total capital stock from 2010 to 2014 using EU KLEMS data. The instrument is defined as the interaction between the global semiconductor price shock and the predetermined historical ICT capital share of each industry.
The logic is that industries with higher historical ICT intensity should be more exposed to global changes in the cost of semiconductor-related digital technologies. This exposure is expected to predict digital twin-related readiness because AI, IoT, cloud computing, big data analytics and ICT specialist employment depend on the affordability and diffusion of digital technological inputs. Since the ICT capital share is predetermined and the semiconductor price shock is global, the interaction is less likely to be driven by contemporaneous green entrepreneurship conditions in the Baltic countries.
The first-stage equation is:
where IVict denotes the Bartik-style instrument, Zict is the vector of control variables, μi denotes industry fixed effects, νc denotes country fixed effects and τt denotes year fixed effects. The second stage equation is: where is the predicted value of DTRI obtained from the first stage equation. Instrument relevance requires a sufficiently strong correlation between the instrument and DTRI after controlling for fixed effects and observed covariates. This condition is assessed through the first-stage estimates and the Kleibergen–Paap statistic reported in Results section.The exclusion restriction is difficult to verify directly, so it needs to be interpreted carefully. From a cautious perspective, semiconductor price shocks may also affect green entrepreneurship through broader ICT costs, technology-intensive investment environments or overall digitalisation trends. Therefore, the identifying assumption is that, conditional on fixed effects and control variables, the instrument mainly affects green entrepreneurial outcomes through the readiness related to digital twins. In view of this, we carefully interpret the IV estimates as evidence consistent with the relationship between digital twin readiness and green entrepreneurial outcomes proposed under the above assumption.
4. Results
This section is divided into five steps to present the empirical findings. First of all, it describes the distribution of green entrepreneurial outcomes and digital twin readiness in the Baltic country–industry–year panel data. Then, the baseline fixed-effects estimates, the staggered difference-in-differences results around the exposure to digital policies and the instrumental-variable estimates based on the interaction between the Bartik-style semiconductor price shock and historical ICT intensity were reported. Finally, the relationship between the estimated digital twin readiness and outcomes under the three empirical strategies was compared.
4.1. Descriptive patterns
Table 3 summarises the main characteristics of the Baltic country–industry–year panel data from 2015 to 2024. Descriptive statistics show that there are significant differences in the three dimensions of green entrepreneurial output. On average, each country–industry–year unit recorded 0.61 new green start-ups, 45.89 million euros of green venture capital and 5.38 green patent applications. However, relative to the average value, the standard deviation is large, especially for venture capital and patents. The amount of venture capital ranges from zero to 2.6795 billion euros, and the number of patent applications ranges from 0 to 42. There are also significant differences in the digital twin readiness (DTRI) between different observations. The average is close to zero, the standard deviation is 1.45 and the value ranges from −2.38 to 6.08. Control variables also show that there are significant differences in industrial scale, investment intensity, labour input and national development conditions. In general, the sample is characterised by uneven green entrepreneurship activities and digital twin readiness across different industries, countries and years.
Table 3.
Descriptive statistics for key variables, 2015–2024
| Variables | Observations (N) | Mean | SD | Minimum | Maximum |
|---|---|---|---|---|---|
| Yict | |||||
| Startupsict (number) | 270 | 0.61 | 1.23 | 0 | 5 |
| VCict (millions of euros) | 270 | 45.89 | 203.15 | 0 | 2679.5 |
| Patentsict (number) | 270 | 5.38 | 9.01 | 0 | 42 |
| Xict | |||||
| DTRIict (index) | 270 | −0.16 | 1.45 | −2.38 | 6.08 |
| Industry-level control variable | |||||
| GVAict (billions of euros) | 270 | 12.37 | 15.81 | 0.03 | 70.92 |
| GFCFict (billions of euros) | 270 | 2.95 | 4.12 | 0.03 | 16.88 |
| EMPict (tens of thousands of people) | 270 | 2.51 | 2.68 | 0.03 | 10.94 |
| Country-level control variable | |||||
| GDP_pcict (thousands of constant international dollars) | 270 | 18.35 | 4.87 | 12.01 | 28.74 |
| RnDict (% of GDP) | 270 | 0.46 | 0.29 | 0.11 | 1.06 |
| EDUict (% of pop. 25–34) | 270 | 47.11 | 6.78 | 38.5 | 58.2 |
[i] Source: own calculations based on the dataset described in Table 1; Eurostat ICT usage and e-commerce survey indicators (for DTRI components) and Eurostat National Accounts (industry controls), with country-level indicators from World Bank/IMF and Eurostat/OECD.
[iii] DTRI, digital twin readiness index; ICT, information and communication technology; SD, standard deviation; EMP, employment; GFCF, gross fixed capital formation; GDP, gross domestic product; GVA, gross value added; IMF, International Monetary Fund; OECD, Organisation for Economic Co-operation and Development; R&D, research and development; VC, venture capital.
These distribution patterns are crucial to the subsequent modelling strategy. They show that green entrepreneurship in the Baltic region is shaped by differences in scale and intensity, not by small fluctuations around the common average. The existence of a large number of zero-value observations and the significant right-skewness of venture capital and patent applications also support the use of the ln(1 + Y) transformation in the regression analysis.
Figure 1 shows that from 2015 to 2024, the three green entrepreneurship indicators showed different development trajectories. Venture capital is the most volatile, reflecting that financing is concentrated in a few large transactions. The number of start-ups and patent applications grew relatively slowly, but their growth was also uneven.
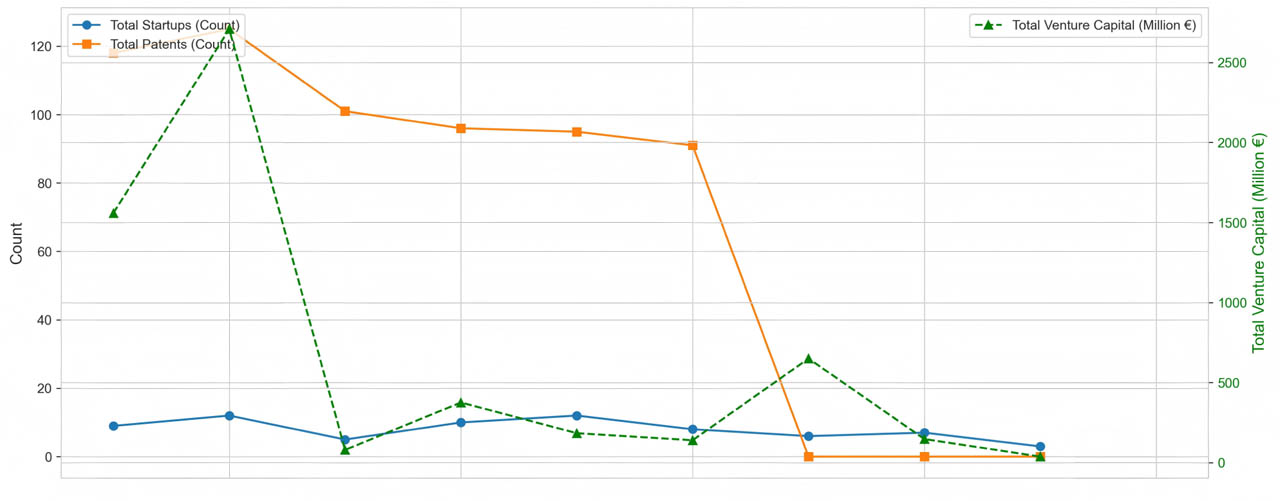
Figure 1.
Trends in Baltic green entrepreneurial outcomes, 2015–2024. Source: Authors' calculations based on the country–industry–year panel described in Section 3 and Table 1
This pattern supports treating green entrepreneurship as a multi-dimensional outcome. The number of start-ups reflects the entry margin, venture capital reflects market validation and scale-up potential, and patents measure knowledge creation.
Figure 2 shows that average DTRI generally increased over the same period, suggesting a gradual diffusion of complementary digital capabilities across Baltic industries.
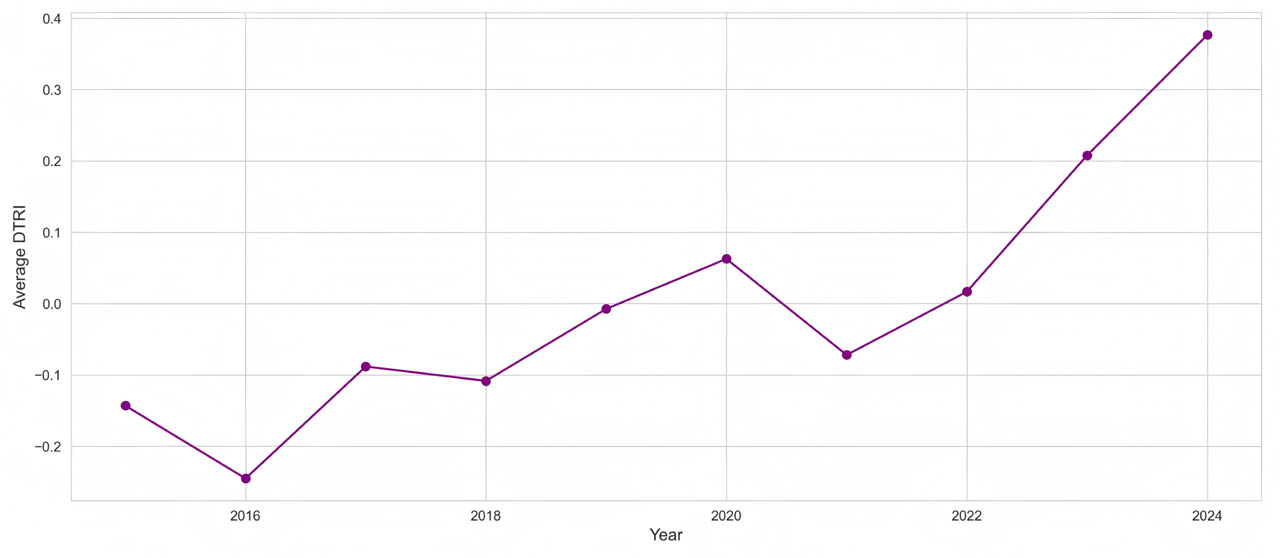
Figure 2.
Average DTRI in the Baltic States, 2015–2024. Source: Own calculations based on Eurostat ‘Enterprise use of ICTs and e-commerce’ survey indicators. DTRI, digital twin readiness index; ICT, information and communication technology
Taken together, Figures 1 and 2 show that digital capability deepening and green entrepreneurial activity evolved unevenly. These descriptive patterns cannot by themselves identify the DTRI–outcome relationship, but they provide the empirical background for the regression analysis that follows.
4.2. Baseline fixed-effects results
Table 4 reports the baseline two-way fixed-effects estimates for the three dimensions of green entrepreneurial output. The coefficient of the DTRI is positive in all three models. The estimated coefficient is 0.079 for green start-up formation, 0.142 for green venture-capital mobilisation and 0.103 for green patent applications. The association is statistically significant at the 10% level for start-ups and at the 5% level for venture capital and patents. These results indicate that stronger digital twin readiness is positively associated with green entrepreneurial outcomes, although the estimated relationship is stronger and more precisely measured for venture-capital mobilisation and patent applications than for start-up formation.
Table 4.
Baseline fixed-effects regression results for green entrepreneurial outcomes
| Variables | (1) ln(1 + Startupsict) | (2) ln(1 + VCict) | (3) ln(1 + Patentsict) |
|---|---|---|---|
| DTRI | 0.079* | 0.142** | 0.103** |
| (0.042) | (0.061) | (0.049) | |
| ln(GVA) | 0.195** | 0.321*** | 0.174* |
| (0.088) | (0.105) | (0.096) | |
| ln(GFCF) | 0.091 | 0.182* | 0.088 |
| (0.071) | (0.095) | (0.080) | |
| GDP_pcct | 0.488** | 0.815*** | 0.601** |
| (0.225) | (0.287) | (0.271) | |
| R&D | 1.192** | 2.433*** | 1.895*** |
| (0.510) | (0.721) | (0.654) | |
| Fixed effects | |||
| Industry | Yes | Yes | Yes |
| Country | Yes | Yes | Yes |
| Year | Yes | Yes | Yes |
| Statistic | |||
| Observations (N) | 270 | 270 | 270 |
| Within-group R-squared | 0.27 | 0.34 | 0.30 |
Source: Own calculations based on the dataset described in Table 1 (2015–2024).
In semi-elasticity terms, a one-unit increase in DTRI is associated with approximately 7.9% higher start-up formation, 14.2% higher green venture-capital mobilisation and 10.3% higher green patent applications, conditional on the control variables and fixed effects. These estimates suggest that the associations are not only statistically relevant but also economically meaningful. The pattern across the three outcome variables is consistent with the conceptual argument developed in Section 2. Digital twin readiness appears to be more closely related to the scale, credibility and innovation intensity of green entrepreneurial activity than to the simple number of new entrants.
The control variable estimates broadly support this interpretation. Gross value added and R&D intensity are positively associated with the dependent variables, suggesting that larger and more innovation-oriented environments tend to coincide with stronger green entrepreneurial outcomes. However, these fixed-effects estimates should still be interpreted as conditional associations rather than as standalone causal evidence. For this reason, the following sections examine whether the same pattern is supported by the staggered difference-in-differences design and the instrumental-variable specification.
4.3. Difference-in-differences results
Table 5 reports the staggered difference-indifferences estimates based on differences in the implementation timing of digital strategies across the three Baltic countries. The estimated ATT coefficients are positive for all three outcome variables. Relative to the comparison group, treated industries show post-exposure differences of approximately 0.168 for start-up formation, 0.275 for venture-capital mobilisation and 0.221 for green patent applications. The estimates for venture capital and patents are statistically significant, while the estimate for start-up formation remains positive but weaker. These results reinforce the baseline ordering, with stronger post-exposure changes for venture capital and patents than for start-up formation.
Table 5.
Difference-in-differences estimates around digitalisation policy exposure
| Dependent Variable | ATT |
|---|---|
| ln(1 + Startupsict) | 0.168* |
| (0.091) | |
| ln(1 + VCict) | 0.275** |
| (0.113) | |
| ln(1 + Patentsict) | 0.221** |
| (0.098) |
Source: Own calculations based on the dataset described in Table 1.
The estimated magnitudes are also meaningful in the Baltic context, where green entrepreneurial activity is concentrated in relatively small and open economies. At the sample average, these coefficients correspond to about 0.1 new start-ups, 12 million to 13 million euros of green venture capital and about 1.2 green patent applications in a typical country–industry–year unit. This shows that the implementation of digital policies is associated with significant differences in the scale of green entrepreneurship and the intensity of innovation, especially in industries that are better positioned to benefit from advanced digital capabilities.
Figure 3 shows the results of the event study for the same design. Before the implementation of the policy, the estimated treatment effects were close to zero and the confidence intervals contained zero, which is consistent with the parallel trends assumption. After the implementation of the policy, the coefficients became positive and increased over time, especially for venture capital and patent applications. The placebo exercise based on a fictitious 2018 intervention date does not produce significant estimates, reducing the likelihood that the main results are driven by preexisting industry trends or unrelated common shocks.
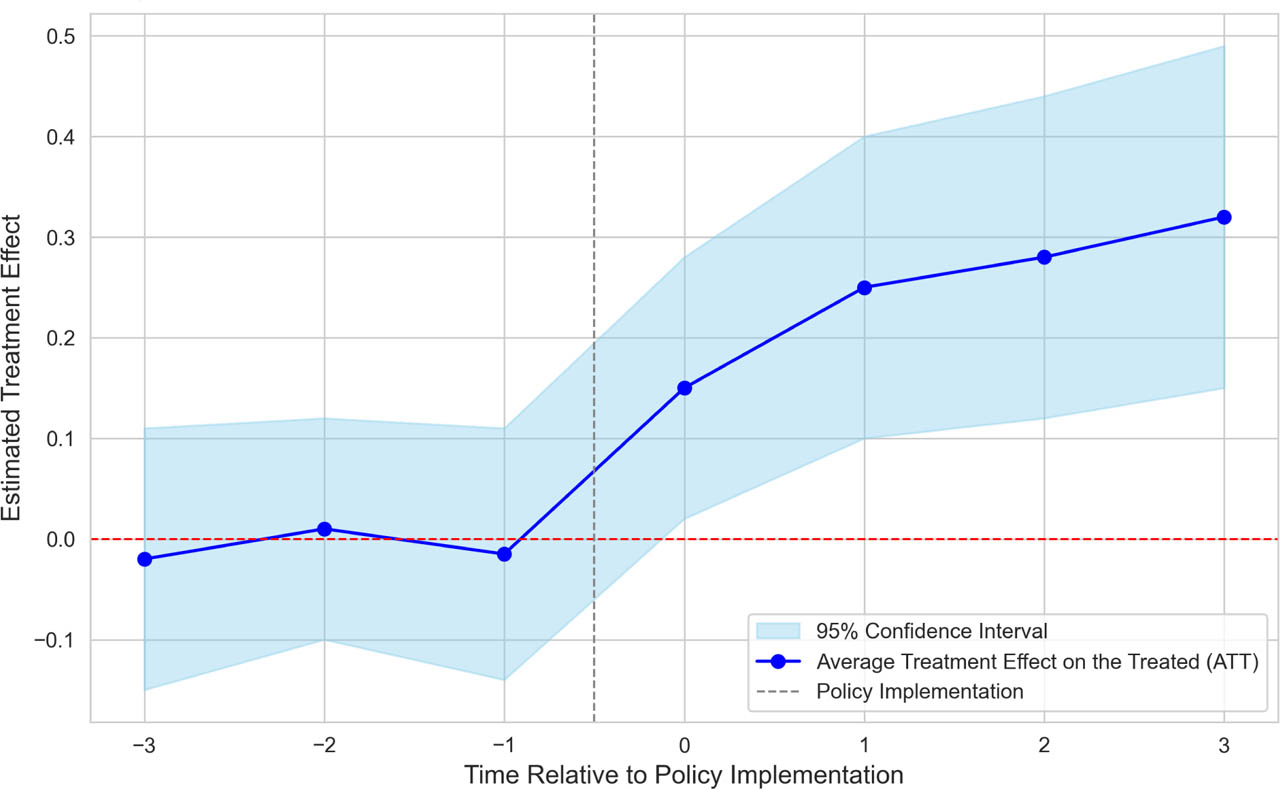
Figure 3.
Event-study estimates around digitalisation policy exposure and green entrepreneurial outcomes Source: Own calculations based on the dataset described in Table 1
Overall, the DiD results suggest that the positive relationship observed in the fixed-effects model is not merely a reflection of static industry differences. However, the estimates should still be interpreted as changes in industry-level outcomes around digitalisation policy exposure, rather than as direct evidence of enterprise-level digital twin adoption.
4.4. Instrumental-variable results
Table 6 reports the two-stage least squares estimates based on the Bartik instrumental variable (Bun & Windmeijer, 2011; Bhuller & Sigstad, 2024; Young, 2024). The first-stage results indicate a strong positive relationship between the instrument and DTRI. The coefficient of the instrumental variable is 0.812 and is highly statistically significant across the model settings. The Kleibergen–Paap F-statistic is 19.24, which is above the conventional weak-instrument threshold of 10. These results suggest that the instrument has sufficient predictive power for digital twin readiness.
Table 6.
Instrumental-variable regression results
| (1) ln(1 + Startupsict) | (2) ln(1 + VCict) | (3) ln(1 + Patentsict) | |
|---|---|---|---|
| Panel A: First-stage regression (dependent variable: DTRI) | |||
| Instrumental variable (IV) | 0.812*** | 0.812*** | 0.812*** |
| (0.185) | (0.185) | (0.185) | |
| Kleibergen–Paap F-statistic | 19.24 | 19.24 | 19.24 |
| Panel B: Second-stage regression (dependent variable: green entrepreneurial outcomes) | |||
| DTRI (instrumental variables approach) | 0.181* | 0.315*** | 0.266*** |
| (0.098) | (0.109) | (0.092) | |
| Statistic | |||
| Observations (N) | 270 | 270 | 270 |
Source: Own calculations based on the dataset described in Table 1.
The second-stage estimates remain positive for all three green entrepreneurial outcomes. The coefficient of the instrumented DTRI is 0.181 for green start-up formation, 0.315 for green venture-capital mobilisation and 0.266 for green patent applications. The estimates for venture capital and patents are statistically significant at the 1% level, while the estimate for start-ups is positive and significant at the 10% level. This pattern is consistent with the baseline and difference-in-differences results, as the estimated DTRI relationship is stronger for the financing and innovation margins than for entrepreneurial entry.
Figure 4 summarises the first-stage relationship visually. The positive slope supports the relevance condition by showing that industries with greater historical ICT exposure are more responsive to global semiconductor price shocks. This visual evidence is consistent with the first-stage estimates, although the validity of the instrument still depends on the exclusion restriction discussed in Section 3.5.
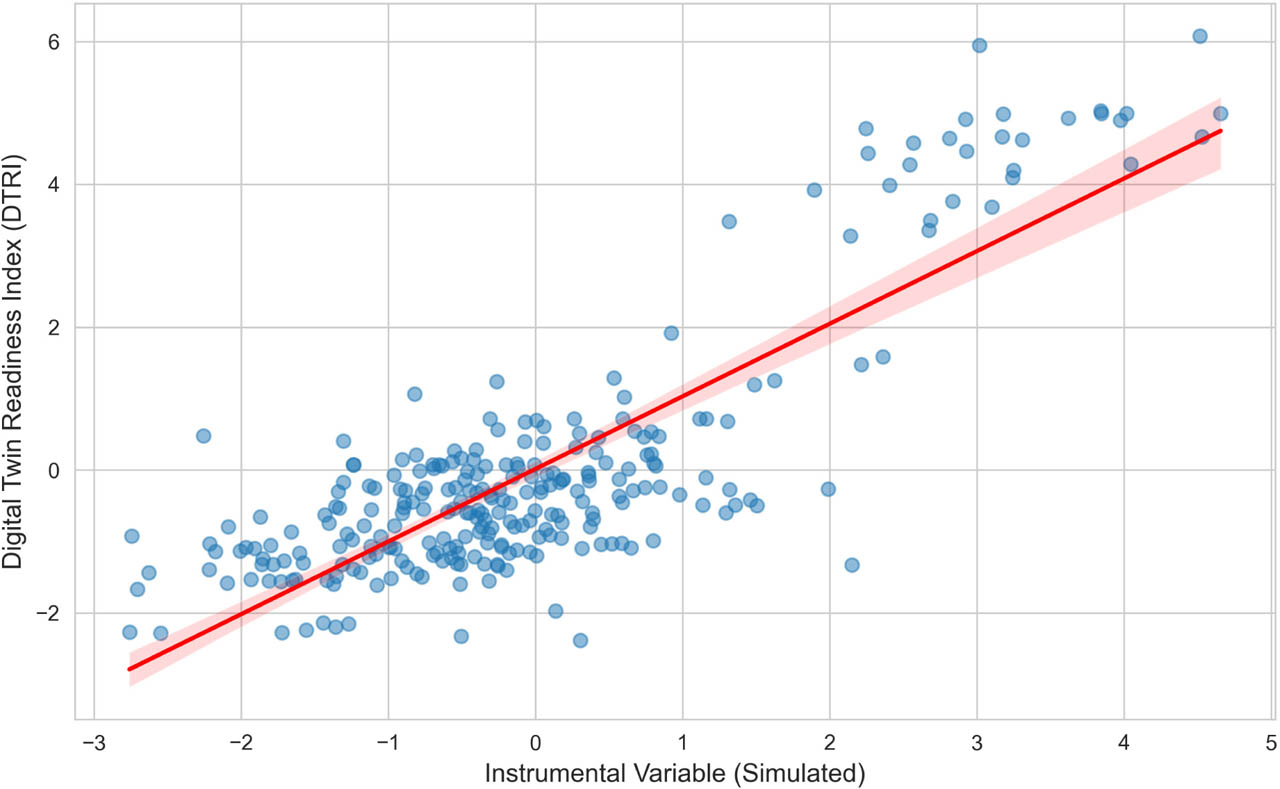
Figure 4.
First-stage relationship in the instrumental-variable specification.
Source: Authors' calculations based on the country–industry–year panel described in Section 3 and Table 1
The IV coefficients are larger than the baseline fixed-effects estimates, which may suggest that measurement error or attenuation bias reduces the size of the baseline associations. However, these results should still be interpreted cautiously. They do not provide direct evidence of enterprise-level digital twin adoption, nor do they eliminate all concerns about alternative channels. Under the identifying assumptions discussed in Section 3.5, the IV estimates provide additional support for the view that digital twin-related readiness is more closely associated with the scale and innovation intensity of green entrepreneurship than with the number of new entrants.
4.5. Comparison of estimated results across models
Taken together, the three empirical strategies point to a consistent ordering of the estimated DTRI relationships across the outcome variables. In the fixed-effects models, DTRI is positively associated with all three dimensions of green entrepreneurial output, with larger coefficients for venture-capital mobilisation and patent applications than for start-up formation. The difference-in-differences estimates show the same pattern after digitalisation policy exposure. The instrumental-variable estimates also preserve this ordering, with larger coefficients for venture-capital mobilisation and green patent applications, β ≈ 0.315 and β ≈ 0.266, than for start-up formation, β ≈ 0.181.
This cross-model consistency is important because it suggests that the main empirical pattern is not specific to one modelling strategy. Although the size of the coefficients across different model specifications varies, the essential meaning remains unchanged. The correlation between digital twin readiness and the financing and innovation margins of green entrepreneurship is stronger than the correlation with the entry margin. The larger instrumental-variable estimates may also indicate that measurement error or attenuation bias reduces the intensity of the baseline fixed-effects associations, but this explanation still depends on the identifying assumptions discussed in Section 3.5.
Figure 5 summarises the comparison of the digital twin readiness coefficients across the three empirical models.
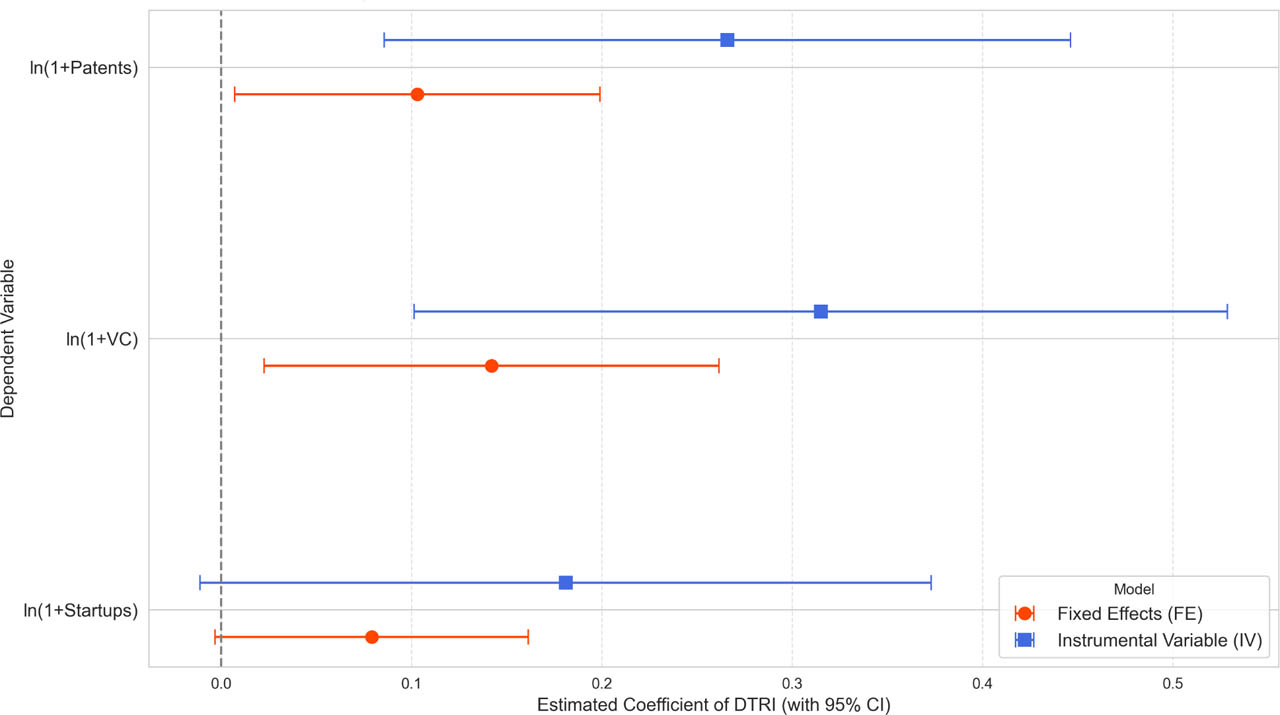
Figure 5.
Comparison of DTRI coefficients across empirical models
Source: Authors' calculations based on the regression results reported in Tables 4–6. DTRI, digital twin readiness index
Figure 5 confirms the core results of the empirical analysis. Stronger digital twin readiness is closely related to deeper green entrepreneurial activities (especially venture capital mobilisation and patent applications), not just the number of newly established enterprises. This pattern lays the foundation for the subsequent discussion, that is, digital twin readiness is interpreted as a meso-level readiness condition, which is more relevant to scale-up credibility and knowledge creation than to entrepreneurial entry.
5. Discussion and Conclusion
This section interprets the empirical research results in combination with the research questions and research gaps raised in the introduction. First of all, this section summarises the main research findings and explains their contributions to the relevant literature on digital twins, green entrepreneurship and the twin transition. Subsequently, this section discusses the theoretical and policy significance of this research and finally outlines its limitations and puts forward future research directions.
5.1. Main findings and contribution
The core issue of this study is whether the readiness related to digital twins constitutes an enabling condition associated with green entrepreneurial outcomes in the Baltic countries. Evidence shows that there is a positive correlation between the two, but it is not uniform. In the fixed-effects, difference-indifferences and instrumental variable analyses, the correlation between digital twin-related readiness and venture capital mobilisation and green patent applications is more consistent than the correlation with the establishment of start-ups. This pattern indicates that digital twin-related readiness is more closely connected to the financing, credibility and innovation intensity of green entrepreneurship than to entrepreneurial entry alone.
This finding should not be interpreted as direct evidence of firm-level digital twin adoption. Rather, it suggests that industries with stronger digital and human capital foundations associated with digital twin systems tend to display stronger green financing and innovation outcomes under the empirical specifications used in this study. The sectoral results further show that the association is strongest where green restructuring needs and complementary industrial capabilities overlap, especially in Lithuania's energy-related activities and Estonia's manufacturing sector. DTRI is, therefore, best understood as a meso-level readiness condition linked to the depth and quality of green entrepreneurial activity.
These findings address the research gaps identified in the Introduction in three ways. First, they extend digital twin research beyond application-centred and project-based studies. Existing research shows that digital twins can improve monitoring, optimisation and system performance in urban, industrial and energy contexts (Allam & Jones, 2021; Soori et al., 2023; Ba et al., 2025), and recent studies have connected digital twins with sustainability-oriented infrastructure and broader sustainability practices (Huy & Phuc, 2026; Samiepour et al., 2026). This study complements that literature by shifting attention from digital twins as operating tools to digital twin-related readiness as a country's industry year capability condition.
Second, the findings refine the green entrepreneurship literature by showing that green entrepreneurial output should not be treated as a single outcome. The stronger association with venture capital and patents is consistent with research emphasising that green entrepreneurship depends not only on environmental intention but also on market evaluation, technological credibility, knowledge capabilities, digital cognition and financing conditions (Kraus et al., 2017; Odeyemi et al., 2024; Petersen & Rasmussen, 2024; Ahmed et al., 2026; Christofi et al., 2026; Huang et al., 2026).
Third, the study adds evidence from small open post-transition economies. Previous research suggests that the digital sustainability relationship depends on complementary capabilities, institutional support and regional development conditions (Bianchini et al., 2022; Bănică et al., 2024), while recent regional evidence highlights the role of relatedness and specialisation rather than uniform technological diffusion (Cicerone et al., 2026). The Baltic evidence supports this view and shows that digital twin readiness matters most where sectoral capabilities and green restructuring pressures reinforce each other.
5.2. Theoretical and policy implications
The main theoretical contribution of this study is to connect the digital twin, green entrepreneurship and twin transition literatures through the concept of meso-level readiness. Rather than treating digital twins only as engineering tools or firm-level applications, this study conceptualises DTRI as a capability condition that can be compared across countries, industries and years. In doing so, it extends digital twin research beyond the technology application focus that dominates much of the existing literature on monitoring, optimisation and system performance in urban, industrial and energy settings (Allam & Jones, 2021; Soori et al., 2023; Ba et al., 2025).
A second contribution concerns the differentiated nature of green entrepreneurship. The findings show that digital twin-related readiness is more closely associated with venture capital mobilisation and green patenting than with start-up formation. This suggests that advanced digital readiness is more relevant to the depth of green entrepreneurial ecosystems, including technological credibility, financing capacity and innovation intensity, than to the simple expansion of firm numbers. It also helps explain why previous studies may produce mixed findings when entrepreneurial entry alone is used as the main outcome.
A third contribution concerns the twin transition paradox. Digitalisation may support environmental upgrading, but it may also generate rebound effects or increase energy and material pressures, a concern also reflected in recent European environmental assessments (European Environment Agency, 2024). This concern is reflected in the classic arguments related to the Jevons paradox (Polimeni et al., 2015), in recent evidence on digital technology and energy rebound (Liu, Liu & Huo, 2025) and in broader studies, which show that digital transformation may exacerbate carbon emissions or material burdens in some cases (Khorishko & Vasylchuk, 2022; Favot et al., 2023; Škare, Gavurova & Porada-Rochon, 2024; Liobikienė & Brizga, 2025). The findings of this study do not dismiss these concerns. On the contrary, they show that in small open post-transition economies, when complementary sectoral capabilities already exist, the readiness related to digital twins is more likely to support green financing and innovation.
The practical implication is that digital policies should not only focus on increasing the number of digital enterprises or raising overall digital investment but should link digital capacity building with green transition priorities and sectoral transformation agendas (European Commission, n.d.). In the Baltic region, the effect seems to be more significant when digital support targets industries that have both absorption capacity and a clear green upgrading path. For governments, development agencies and public innovation funds, this means that a ‘one-size-fits-all’ digitalisation policy is unlikely to produce the best results. Combining digital investment with sector-oriented industrial policies, innovative financing mechanisms and regional comparative advantages is more likely to improve the quality of green entrepreneurship (Morgan, 2013; Eteris, 2020). This interpretation is consistent with the research results on post-transition Europe, which show that differences in policy timing, institutional quality and absorption capacity will shape whether green investment and digital investment promote each other or maintain a loose connection (Štreimikienė, 2021; Muench et al., 2022; Bănică et al., 2024).
5.3. Limitations and future research
The conclusions of this study should be interpreted within clear boundary conditions. First, DTRI measures prerequisite capabilities, not the actual adoption of digital twin technology at the enterprise level. Second, although the instrumental-variable strategy improves identification, it does not completely exclude the possibility that broader changes in the cost of ICT or investment conditions will also affect green entrepreneurial outcomes. Third, the research results are most directly applicable to small open post-transition economies exposed to the EU's green and digital policy framework and should not be rigidly generalised to large economies or regions with weak institutional foundations. Future research should more directly link industry readiness with firm-level adoption, examine how readiness affects investor confidence, innovation depth and scalability and extend the sample to other Central and Eastern European countries to test whether the Baltic pattern has a wider applicability.
Appendices
Appendix
A.1. Robustness Check: Later-Period Subsample (2021–2024)
To reduce concerns about interpolation and backward projection in early ICT indicators, we re-estimate the core fixed-effects (FE) and instrumental-variable (IV) specifications using the 2021–2024 subsample. This subsample contains 108 country–industry–year observations, corresponding to 27 country–industry units observed over four years.
Table A.1 shows that the DTRI coefficients remain positive across all outcomes. The IV estimates are larger than the corresponding FE estimates, and the Kleibergen–Paap F-statistic indicates acceptable instrument relevance. Given the smaller sample size, these results should be interpreted as a robustness check rather than as independent causal evidence. Overall, the later-period estimates are consistent with the main findings.
Table A.1.
FE and IV regression results for the later-period subsample, 2021–2024
| Variables | (1) ln(1 + Startups) (FE) | (2) ln(1 + VC) (FE) | (3) ln(1 + Patents) (FE) | (4) ln(1 + Startups) (IV) | (5) ln(1 + VC) (IV) | (6) ln(1 + Patents) (IV) |
|---|---|---|---|---|---|---|
| DTRI | 0.091* | 0.137** | 0.115* | 0.195* | 0.302** | 0.255** |
| −0.052 | −0.065 | −0.061 | −0.105 | −0.122 | −0.114 | |
| Controls | Yes | Yes | Yes | Yes | Yes | Yes |
| Fixed effects | Yes | Yes | Yes | Yes | Yes | Yes |
| Observations | 108 | 108 | 108 | 108 | 108 | 108 |
| K-P F-stat | 15.88 | 15.88 | 15.88 |
Note: Robust standard errors clustered at the country–industry level are reported in parentheses. The subsample contains 108 country–industry–year observations from 2021 to 2024. Reported controls follow the baseline specification: ln(GVA), ln(GFCF), GDP per capita and R&D intensity. The Kleibergen–Paap F-statistic is reported only for the IV specifications.