

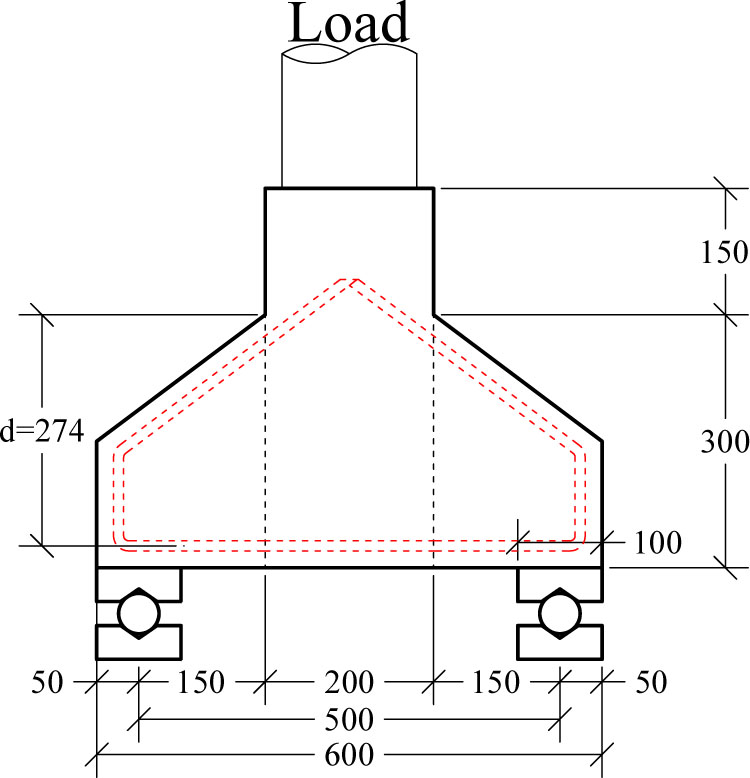
Figure 1:
Test setup for double sided corbel
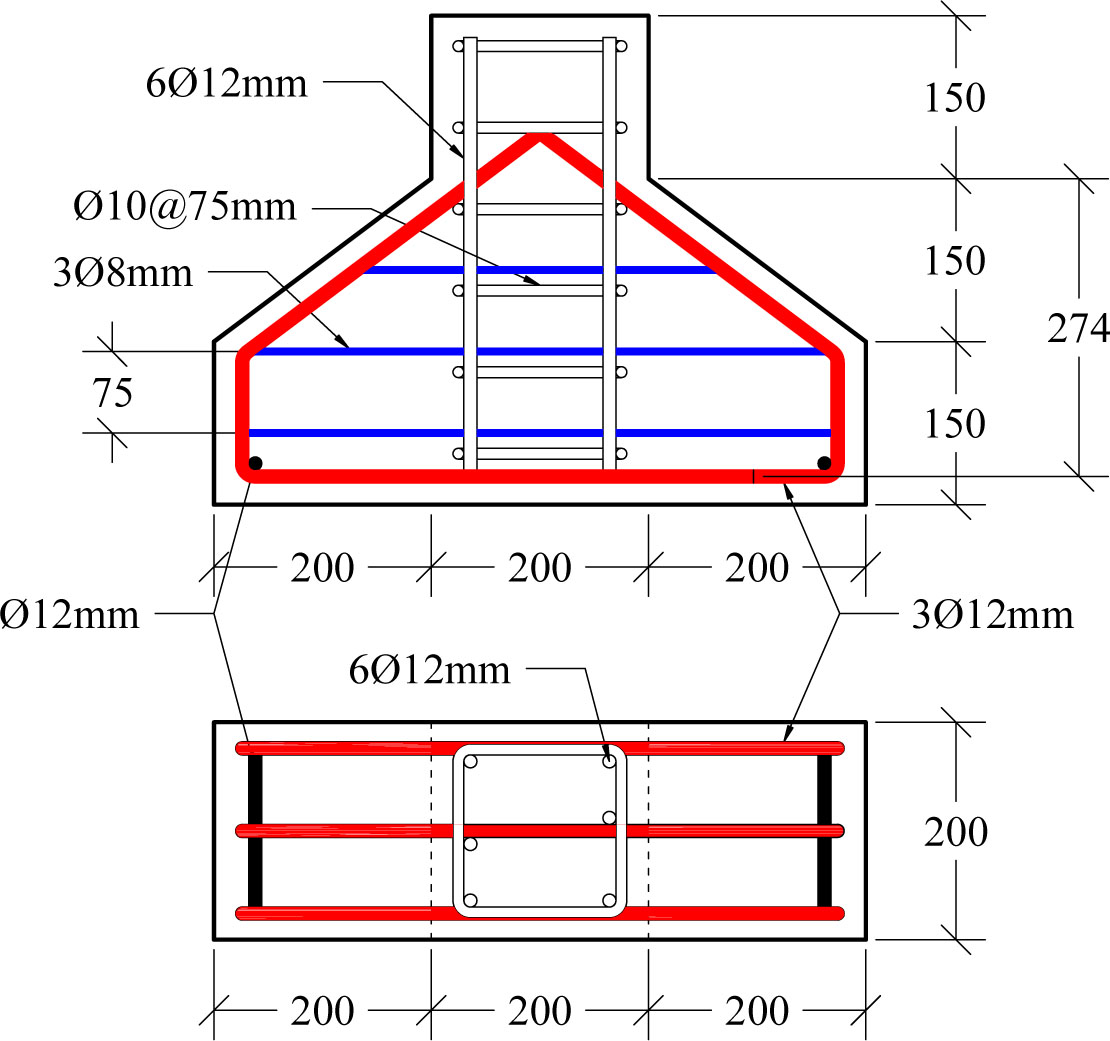
Figure 2:
Corbel reinforcement
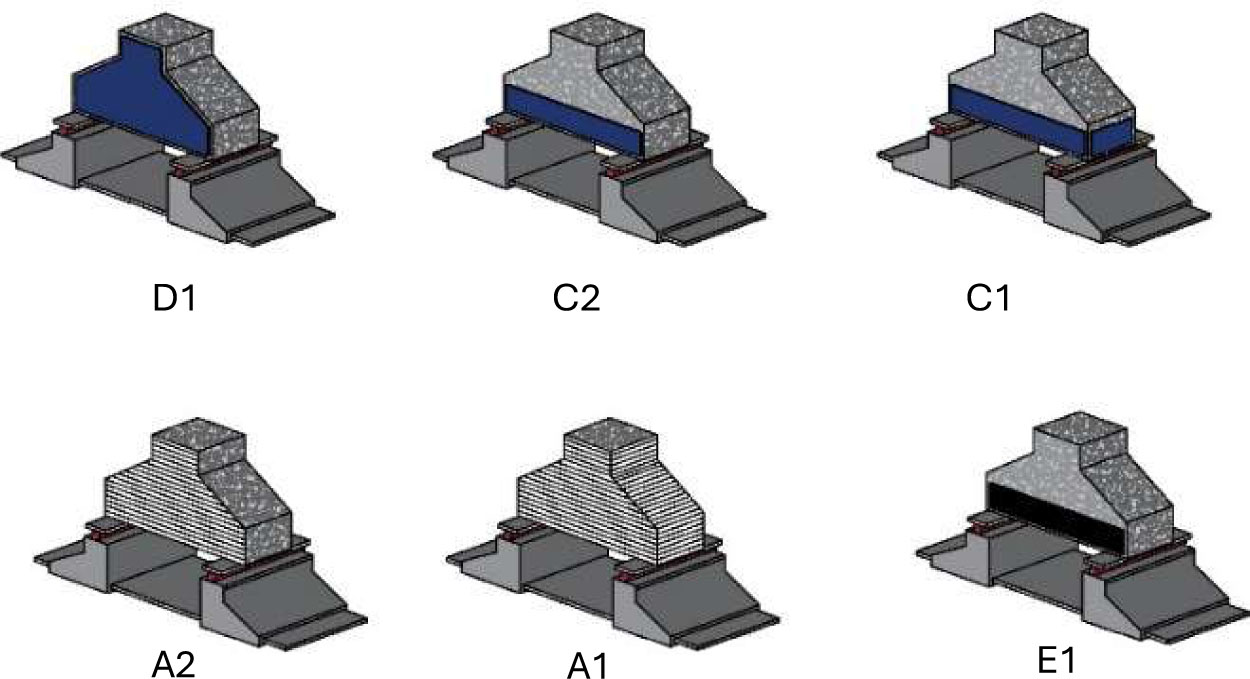
Figure 3:
Corbel strengthen strategy
Table 1:
Beam description and strengthening method
| No. | Corbel ID | Description |
|---|---|---|
| 1 | C0 | Corbel control |
| 2 | A1 | CFRP full |
| 3 | A2 | CRRP two sides |
| 4 | C1 | Steel strip full |
| 5 | C2 | Steel strip two side |
| 6 | D1 | Full steel plate |
| 7 | E1 | CFRP plat strip |
| 8 | G1 | Sika Mono-Top 612 |
Table 2:
Mechanical properties of steel reinforcement
| Bar diameter [mm] | Yield strength [Mpa] | Ultimate strength [Mpa] | Modulus of elasticity [GPa] |
|---|---|---|---|
| 12 | 510 | 680 | 199.9 |
| 10 | 490 | 635 | 199.7 |
| 8 | 465 | 620 | 198.3 |
Table 3:
Mechanical properties of externally bonded steel plate
| Yield strength [Mpa] | Ultimate strength [MPa] | Modulus of elasticity [GPa] |
|---|---|---|
| 310 | 378 | 207 |
Table 4:
Concrete mixture material quantity per m3
| Material | Mass [kg/m3] |
|---|---|
| Cement | 370 |
| Fine aggregate | 740 |
| Coarse aggregate | 1100 |
| Water | 181.3 |
| W/C (%) | 0.49 |
| superplasticizer | 2.22 |
Table 5:
Concrete mechanical properties
| Test | Results |
|---|---|
| Modulus of rupture [MPa] | 4.31 |
| Compression strength [MPa] | 34.8 |
| Splitting tensile strength [MPa] | 2.17 |
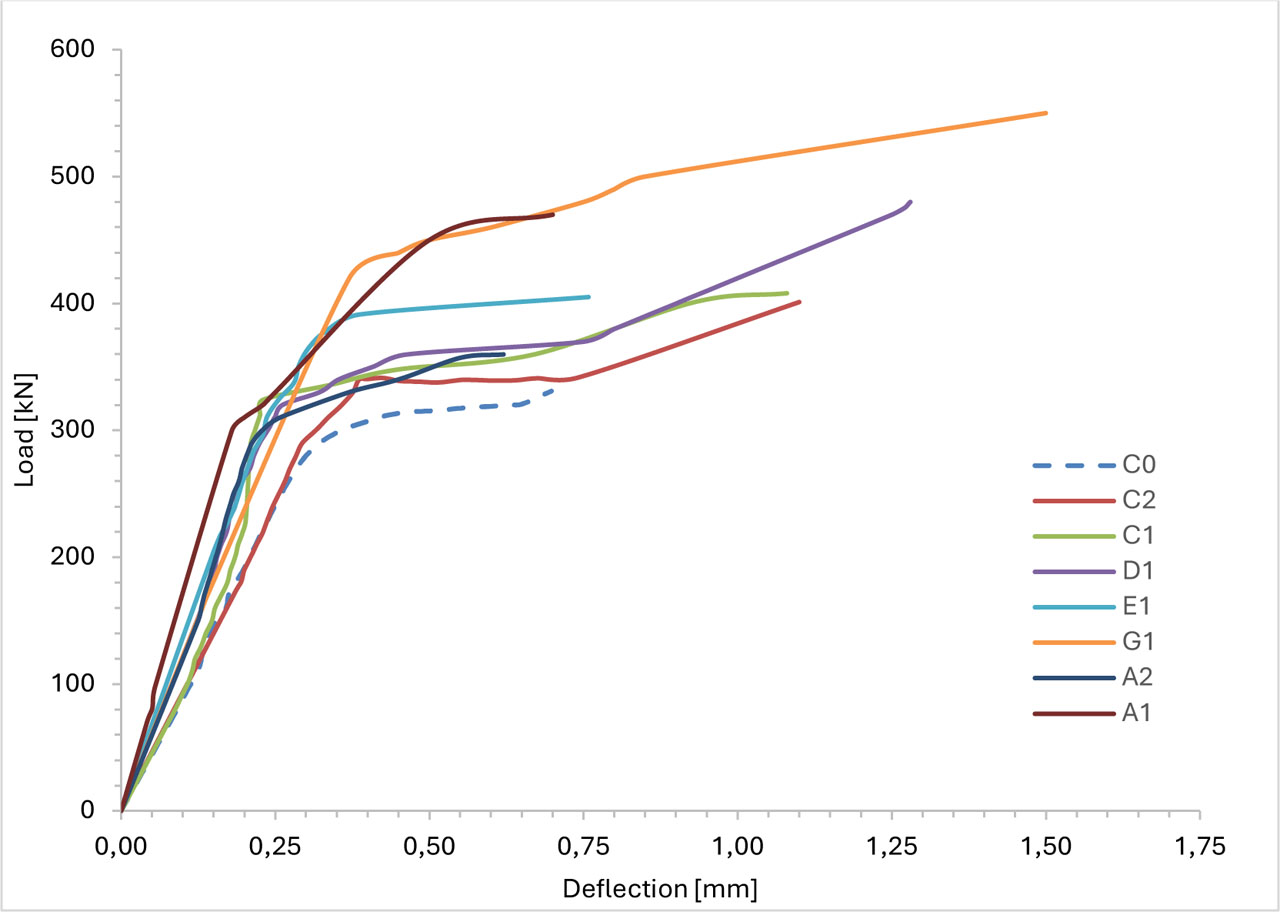
Figure 4:
Load deflection curves for the tested corbels
Table 6:
First crack and ultimate load values
| Corbel ID | First crack | Ultimate load | ∆ control [%] |
|---|---|---|---|
| C0 | 140 | 331 | 0 |
| A1 | 450 | 470 | 42 |
| A2 | 300 | 360 | 9 |
| C1 | 180 | 408 | 23 |
| C2 | 200 | 401 | 21 |
| D1 | 320 | 480 | 45 |
| E1 | 290 | 405 | 22 |
| G1 | 120 | 550 | 66 |
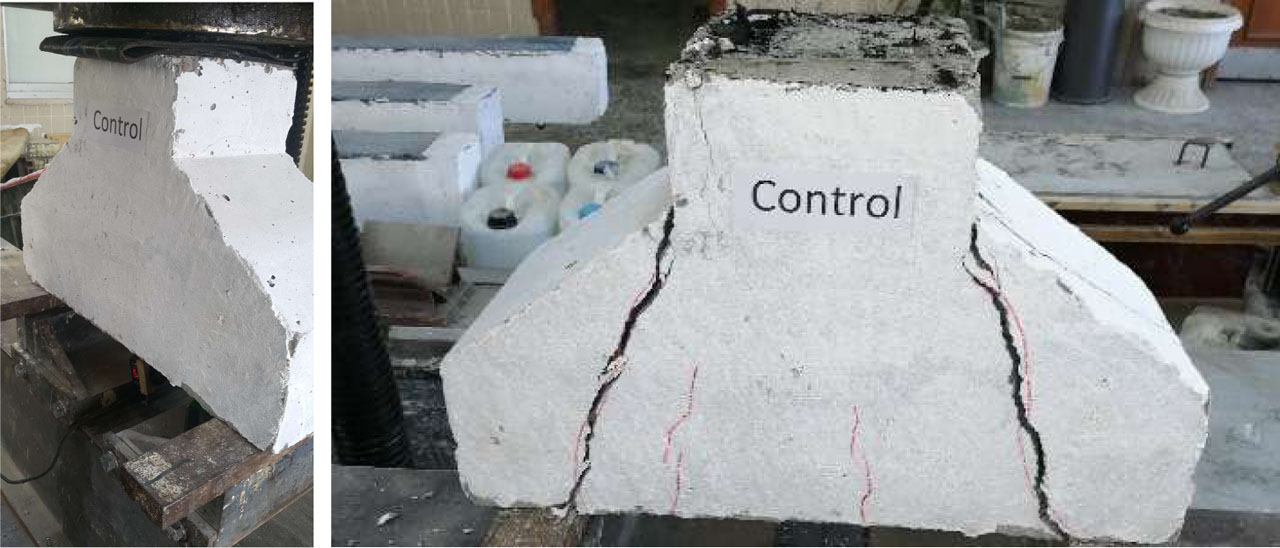
Figure 5:
Control corbel testing and failure
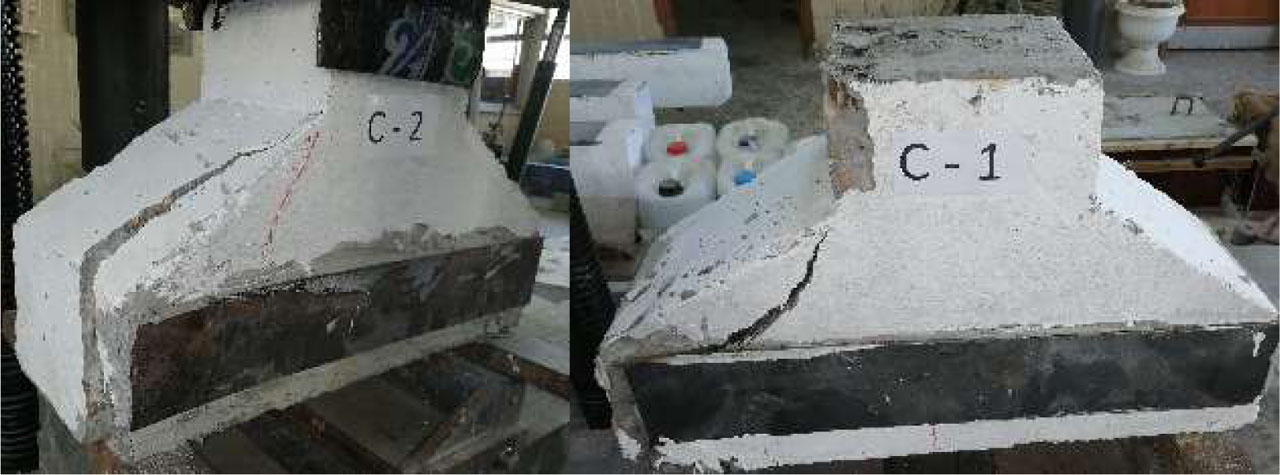
Figure 6:
Specimen C1 and C2 failure
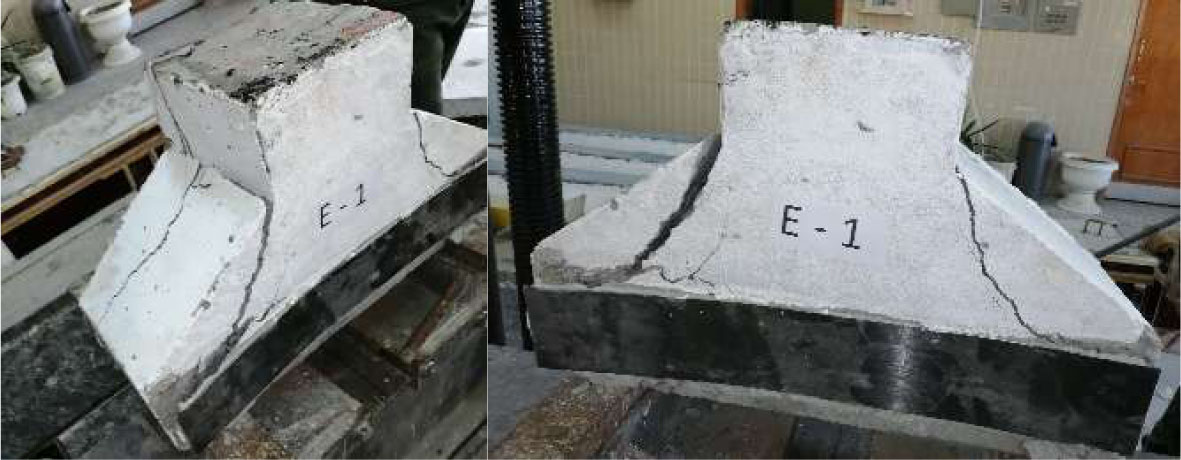
Figure 7:
Specimen E1 failure
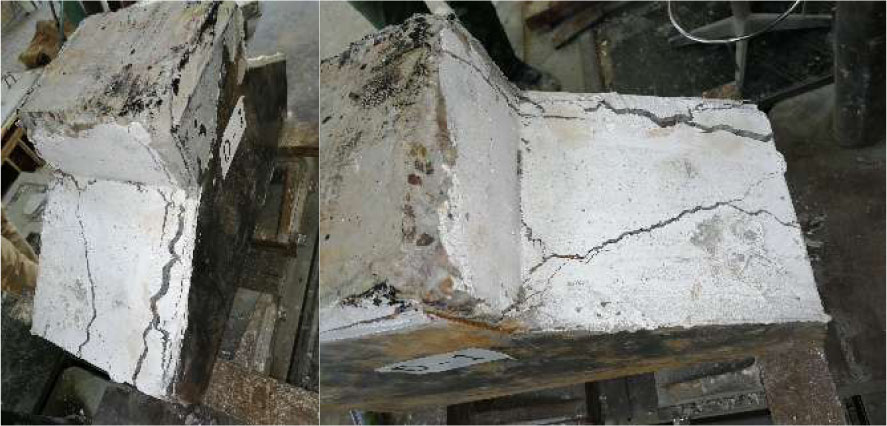
Figure 8:
Specimen D1 failure
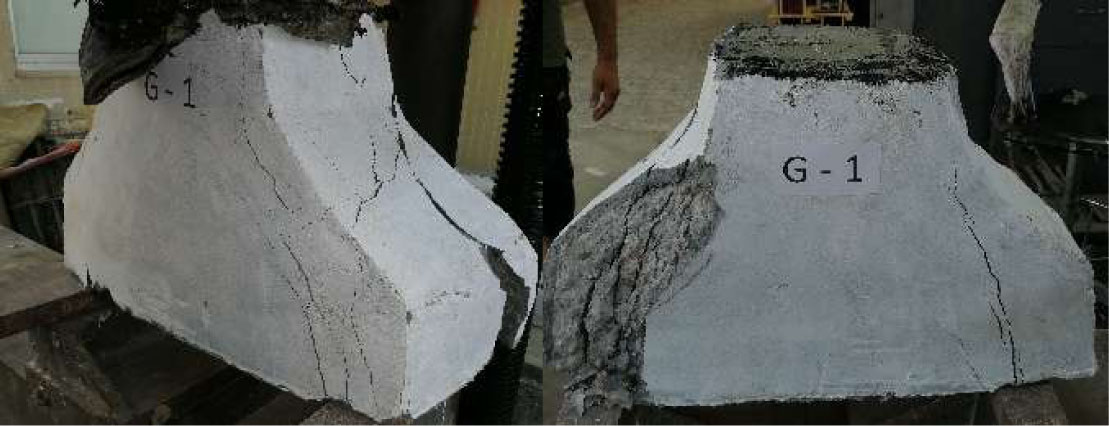
Figure 9:
Specimen G1 failure
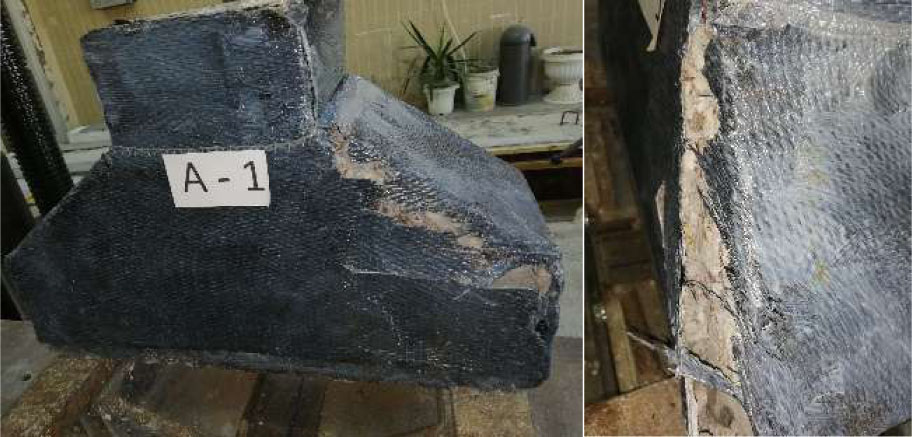
Figure 10:
Specimen A1 failure
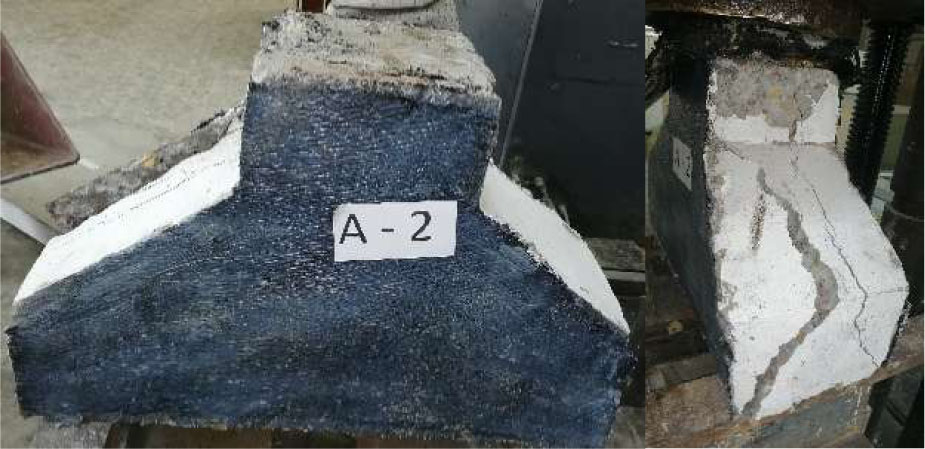
Figure 11:
Specimen A2 failure
Table 7:
Initial stiffness
| Corbel ID | Initial stiffness [kN/mm] | ∆ control [%] |
|---|---|---|
| C0 | 968 | 0 |
| A1 | 1667 | 72 |
| A2 | 1224 | 27 |
| C1 | 1017 | 5 |
| C2 | 999 | 3 |
| D1 | 1304 | 35 |
| E1 | 1333 | 38 |
| G1 | 1176 | 22 |
Table 8:
Displacement-ductility values
| Corbel ID | ∆y | ∆U | μ∆ | ∆ control [%] |
|---|---|---|---|---|
| C0 | 0.34 | 0.698 | 2.04 | 0 |
| A1 | 0.28 | 0.700 | 2.48 | 22 |
| A2 | 0.26 | 0.620 | 2.40 | 18 |
| C1 | 0.40 | 1.080 | 2.69 | 32 |
| C2 | 0.40 | 1.100 | 2.74 | 34 |
| D1 | 0.37 | 1.280 | 3.48 | 70 |
| E1 | 0.30 | 0.758 | 2.50 | 22 |
| G1 | 0.47 | 1.500 | 3.21 | 57 |
Table 9:
Energy absorption values
| Corbel ID | Area under the curve [kN.mm] | Change in absorbed energy relative to control [%] |
|---|---|---|
| C0 | 166.01 | 0 |
| A1 | 238.97 | 44 |
| A2 | 165.35 | 0 |
| C1 | 340.14 | 105 |
| C2 | 323.83 | 95 |
| D1 | 440.70 | 165 |
| E1 | 239.28 | 44 |
| G1 | 537.67 | 224 |
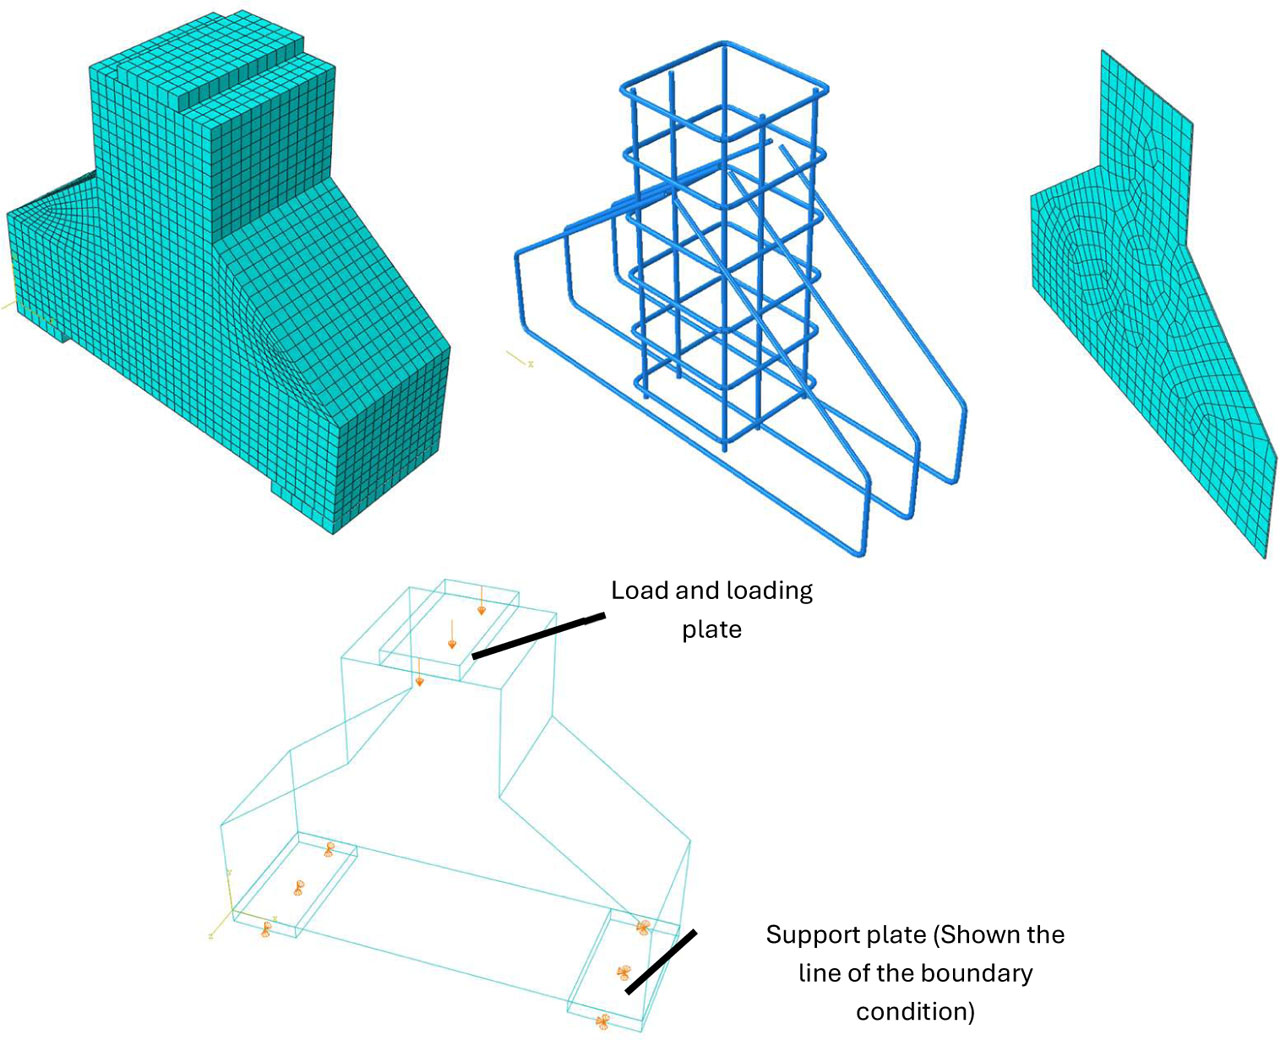
Figure 12:
The geometry of the finite element model, the assembly of the concrete, reinforcement, and strengthening components, the boundary conditions, and the mesh for a representative strengthened specimen
Table 10:
Experimental and FE model ultimate load values
| Corbel ID | PU [kN] | PUFE [kN] | PU – PUFE [kN] | |
|---|---|---|---|---|
| C0 | 331 | 316.2 | −4 | −14.8 |
| A1 | 470 | 502.5 | 7 | 32.5 |
| A2 | 360 | 391.5 | 9 | 31.5 |
| C1 | 408 | 404.1 | −1 | −3.9 |
| C2 | 401 | 404.3 | 1 | 3.3 |
| D1 | 480 | 498.9 | 4 | 18.9 |
| E1 | 405 | 435.3 | 7 | 30.3 |
| G1 | 550 | 570.0 | 4 | 20.0 |
Table 11:
Experimental and FE model ultimate load displacement
| Corbel ID | ∆U [mm] | ∆UFE [mm] | ∆UFE − ∆U [mm] | |
|---|---|---|---|---|
| C0 | 0.70 | 0.84 | 20 | 0.142 |
| A1 | 0.70 | 1.24 | 77 | 0.541 |
| A2 | 0.62 | 0.50 | −19 | −0.120 |
| C1 | 1.08 | 1.49 | 38 | 0.406 |
| C2 | 1.10 | 1.50 | 36 | 0.396 |
| D1 | 1.28 | 1.15 | −11 | −0.134 |
| E1 | 0.76 | 0.86 | 13 | 0.101 |
| G1 | 1.30 | 1.68 | 29 | 0.380 |
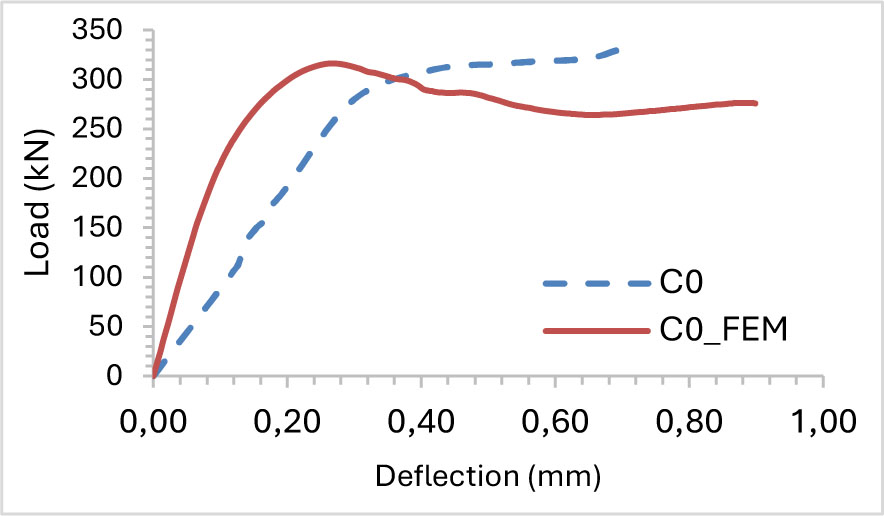
Figure 13:
Experimental and FE load displacement curve for spacemen C0 (control corbel)
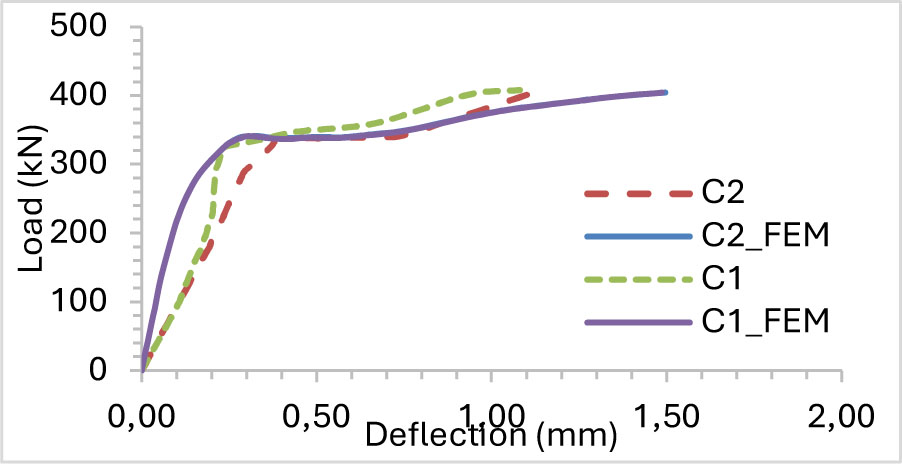
Figure 14:
Experimental and FE load displacement curve for spacemen C1 and C2
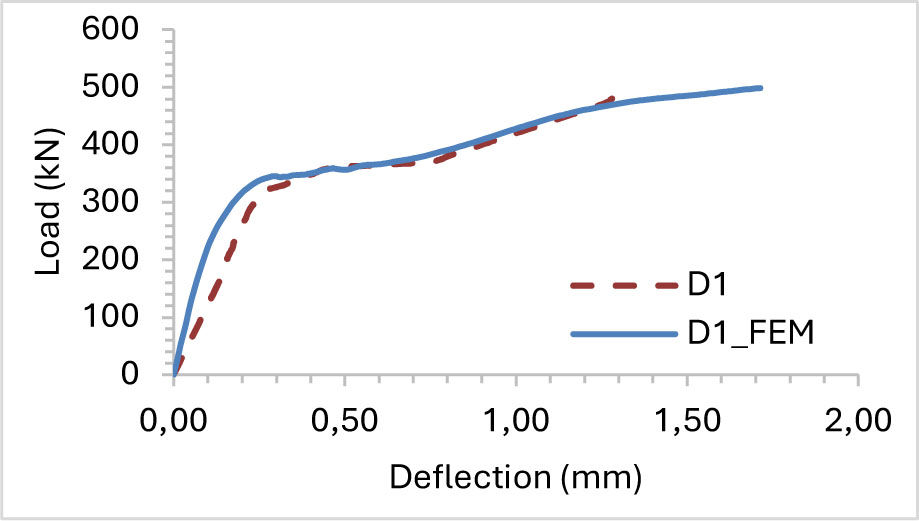
Figure 15:
Experimental and FE load displacement curve for spacemen D1
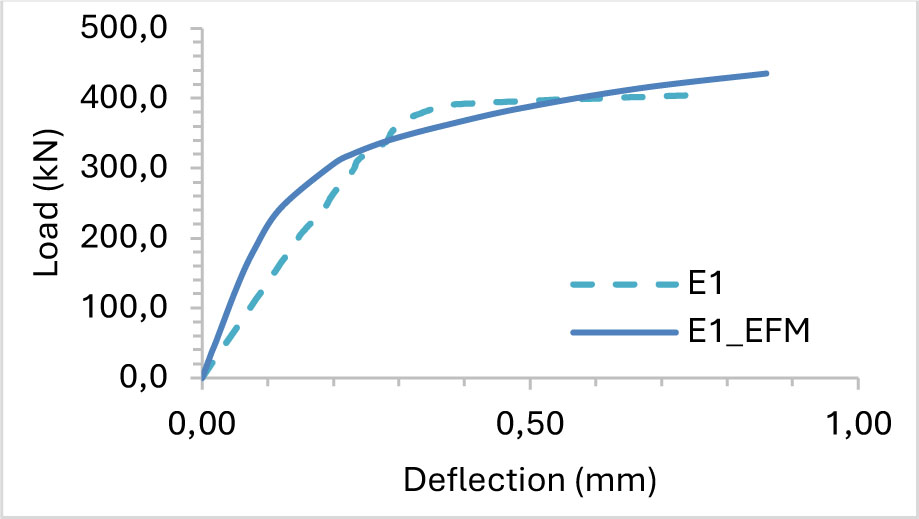
Figure 16:
Experimental and FE load displacement curve for spacemen E1
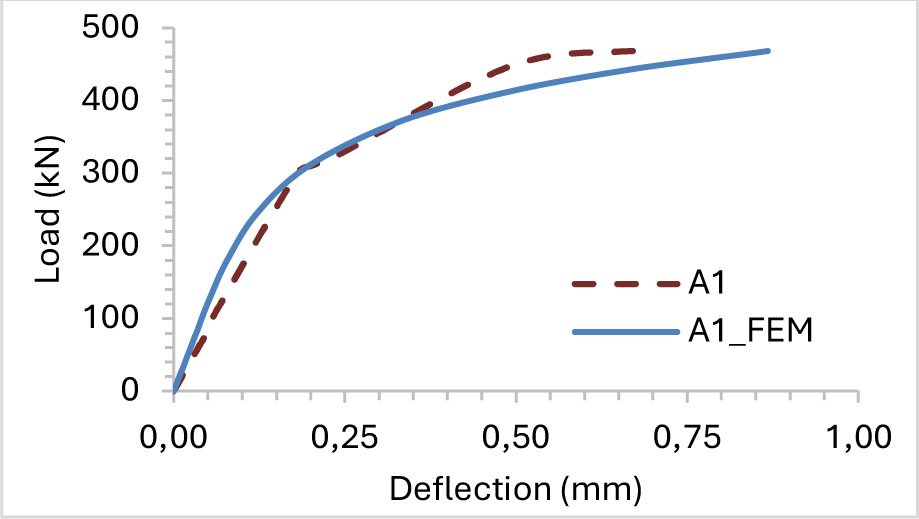
Figure 17:
Experimental and FE load displacement curve for spacemen A1
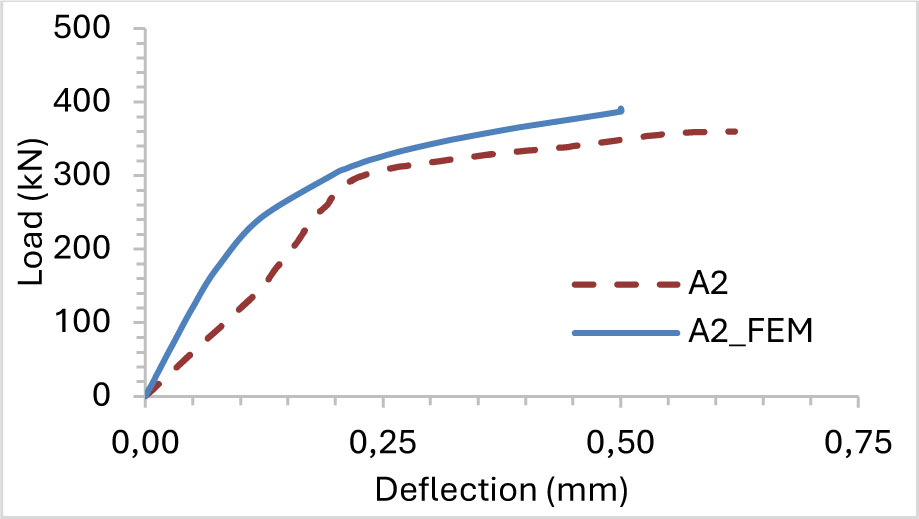
Figure 18:
Experimental and FE load displacement curve for spacemen A2
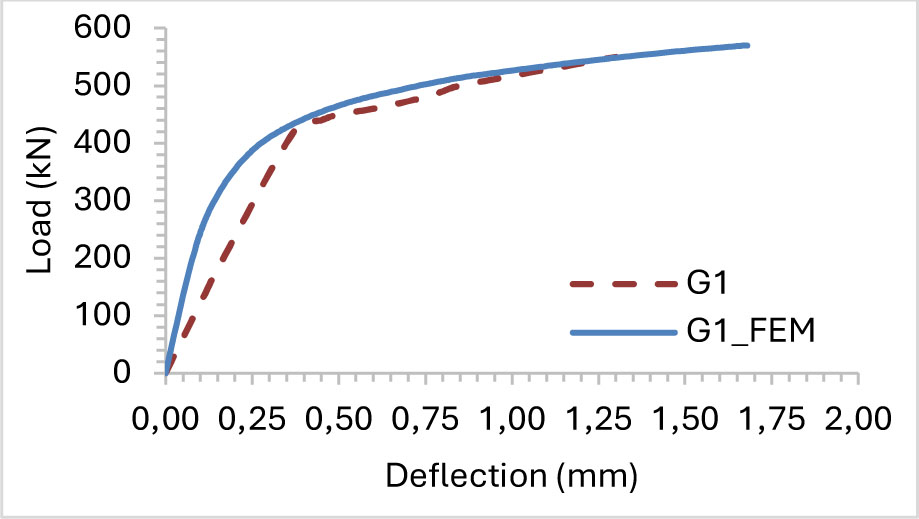
Figure 19:
Experimental and FE load displacement curve for spacemen G1
Table 12:
The experimental and FE area under the curve value
| Corbel ID | AEx [kN.mm] | AFE [kN.mm] | |
|---|---|---|---|
| C0 | 166.01 | 236 | 42 |
| A1 | 238.97 | 313 | 31 |
| A2 | 165.35 | 144 | −13 |
| C1 | 340.14 | 505 | 48 |
| C2 | 323.83 | 510 | 57 |
| D1 | 440.70 | 673 | 53 |
| E1 | 239.28 | 293 | 22 |
| G1 | 537.67 | 794 | 48 |
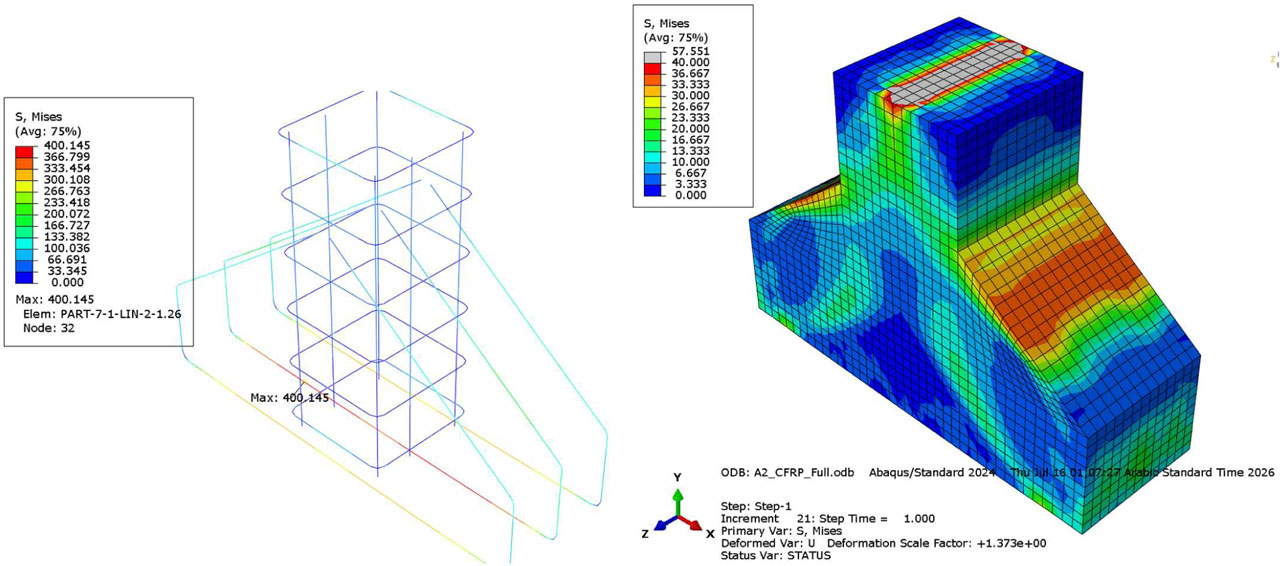
Figure 20:
Full CFRP S, Mises stress in (a) the reinforcement bar, (b) in the corbel concrete part
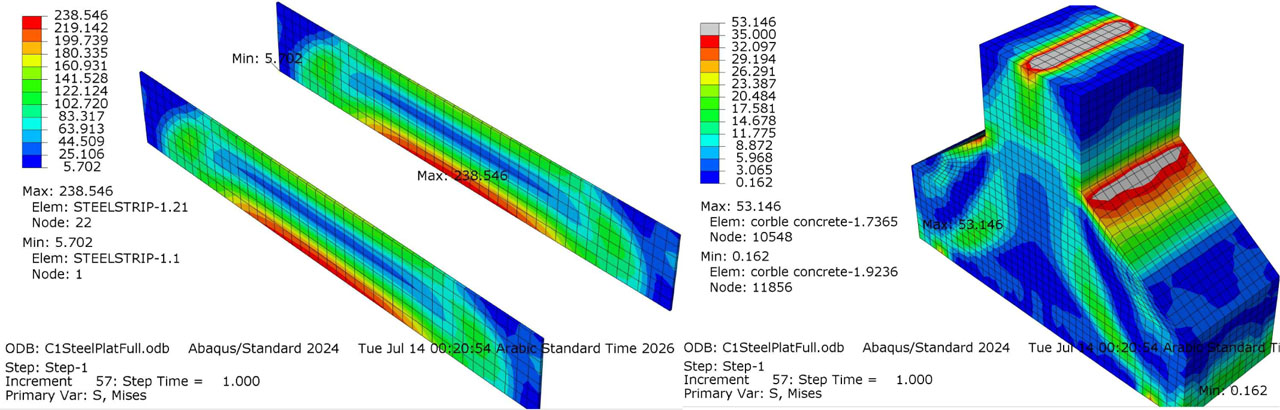
Figure 21:
Steel plate strip S, Mises stress in (a) the steel strip, (b) in the corbel concrete part