

1. Introduction
A corbel also known as bracket is a short cantilever beam mainly designed to carry relatively large, concentrated loads near the column or wall face. The corbel acts as a support to a precast beam, a steel beams, or a crane (Kheyroddin et al., 2024; Shakir & Kamonna, n.d.; Yassin et al., 2015).
The corbel geometry is defined as a beam with the distance from the face of the column to the load (a) divided by the depth of the beam (d) is less than or equal to 1.0 in this case its classified as corbel per ACI 318M (Ibrahim et al., 2024; Shakir & Kamonna, n.d.). when the value of a/d exceeds 1.0 the corbel behaviour shiftiest towards conventional cantilever beam.
Because reinforced concrete corbels behave as disturbed regions, their response is governed by the interaction between diagonal concrete compression struts, tensile reinforcement ties, anchorage zones, cracking, and possible failure of the strengthening material. These mechanisms make the behaviour of corbels difficult to evaluate using simplified analytical methods alone.
Consequently, nonlinear finite element analysis has increasingly been used to investigate stress distribution, crack development, failure mechanisms, and the influence of different reinforcement and strengthening arrangements.
Previous research has shown that finite element modelling can provide reasonable predictions of the structural response of both un-strengthened and strengthened reinforced concrete corbels (Yassin et al., 2015).
Syroka et al. (2011) (Syroka et al., 2011) investigated short reinforced concrete corbels using quasi-static finite element simulations. Their study compared isotropic elastoplastic, isotropic damage, and anisotropic smeared-crack models. A nonlocal formulation was introduced to reduce mesh dependency and to improve the representation of strain localization. The authors reported that the compressive fracture energy had a considerable influence on the predicted ultimate load, whereas the tensile fracture energy had a limited effect. They also found that the presence of horizontal stirrups increased the failure load and improved the ductility of the corbels.
Rezaei et al. (2013) (Rezaei et al., 2013) developed 30 finite element models to study the effects of primary and secondary reinforcement ratios and loading conditions on reinforced concrete corbels. Their results demonstrated that the amount and arrangement of reinforcement have a significant influence on the predicted load-carrying capacity.
El-Maaddawy and El-Sayed (2014)(A & I, 2014) combined experimental testing and finite element modelling to investigate corbels strengthened with different configurations of externally bonded CFRP sheets. Their models were developed using ATENA software, with perfect bond assumed for most CFRP configurations and a bond stress-slip relationship adopted for diagonal CFRP reinforcement. The numerical load capacities were reported to be within approximately 10% of the experimental results.
Romanichen and Souza (2019) (Romanichen & Souza, 2019) also applied nonlinear finite element analysis to conventional and externally prestressed reinforced concrete corbels. Their models incorporated nonlinear material behaviour, bilinear reinforcement properties, and a simplified quadrilateral finite element mesh. This work demonstrated the ability of nonlinear analysis to simulate the redistribution of internal forces caused by cracking, reinforcement yielding, and external prestressing.
More recently, Ghozani et al. (2021) (Ghozani et al., 2021) used nonlinear finite element analysis to examine several CFRP laminate arrangements. Their study evaluated load-carrying capacity, stiffness, ductility, and absorbed energy, and showed that the strengthening configuration had a strong influence on the predicted structural response. The most effective arrangement increased the predicted load-carrying capacity by approximately 81%, while the ductility of one configuration increased by approximately 57% compared with the control model.
2. Experimental Part
In this research eight double sided corbel specimens were tested as shown in the test rig shown in Figure 1. All the specimens have a/d equals to 0.55. corbel reinforcements are shown in Figure 2.
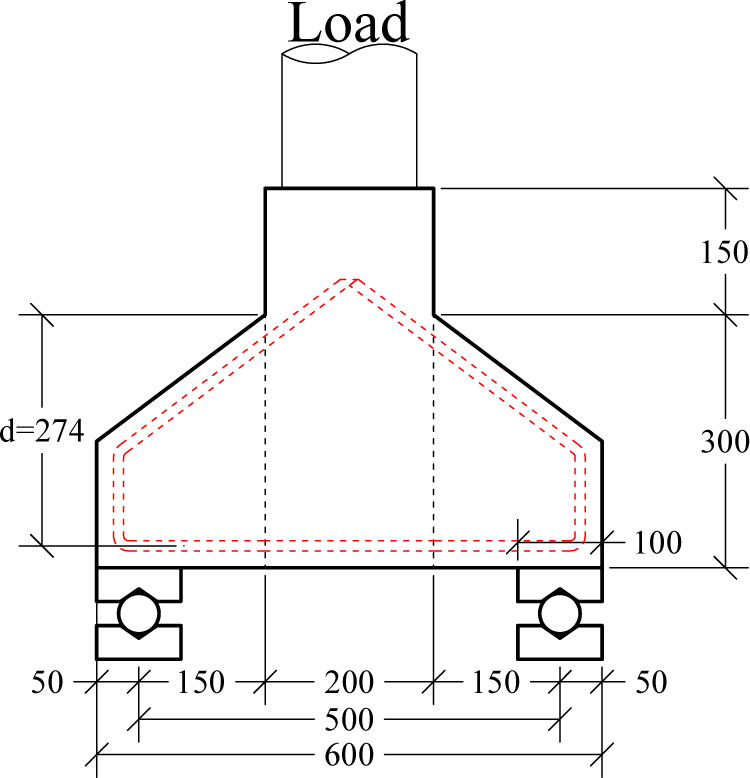
Figure 1:
Test setup for double sided corbel
The corbel shown in Figure 1 and Figure 2 where strengthen using 7 different strategies as shown in Figure 3 and illustrated in Table 1.
The 1st of which is used on beam A1 where Carbon Fiber Reinforced Polymer Sheets (CFRP-sheet) where used to wrap the entire specimen the connection between the CFRP and Concrete surface was achieved using epoxy material and surface preparation as per the product instruction.
For A2, only two faces of the specimen were strengthened with CFRP. For (E1) the corbel was strengthened using a CFRP plate strip.
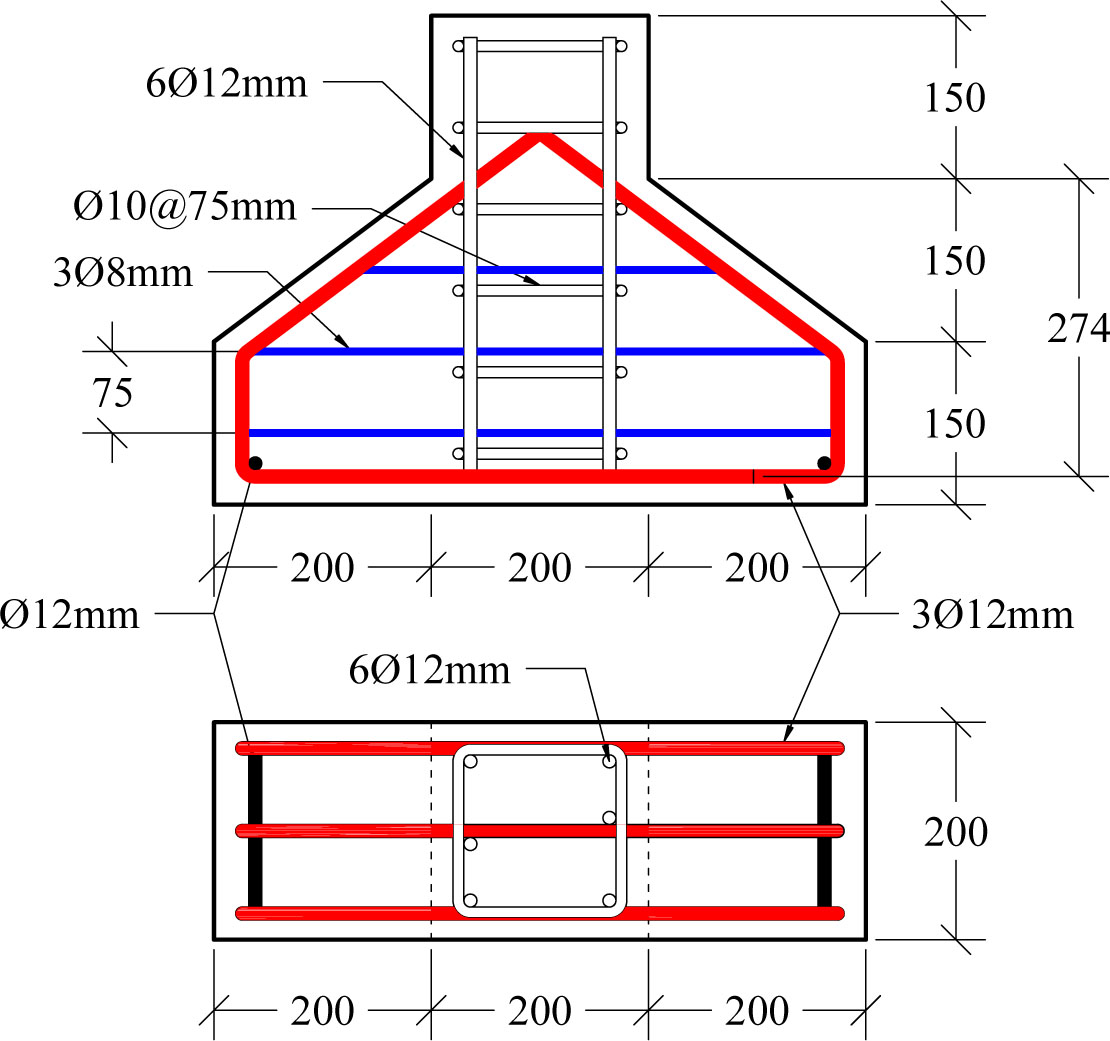
Figure 2:
Corbel reinforcement
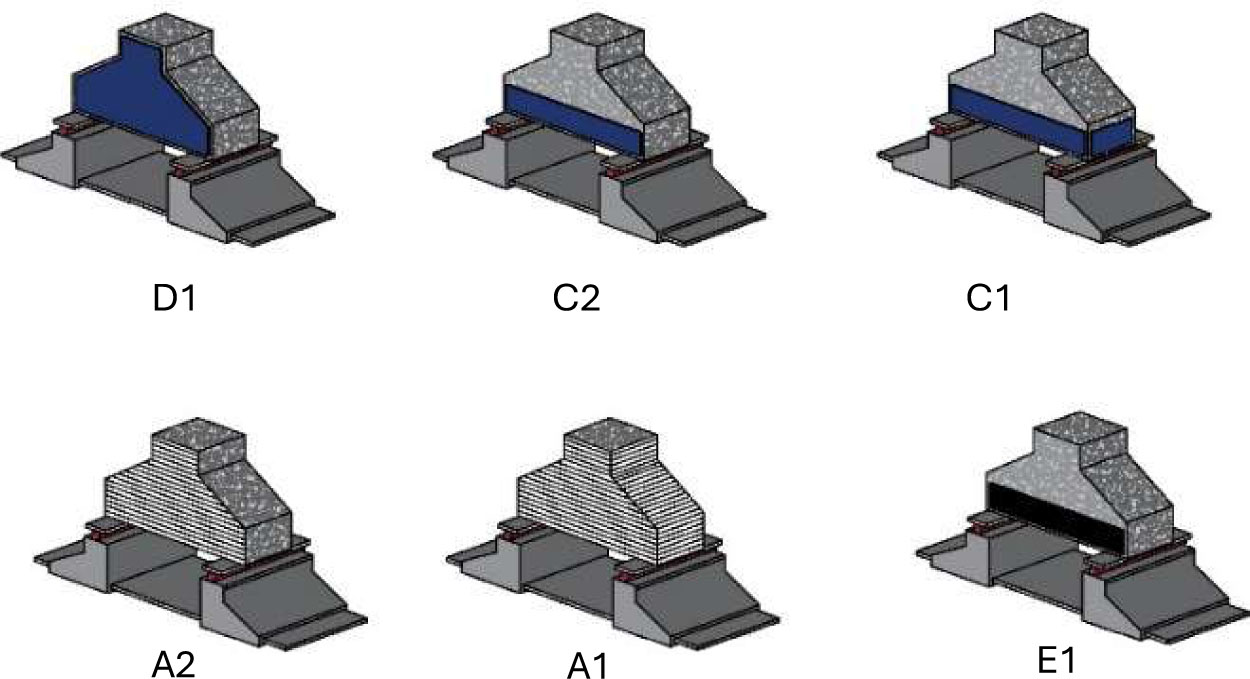
Figure 3:
Corbel strengthen strategy
A 3 mm steel plate was also used to strengthen the corbel in several configurations: a full plate covering two opposite sides of the corbel (as in specimen D1), a steel plate strip bonded along the side surface of the corbel (as in specimen C2), and a steel plate strip wrapped around the corbel (as in specimen C1). In all three configurations, the steel plate or strip was bonded to the prepared concrete surface using the epoxy adhesive Sikadur-32 LP, applied in a uniform layer over the contact area, and the plate was then pressed against the corbel surface to ensure full contact and complete epoxy coverage between the steel and the concrete. No mechanical anchors were used; the bonding between the steel plate and the corbel was achieved entirely through the epoxy adhesive.
Lastly, specimen G1 was only strengthened with sika Mono-Top S12, the corbel where jacketed from all sides using this method and the concrete surface preparation were done to ensure suitable connection.
Table 1:
Beam description and strengthening method
| No. | Corbel ID | Description |
|---|---|---|
| 1 | C0 | Corbel control |
| 2 | A1 | CFRP full |
| 3 | A2 | CRRP two sides |
| 4 | C1 | Steel strip full |
| 5 | C2 | Steel strip two side |
| 6 | D1 | Full steel plate |
| 7 | E1 | CFRP plat strip |
| 8 | G1 | Sika Mono-Top 612 |
2.1. Materials
The materials used in this research were tested according to the applicable ASTM specifications to determine the mechanical properties of each material. These properties were used to assess the quality of the materials and to represent them accurately in the finite element model. For the reinforcing steel, three bar sizes were used (12 mm, 10 mm, and 8 mm). The rebars were tested in tension as full-section bar specimens in accordance with ASTM A615/A615M, with three specimens tested for each bar size. The 3 mm steel plate used in the strengthening specimens (C1, C2, and D1) was tested in tension as flat tensile coupon specimens in accordance with ASTM A36, with three coupons tested. The values reported in Tables 2 and 3 are the mean values calculated from the three tested specimens for each material and bar size.
Table 2:
Mechanical properties of steel reinforcement
| Bar diameter [mm] | Yield strength [Mpa] | Ultimate strength [Mpa] | Modulus of elasticity [GPa] |
|---|---|---|---|
| 12 | 510 | 680 | 199.9 |
| 10 | 490 | 635 | 199.7 |
| 8 | 465 | 620 | 198.3 |
Table 3:
Mechanical properties of externally bonded steel plate
| Yield strength [Mpa] | Ultimate strength [MPa] | Modulus of elasticity [GPa] |
|---|---|---|
| 310 | 378 | 207 |
For the CFRP, a Woven unidirectional carbon fibre fabric (SikaWrap®-300 C) was used, which is designed for structural strengthening applications. The thickness of the material is 0.167 mm per layer, and the tensile strength of the fibres is 4000 MPa, as reported in the manufacturer's material data sheet. The adhesive used to bond the fabric to the concrete surface was Sikadur-330.
The concrete used in the specimens was designed according to the ACI code requirements with a target compressive strength of 35 MPa. The mix design proportions for one cubic meter of concrete are listed in Table 4. The mechanical properties of the hardened concrete were evaluated by testing concrete cylinder specimens, with three cylinders tested for each test, and the mean values from the three specimens are listed in Table 5.
2.2. Experimental Results
As previously explained, seven strengthening methods were used, to compare the efficiency of the methods used. Several experimental data were measured or calculated including the ultimate load, creaking load, ductility, and toughness values. The specimens were loaded gradually, and the mid span deflection were recorded at each loading step to obtain the load displacement curves shown in Figure 4.
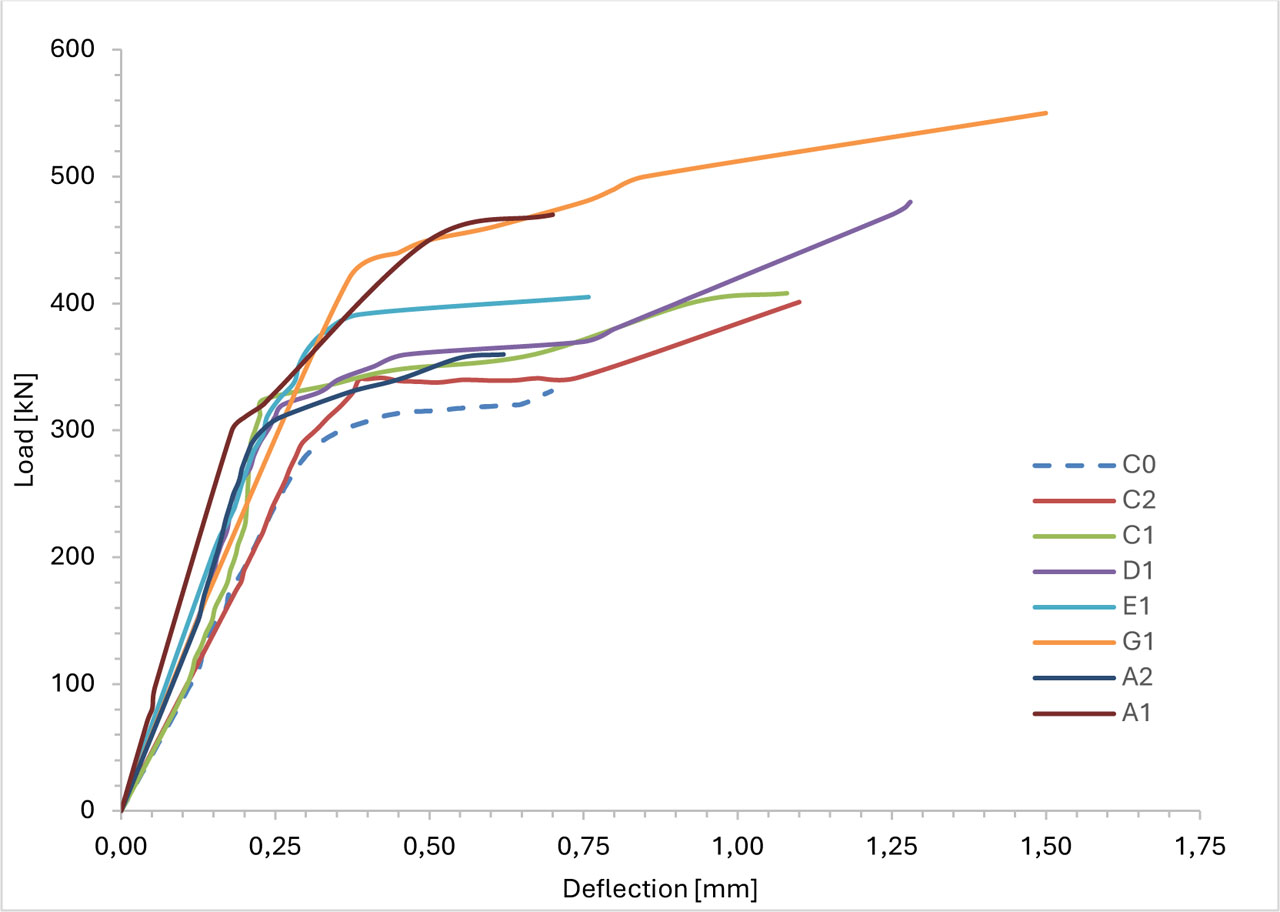
Figure 4:
Load deflection curves for the tested corbels
Ultimate Load
For the tested specimens the ultimate load values are mentioned in Table 6. From, the seven strengthening techniques used, the use of sika Mono-Top S12 achieved a 66% increase in ultimate strength value which is the highest value of increment in the ultimate load, that can be due to the increase in dimensions by 20mm from each side, given that the material compressive strength is slightly higher than that of the concrete thus that dimension increase is more effective.
The specimen strengthened with full steel plate (D1) has enhancement in the ultimate load values of 45% higher than that of the control beam (C0). That is to be expected due to the high value of stiffness contribution of two 3mm steel plates attached to the specimen and since the plate covers the full face of the corbel its contribution to the shear capacity is high as well.
The spacemen A1 with full CFRP which cover the entire surface of the corbel providing a confinement for the concrete and since it’s a unidirectional fabric it also contributes greatly to the shear capacity of the corbel by 42%.
Regarding the CFRP strengthen it can be seen that specimen A2 achieved only a marginal increase in the ultimate load-carrying capacity with only 9% increase in the ultimate load, although the CFRP covered the full face of the corbel from both sides yet it exhibited a debonding failure when the ultimate load was applied thus the CFRP contribution was limited.
For specimens C1 and C2 the increase were 23% and 21% respectively, the plate as can be seen in Figure 4 exhibited an anchorage failure at the ends of the plates that is to be expected in this case, it shall be seen also in the FE analysis that the plate at ultimate load have reached only 62% of its ultimate strength (Figure 21).
For specimen E1 which is strengthened with CFRP plat strip it achieved almost the same increment in the ultimate load as that of the steel plate strip, the failure is the same also by debonding from the ends.
Table 6:
First crack and ultimate load values
| Corbel ID | First crack | Ultimate load | ∆ control [%] |
|---|---|---|---|
| C0 | 140 | 331 | 0 |
| A1 | 450 | 470 | 42 |
| A2 | 300 | 360 | 9 |
| C1 | 180 | 408 | 23 |
| C2 | 200 | 401 | 21 |
| D1 | 320 | 480 | 45 |
| E1 | 290 | 405 | 22 |
| G1 | 120 | 550 | 66 |
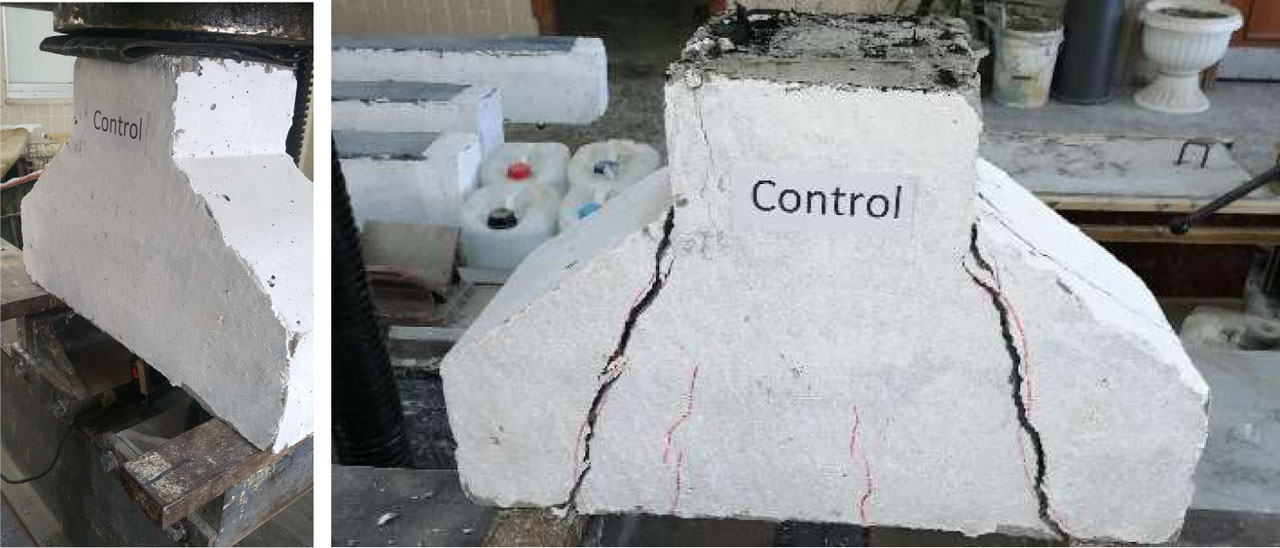
Figure 5:
Control corbel testing and failure
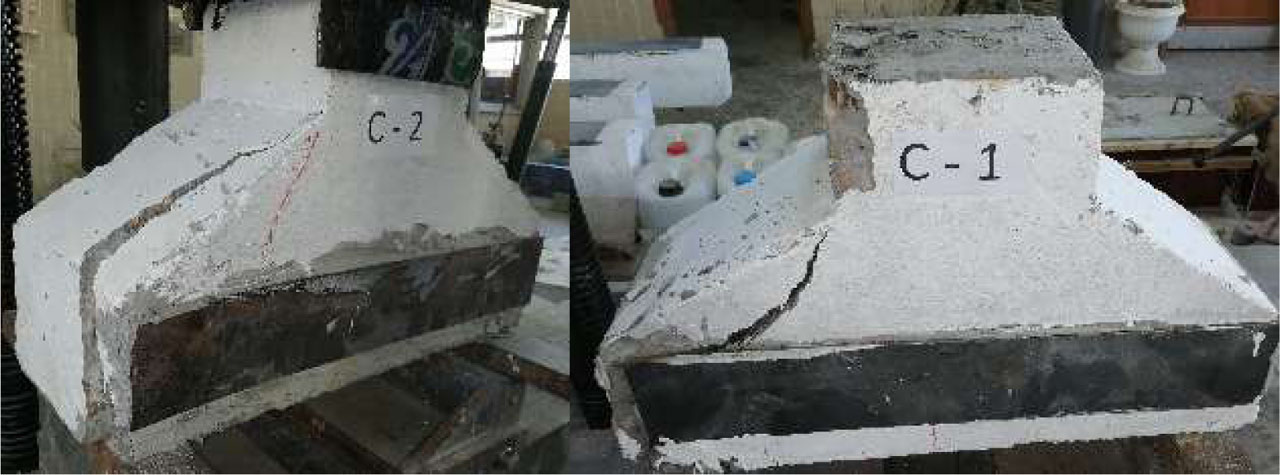
Figure 6:
Specimen C1 and C2 failure
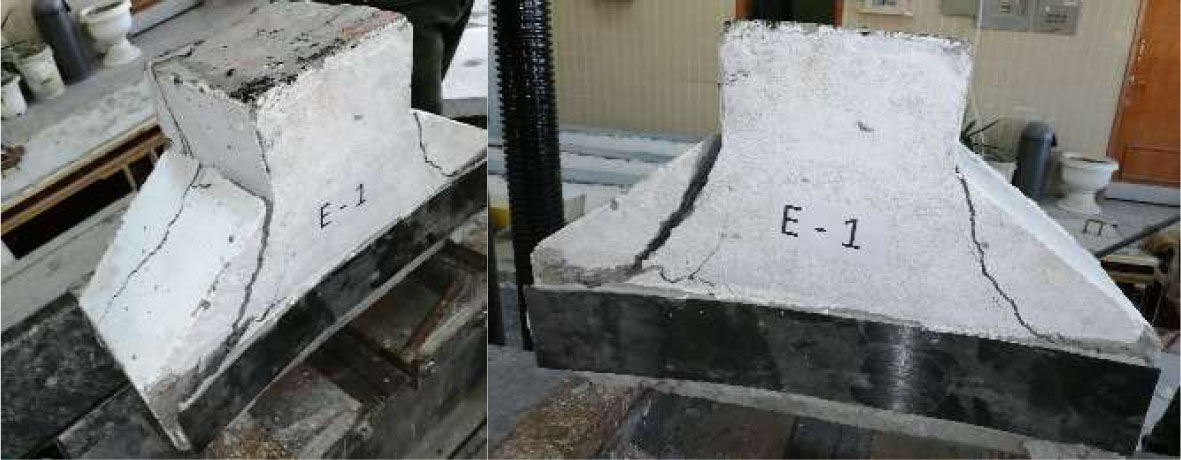
Figure 7:
Specimen E1 failure
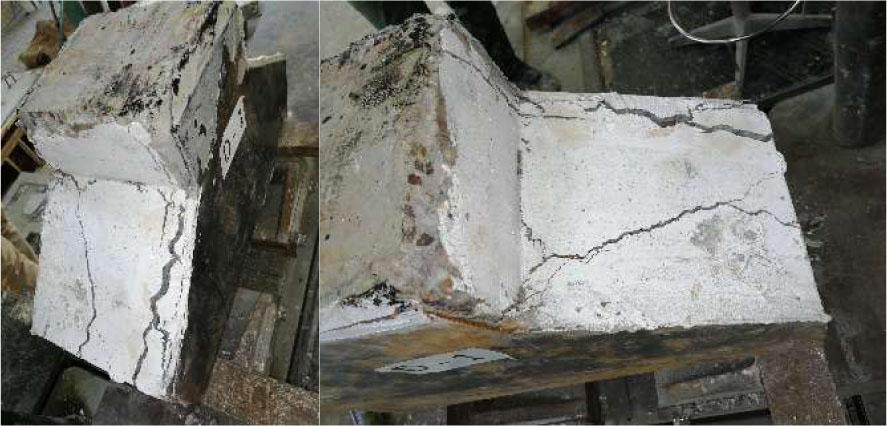
Figure 8:
Specimen D1 failure
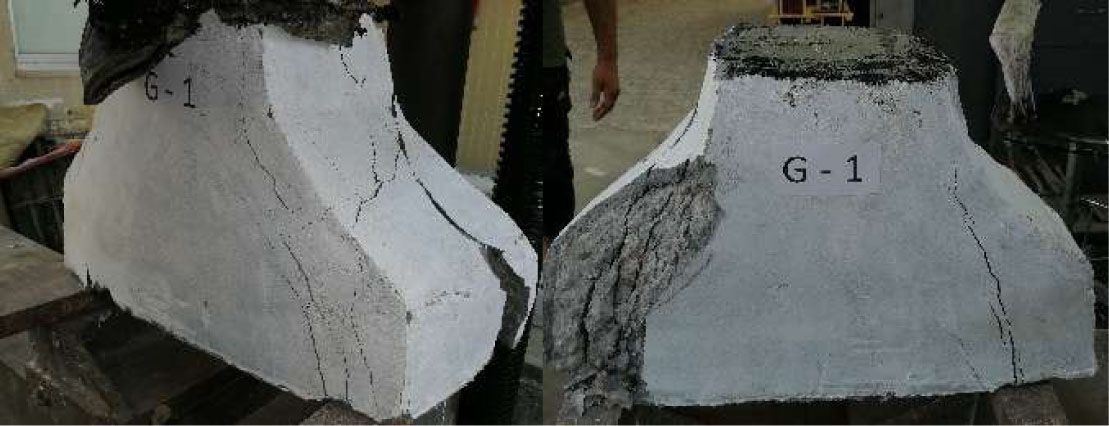
Figure 9:
Specimen G1 failure
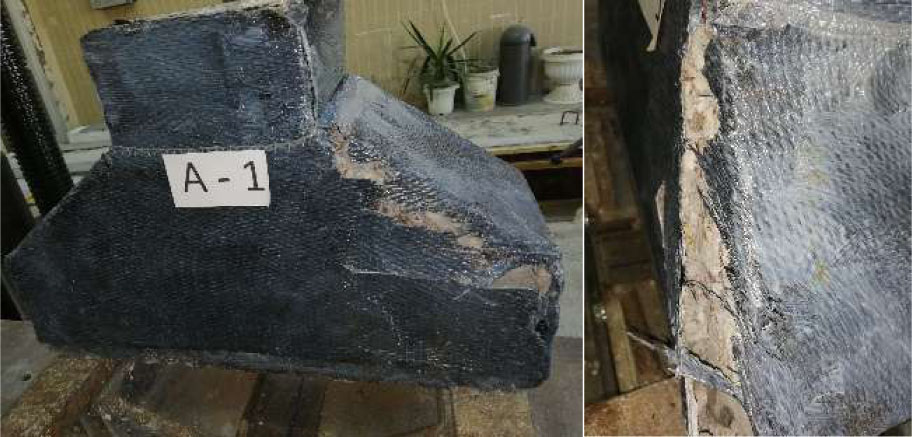
Figure 10:
Specimen A1 failure
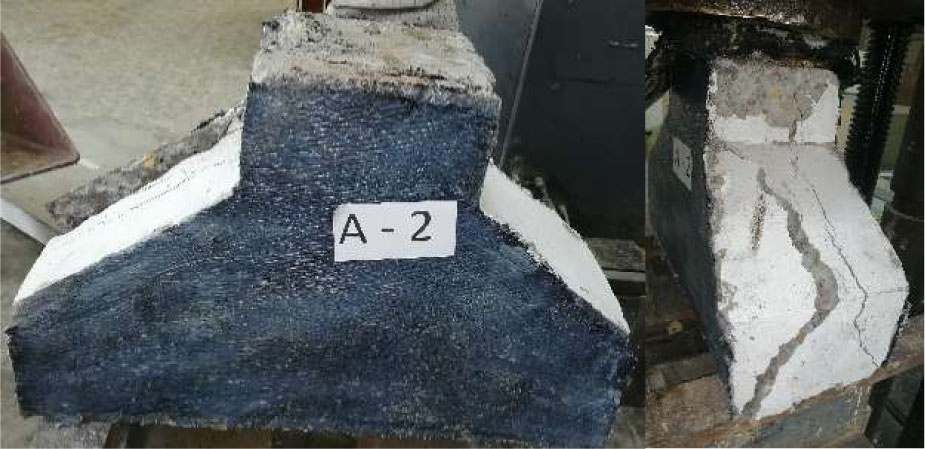
Figure 11:
Specimen A2 failure
Initial Stiffness
The functionality of a corbel in the case of supporting a critical component such as a crane, the deformation of the corbel is greatly important, and strengthening may be to prevent the member from deforming. Thus, regarding the value of the deformation the seven strengthening strategies may be compared by the value of the initial stiffness. The values of the initial stiffness are listed in table 7. As expected, the confinement provided by the high strength fibre of A1 provided the highest value for the initial stiffness 72% more than control followed by the CFRP plate for E1 (38%) then the full steel plate of D1 (35%).
The increase in the cross-section dimensions for G1 although provided a higher ultimate strength yet the contribution in the stiffness was relatively low at 22% increase only due to the lower value of modules of elasticity of the Sika Mono-Top if compared to the CFRP or the Steel plate.
For the corbels C1, C2, and A2 the contribution of the strengthening was interrupted by the debonding as previously mentioned that effect can be seen in the initial stiffness values where it can be estimated that the slip started at early stages of loading. This effect shall be further studded using the FE model.
Ductility
In the present study, ductility should be considered alongside ultimate load-carrying capacity, cracking load, stiffness, and failure mode. A strengthening technique should not be judged successful only because it increases the ultimate load. A method that produces a high load-carrying capacity but causes sudden debonding, concrete crushing, or strut failure may provide a stronger corbel without providing a safer or more ductile response.
The definition of ductility is the ability of a member to withstand load after the yield point while maintaining a significant portion of its load-carrying capacity, rather than failing suddenly.
This definition is particularly important for corbels because their short shear span commonly leads to diagonal tension, shear compression, or strut failure, which can occur with limited warning. (Ozden & Atalay, 2011).
For a quantitative comparison, the displacement ductility factor may be calculated as:
Where:
μ∆: displacement ductility,
∆U: displacement corresponding to the ultimate load,
∆y: displacement at the first yielding of the main reinforcement or at the equivalent yield point of the load-displacement curve.
This approach has been used in numerical studies of strengthened corbels to compare the ductility of strengthened and control specimens (Shabazi Ghozani et al., 2021). The ductility values for the tested corbels are listed in Table 8.
The results show that the strengthening configuration had a clear influence on the ductility of the corbels. The full 3 mm-thick steel plates installed on both sides produced the greatest ductility improvement, increasing the ductility factor by approximately 70% relative to the control specimen. This was followed by the specimen strengthened with a 20 mm-thick Sika Mono-Top 612 layer, which achieved a 53% increase. The steel plate strip configuration produced a smaller increase of 34%. The lower ductility of this specimen can be attributed to premature debonding, which interrupted the stress-transfer mechanism between the steel strip and the concrete. Consequently, the steel strip was unable to develop its full plastic capacity. This conclusion is consistent with the finite element analysis, in which the maximum stress in the strip reached only about 70% of the steel yield strength. Therefore, the failure was governed by the steel-concrete interface rather than by yielding the steel strip itself.
Energy Absorption
The energy absorption capacity was evaluated from the area under the load-displacement curves. The control specimen, C0, exhibited an area of 166kN.mm. Among the strengthened specimens, the corbel strengthened with a 20 mm-thick layer of Sika Mono-Top 612, G1, demonstrated the highest energy absorption, with an area of 538kN.mm. This value represents an increase of approximately 224% relative to the control specimen. The full steel plate specimen, D1, showed the second-highest energy absorption, with an area of 441 kN.mm and an increase of approximately 166%. The full steel strip and two-sided steel strip specimens increased the absorbed energy by approximately 105% and 95%, respectively.
The full CFRP and CFRP plate-strip configurations produced identical areas of 239 kN.mm, corresponding to an increase of approximately 44% relative to the control. In contrast, the two-sided CFRP configuration produced an area of 165 kN.mm, which was approximately 1% lower than the control. These results indicate that the CFRP configurations improved the load-displacement response to different degrees, but their energy absorption was limited by the absence of a significant yielding mechanism and by the possibility of premature debonding or localized interface failure.
The results also demonstrate that displacement ductility and energy absorption should be interpreted separately. The full steel plate produced the highest displacement ductility increase, approximately 70%, whereas the Sika Mono-Top 612 specimen produced the highest absorbed energy. This difference occurs because displacement ductility is based on the deformation relative to the yield displacement, while absorbed energy depends on the complete load-displacement curve and is affected by both load and displacement.
3. Finite Element Analysis (ABAQUS)
Reinforced concrete corbels are short structural members with a relatively small shear span-to-depth ratio. Their behaviour is governed by a complex interaction between the diagonal concrete compression strut, the tensile reinforcement tie, the bearing region, and the surrounding concrete. For this reason, corbels are commonly classified as disturbed regions in which the assumptions of conventional beam theory may not adequately describe the actual stress distribution and failure mechanism (Ahmad et al., 2010; Reginato et al., 2023).
Experimental testing provides essential information about the load-carrying capacity, cracking behaviour, deformation, and failure mode of a corbel. However, it does not directly show the development of internal stresses, the redistribution of forces between the concrete and reinforcement, or the contribution of the strengthening material before failure. Nonlinear finite element analysis provides a complementary approach by allowing these mechanisms to be examined throughout the loading process. Previous studies have identified finite element analysis as a suitable method for investigating the behaviour and failure capacity of reinforced concrete corbels, particularly when the numerical results are validated against experimental data (Yassin et al., 2015).
In the present study, nonlinear finite element models were developed to reproduce the behaviour of the tested corbel specimens and their corresponding strengthening configurations. The numerical program included the control specimen and the investigated strengthening schemes, including CFRP systems, steel strips, full steel plates, and the Sika Mono-Top 612 strengthening layer.
The geometry, reinforcement arrangement, loading arrangement, support conditions, and material properties were defined to be consistent with the experimental program. The purpose of the analysis was not only to reproduce the ultimate load, but also to evaluate the complete load-displacement response, cracking progression, stress distribution, deformation capacity, and failure mechanism of each configuration.
3.1. Model Description
A three-dimensional nonlinear finite element model was developed in ABAQUS to simulate the behaviour of the tested corbels, including the control specimen and the seven strengthened specimens. The concrete was modelled using three-dimensional eight-node solid elements with reduced integration (C3D8R) to prevent shear locking. The internal reinforcement, including the main tie bars, the secondary reinforcement, and the column stirrups, was modelled using two-node truss elements (T3D2), which resist axial forces only, and was embedded in the concrete using the embedded region constraint so that the bond between the reinforcement and the concrete was assumed perfect. The strengthening materials were modelled with four-node shell elements with reduced integration (S4R): a single layer of shell elements with a thickness of 0.167 mm was used for each CFRP fabric layer (SikaWrap-300 C), and the 3 mm steel plates were modelled as shell elements as well. The interface between the strengthening elements and the concrete surface was modelled using a surface-to-surface contact formulation. In accordance with the recommended practice of the contact algorithm, the concrete surface, was assigned as the primary (master) surface, while the surface of the strengthening element was assigned as the primary (slave) surface, which carries the more refined mesh. A perfect bond was therefore assumed between the strengthening elements and the concrete, and the adhesive layer was not modelled as a separate continuum. The consequences of this idealization for the predicted initial stiffness are discussed later in the paper.
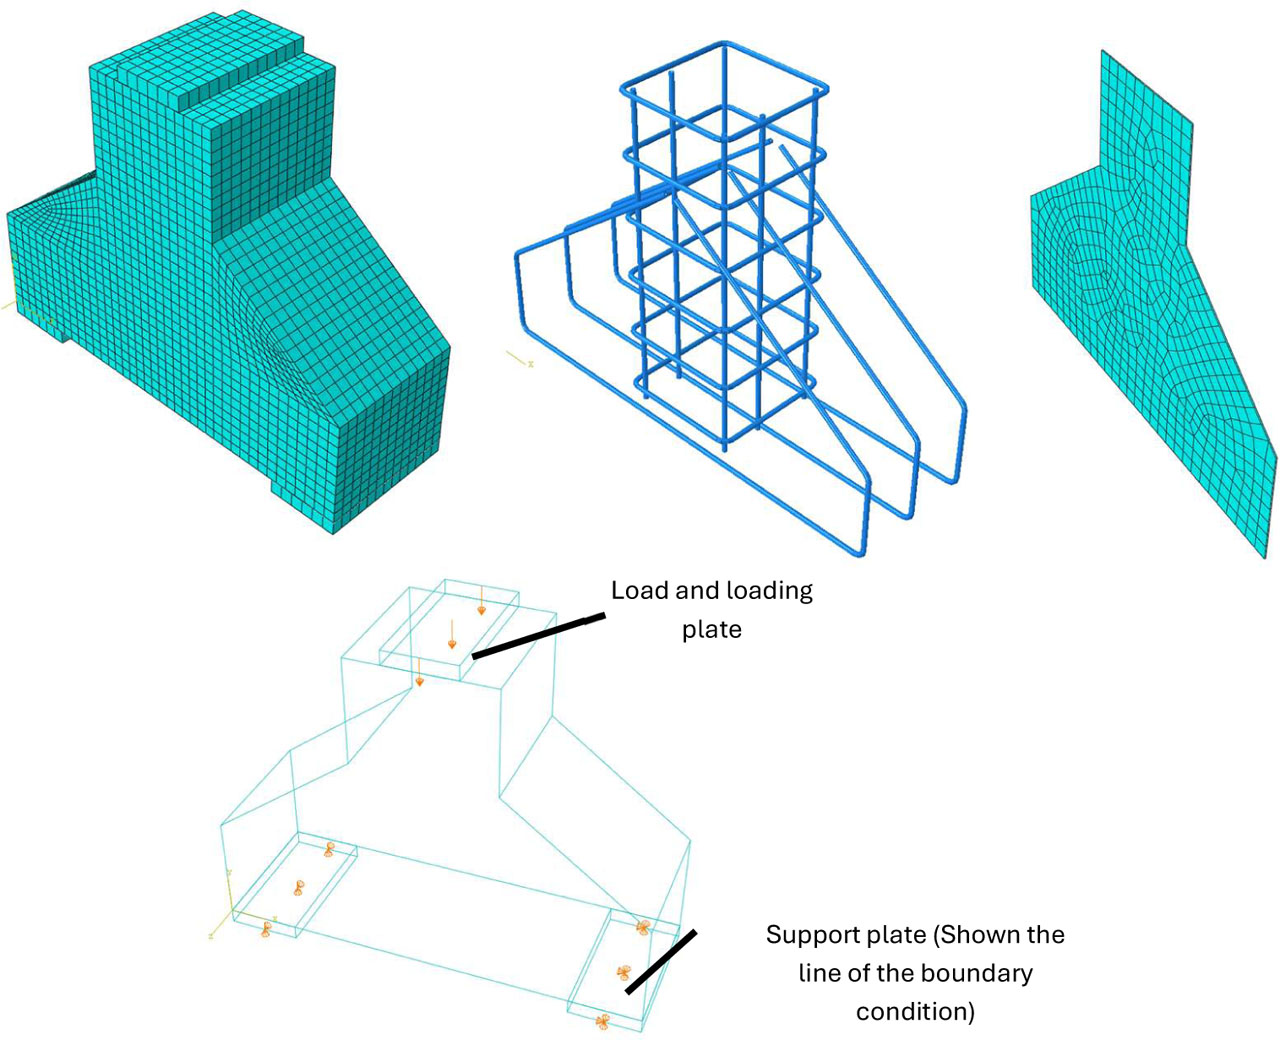
Figure 12:
The geometry of the finite element model, the assembly of the concrete, reinforcement, and strengthening components, the boundary conditions, and the mesh for a representative strengthened specimen
3.2. Material Models
The concrete was represented using the concrete damaged plasticity (CDP) model, which accounts for the different behaviour of concrete in tension and compression, including cracking and crushing, and the degradation of stiffness with damage. The yield function of the model follows the formulation of Lubliner et al. (Lubliner et al., 1989) as modified by Lee and Fenves(Jeeho & L, 1998). The CDP parameters were taken as: flow potential eccentricity e = 0.1, ratio of biaxial to uniaxial compressive strength σb0/σc0 = 1.16, invariant stress ratio Kc = 0.667, viscosity parameter μ = 1 × 10⁻⁵, and dilation angle ψ = 35°. The uniaxial compressive stress-strain relationship was defined using the Hognestad parabolic curve up to the peak stress, followed by a linear softening branch:
Where:
fc′ - the measured mean cylinder compressive strength 34.8MPa,
ɛ0 is the strain at peak stress,
ɛcu is the ultimate compressive strain.
The modulus of elasticity was taken as and Poisson’s ratio as 0.2. The tensile behaviour was defined by a linear elastic branch up to the tensile strength, followed by exponential tension softening, with the tensile strength estimated as .
The reinforcing steel and the steel plates were modelled as elastoplastic materials with linear strain hardening, defined by the mean measured yield strength, ultimate strength, and modulus of elasticity from the material tests (Tables 2 and 3), with Poisson’s ratio of 0.3 and a hardening slope defined up to the ultimate strain.
The CFRP fabric was modelled as a linear-elastic orthotropic material up to damage initiation. The Hashin criterion for unidirectional fibre composites (Hashin, 1980) defines four potential damage-initiation modes: fibre tension, fibre compression, matrix tension, and matrix compression. In the present analysis, only the fibre-tension damage mode was activated. Parlamis et al. (Parlamis et al., 2026) recently compared Hashin- and Puck-based predictions with experimental results for pin-loaded composite plates under cyclic fatigue (This is a recent application of Hashin-based modelling, but it is not a direct validation of the present monotonic corbel model).
Where:
and – the effective stress components along the fibre and transverse directions,
is the effective transverse shear stress,
XT and XC are the tensile and compressive strengths in the fiber direction,
YT is the tensile strength in the transverse direction, and SL is the longitudinal shear strength.
The fibre-direction tensile strength was taken from the manufacturer’s data sheet (4000 MPa for the fibre). Given the observed failure mode of the CFRP-strengthened specimens, which occurred by rupture of the fabric, only the fibre tension damage mechanism was activated in the analysis.
3.3. Boundary Conditions and Loading
The analysis was performed in a static general step. The bottom surface of the corbel was modelled as simply supported on two supporting plates, and the load was applied in a displacement-controlled manner through a reference point coupled to the bearing area at the top surface of the column. Displacement control was adopted to allow the analysis to continue beyond the peak load and to capture the post-peak response and the failure mode.
3.4. Mesh and Mesh Convergence Study
A mesh sensitivity study was carried out to select an appropriate element size for the concrete. Starting from a coarse mesh generated using the approximate global size option in ABAQUS (40 mm), the mesh was refined to 10 mm. Refining the mesh from 40 mm to 10 mm changed the predicted ultimate load by 9%, while further refinement only increased the computational time with a negligible change in the predicted response. Accordingly, a global element size of 10 mm was adopted for the concrete. In the triangular knee region of the corbel, where the diagonal concrete strut and the failure zone develop, the mesh was locally refined beyond the global size to capture the crack propagation and the failure pattern accurately. The mesh densities of the contacting surfaces were assigned such that the strengthening element (secondary) surface was more finely meshed than the concrete (primary) surface, as required by the surface-to-surface contact formulation. Figure 12 shows the mesh of a representative model, including the locally refined knee region.
3.5. Ultimate Load Estimation
The ultimate loads obtained from the finite element models are presented in Table 10 and compared with the experimental results. The numerical model reproduced the ultimate load with good accuracy, with absolute errors ranging from approximately 0.8% to 8.8%. The maximum difference was obtained for specimen A2, for which the FE model predicted 391.5 kN compared with the experimental value of 360 kN, corresponding to an overprediction of approximately 8.8%. The average absolute error for all specimens was approximately 4.5%, indicating good agreement between the numerical and experimental ultimate-load results.
Table 10:
Experimental and FE model ultimate load values
| Corbel ID | PU [kN] | PUFE [kN] | PU – PUFE [kN] | |
|---|---|---|---|---|
| C0 | 331 | 316.2 | −4 | −14.8 |
| A1 | 470 | 502.5 | 7 | 32.5 |
| A2 | 360 | 391.5 | 9 | 31.5 |
| C1 | 408 | 404.1 | −1 | −3.9 |
| C2 | 401 | 404.3 | 1 | 3.3 |
| D1 | 480 | 498.9 | 4 | 18.9 |
| E1 | 405 | 435.3 | 7 | 30.3 |
| G1 | 550 | 570.0 | 4 | 20.0 |
Load Displacement Behaviour
Perfect agreement between the experimental and finite element load-displacement responses is not expected, particularly when the measured displacements are very small. In experimental tests, minor support movements, loading-system compliance, and measurement uncertainty may affect the recorded displacement and influence the apparent stiffness of the specimen. In addition, the finite element model represents the actual material and test setup through idealized assumptions, whereas the experimental specimens include material variability, construction imperfections, cracking, bond effects, and localized damage.
Figures 13 to 19 compare the finite element load-displacement curves with the experimental curves, shown using dashed lines. In general, the numerical models reproduced the overall behaviour of the tested corbels, including the initial loading stage, the nonlinear response, and the progression toward failure. However, some differences were observed in the initial stiffness and the displacement at the ultimate load. The experimental and numerical displacement values corresponding to the ultimate load are summarized in Table 11. Although the percentage differences may appear relatively high, the corresponding absolute differences in displacement are small because the measured displacement values are themselves limited. Therefore, the comparison should consider both the percentage difference and the absolute difference in millimetres.
Table 11:
Experimental and FE model ultimate load displacement
| Corbel ID | ∆U [mm] | ∆UFE [mm] | ∆UFE − ∆U [mm] | |
|---|---|---|---|---|
| C0 | 0.70 | 0.84 | 20 | 0.142 |
| A1 | 0.70 | 1.24 | 77 | 0.541 |
| A2 | 0.62 | 0.50 | −19 | −0.120 |
| C1 | 1.08 | 1.49 | 38 | 0.406 |
| C2 | 1.10 | 1.50 | 36 | 0.396 |
| D1 | 1.28 | 1.15 | −11 | −0.134 |
| E1 | 0.76 | 0.86 | 13 | 0.101 |
| G1 | 1.30 | 1.68 | 29 | 0.380 |
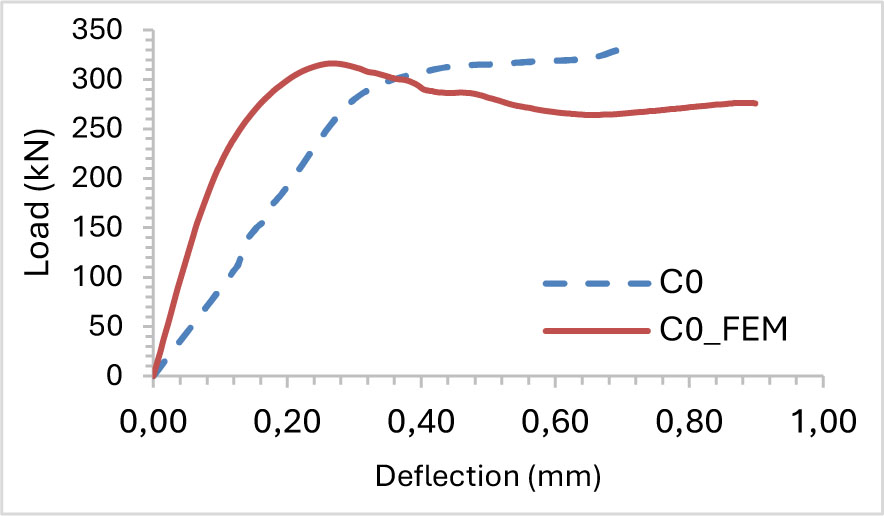
Figure 13:
Experimental and FE load displacement curve for spacemen C0 (control corbel)
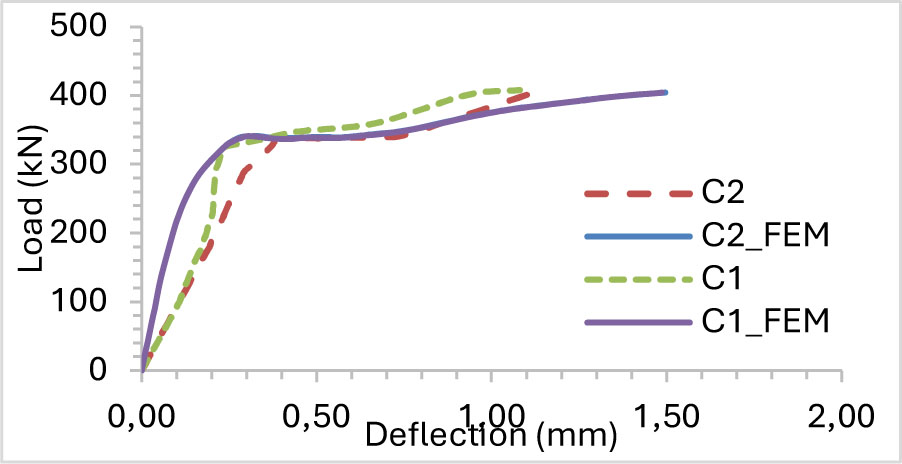
Figure 14:
Experimental and FE load displacement curve for spacemen C1 and C2
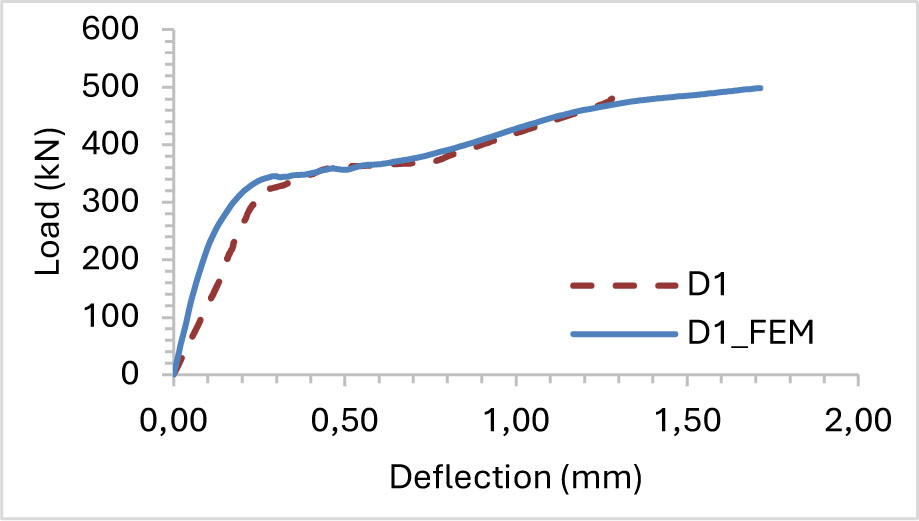
Figure 15:
Experimental and FE load displacement curve for spacemen D1
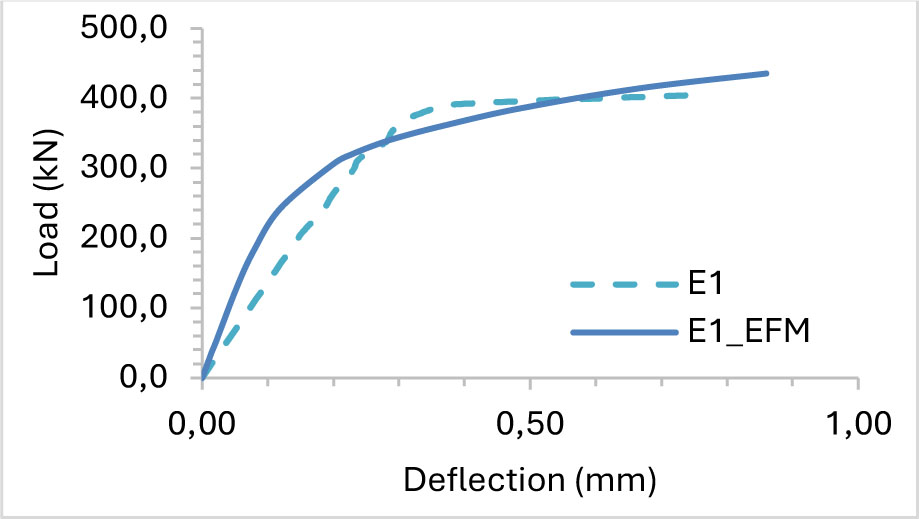
Figure 16:
Experimental and FE load displacement curve for spacemen E1
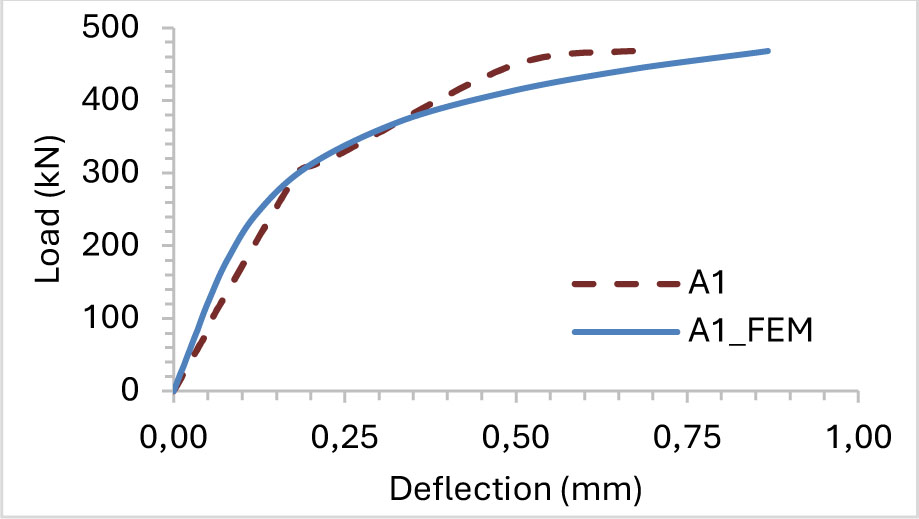
Figure 17:
Experimental and FE load displacement curve for spacemen A1
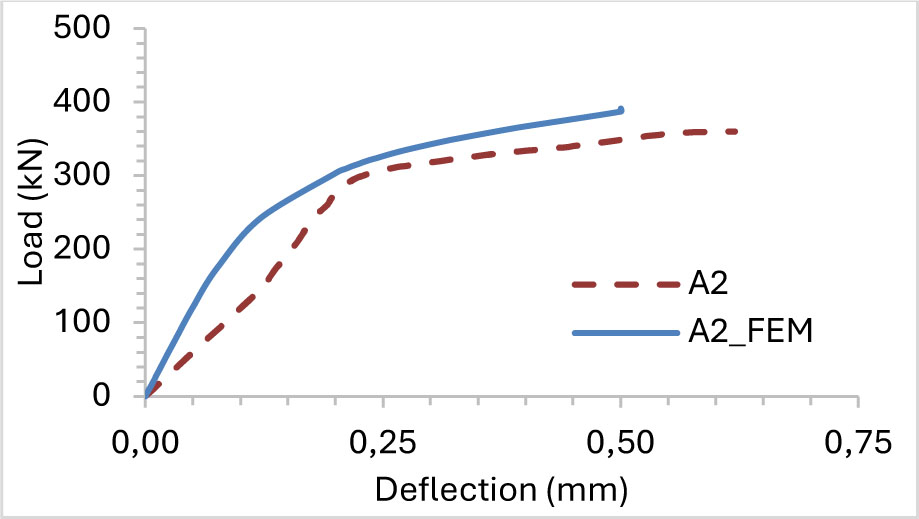
Figure 18:
Experimental and FE load displacement curve for spacemen A2
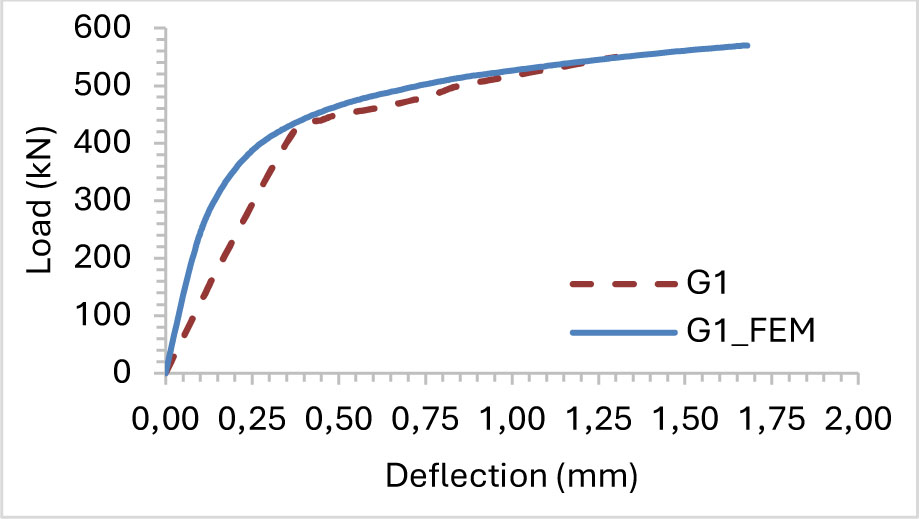
Figure 19:
Experimental and FE load displacement curve for spacemen G1
FE Energy Absorption (Area Under the Curve)
Table 12 compares the areas under the experimental and finite element load-displacement curves. The FE model overpredicted the absorbed energy for most of the specimens investigated. The predicted values were higher than the experimental values by approximately 42%, 31%, 48%, 57%, 53%, 22%, and 48% for C0, A1, C1, C2, D1, E1, and G1, respectively. The only underprediction was obtained for A2, for which the FE value was approximately 13% lower than the experimental value. The largest difference was observed for C2, while the closest agreement was obtained for A2.
Despite the differences in magnitude, the finite element model reproduced the main trend of the experimental results. G1 and D1 were identified as the two configurations with the highest absorbed energy in both analyses, while A2 produced the lowest value. The remaining differences may be attributed to the idealized support conditions, uniform material properties, simplified interface behaviour, and the difficulty of reproducing the experimental cracking, debonding, and post-peak response. Since the absorbed energy is calculated from the complete load-displacement curve, differences in the predicted failure displacement and descending branch have a direct influence on the calculated area.
Table 12:
The experimental and FE area under the curve value
| Corbel ID | AEx [kN.mm] | AFE [kN.mm] | |
|---|---|---|---|
| C0 | 166.01 | 236 | 42 |
| A1 | 238.97 | 313 | 31 |
| A2 | 165.35 | 144 | −13 |
| C1 | 340.14 | 505 | 48 |
| C2 | 323.83 | 510 | 57 |
| D1 | 440.70 | 673 | 53 |
| E1 | 239.28 | 293 | 22 |
| G1 | 537.67 | 794 | 48 |
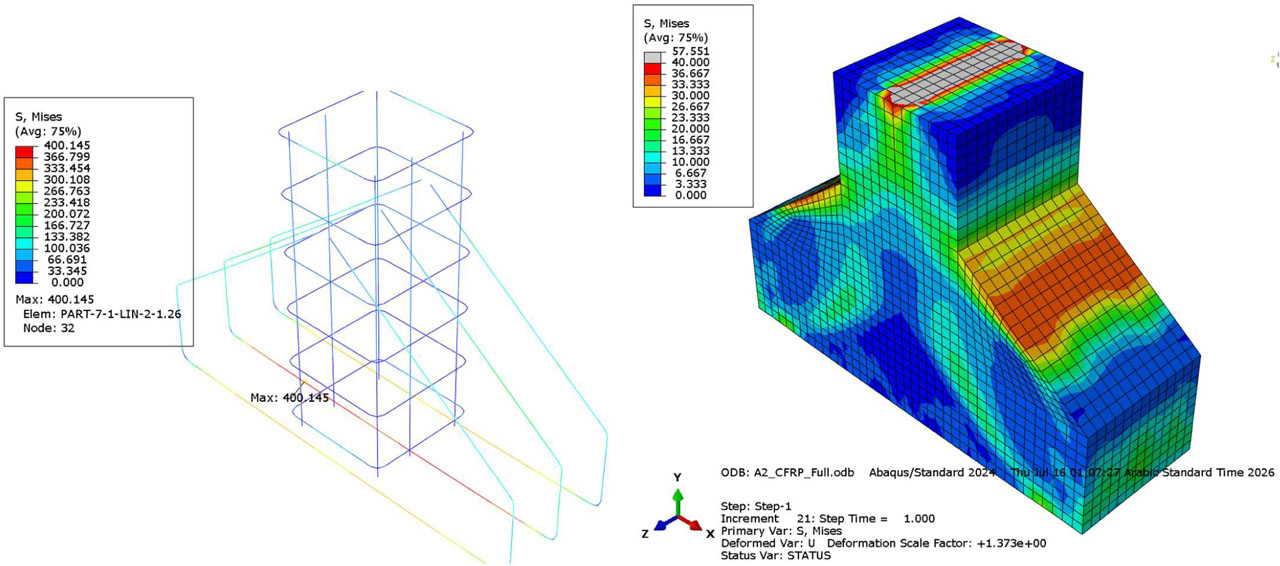
Figure 20:
Full CFRP S, Mises stress in (a) the reinforcement bar, (b) in the corbel concrete part
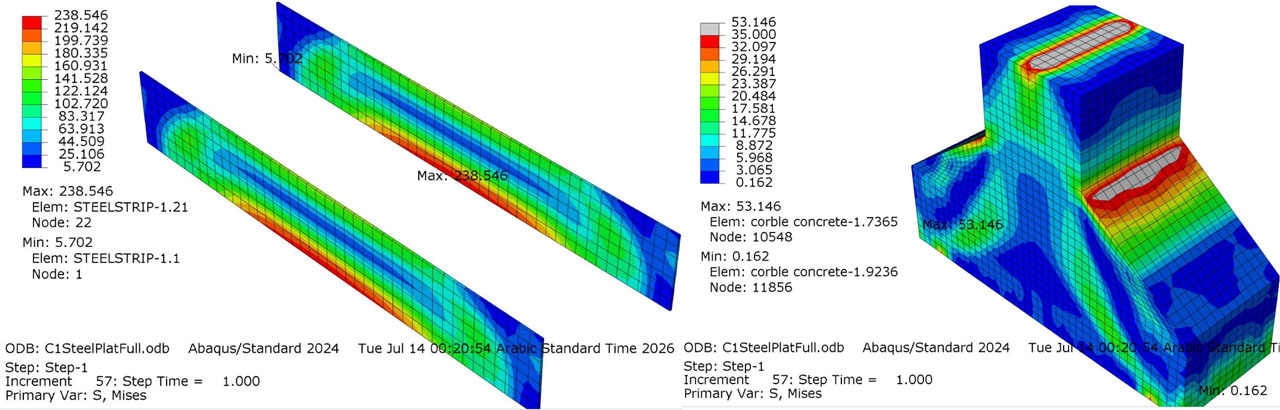
Figure 21:
Steel plate strip S, Mises stress in (a) the steel strip, (b) in the corbel concrete part
4. Conclusion
The experimental program showed that the strengthening method had a significant influence on the load-displacement response, ductility, failure mode, and energy absorption of the reinforced concrete corbels. The differences were governed not only by the strength of the strengthening material, but also by its continuity, anchorage, bond behaviour, and ability to redistribute stresses after cracking.
The corbel strengthened with full 3 mm-thick steel plates on both sides achieved the highest increase in displacement ductility, approximately 70% compared with the control specimen. This improvement was attributed to the continuous nature of the steel plates, which provided effective crack bridging, confinement, and stress redistribution along the corbel.
The specimen strengthened with a 20 mm-thick layer of Sika Mono-Top 612 achieved the second-highest increase in displacement ductility, approximately 53%. This strengthening system also exhibited the highest energy absorption, with an area under the load-displacement curve of 538 compared with 166 for the control specimen, corresponding to an increase of approximately 224%.
The full steel plate specimen produced the second highest absorbed energy, with an area of 441 and an increase of approximately 166% relative to the control specimen. Therefore, the full steel plate was the most effective configuration in terms of displacement ductility, while the Sika Mono-Top 612 layer was the most effective configuration in terms of total energy absorption.
The full steel strip and two-sided steel strip configurations produced absorbed-energy areas of 340 and 324, corresponding to increases of approximately 105% and 95%, respectively. Although these configurations improved the response compared with the control specimen, their performance was lower than that of the full steel plate because the strips provided a less continuous load-transfer mechanism.
The steel-strip strengthening was affected by premature debonding. The finite element results showed that the maximum stress in the steel strip reached approximately 70% of its yield strength, indicating that the strip did not fully yield before the interface failure occurred. Consequently, the potential plastic deformation and post-peak energy dissipation of the steel strip were not fully developed.
The full CFRP and CFRP plate-strip configurations both produced an absorbed-energy area of 239, representing an increase of approximately 44% relative to the control specimen. In contrast, the two-sided CFRP configuration produced an area of 165, which was approximately 1% lower than the control. These results show that CFRP strengthening did not provide the same energy absorption for all configurations, and its effectiveness depended strongly on the strengthening arrangement and bond behaviour.
The comparison between ductility and absorbed energy demonstrated that these parameters describe different aspects of structural performance. The full steel plate provided the highest displacement ductility, whereas the Sika Mono-Top 612 layer produced the highest area under the load-displacement curve. Therefore, the selection of a strengthening method should consider both deformation capacity and energy absorption rather than ultimate load alone.
The finite element models reproduced the general load-displacement behaviour of the tested corbels, including the initial response, nonlinear loading stage, and progression toward failure. Differences were observed in the initial stiffness and displacement at ultimate load. These differences were attributed to measurement uncertainty at small displacement levels, minor support movement, experimental compliance, material variability, and the simplifying assumptions adopted in the numerical model.
The finite element models showed moderate agreement with the experimental absorbed-energy results, with an average absolute difference of approximately 39%. Although the numerical model did not reproduce all area values exactly, it successfully predicted the general performance trend and identified the most and least effective strengthening configurations.
Acknowledgements
The authors would like to express their sincere gratitude to Mr. Ahmed Mahdi, Lecturer at the University of Thi-Qar, for his valuable assistance, technical support, and constructive suggestions throughout the course of this research. His contributions and support are greatly appreciated.
Notes
[7] Contributed by Author Contributions
D.A. conducted the experimental investigation and collected the data. M.K. contributed to the research methodology, experimental investigation, and data analysis. M.F. contributed to the study's conceptualization, research methodology, technical supervision, interpretation of results, and manuscript review and editing. H.K. contributed to the study conceptualization, research supervision, formal analysis, interpretation of findings, manuscript draft, and editing, and correspondence with the journal. All authors critically reviewed and approved the final version of the manuscript and agreed to be accountable for all aspects of the work.