

1. Introduction
The pavement's response to long-term traffic loads is related to the structural interaction between adjacent asphalt layers. The system behaves monolithic, efficiently distributing stresses when interlayer bonding is adequate, whereas insufficient bonding may accelerate the appearance of distresses related to asphalt concrete pavement such as slippage cracking, delamination, and rutting, potentially reducing pavement service life by approximately 40% or more (Chen et al., 2022; Guo et al., 2025; Jia & Huang, 2022; Yang & Li, 2021). In addition, stress distribution, pavement deflection behavior under loads and strain development are directly affected by interlayer bonding between asphalt concrete layers (Yang et al., 2020).
The rate of tack coat application is considered one of the primary factors governing interlayer shear resistance. Insufficient tack coat application may result in poor adhesion and premature pavement failure, whereas excessive tack coat may create a lubricating slippage plane that reduces adhesion and aggregate interlocking resistance (Bahia et al., 2019). Interlayer shear tests are among the most widely adopted methods for assessing the bonding performance between asphalt layers because they provide a practical representation of stress transfer mechanisms occurring at pavement interfaces. Previous studies investigated the influence of tack coat type, application rate, interface condition, temperature, and loading level on interface strength. (Biglari et al., 2019) employed the layer-parallel direct shear (LPDS) apparatus to assess the impact of bonding materials and temperature on interlayer shear strength, while (Ali et al., 2023) employed a custom device to explore how tack coat type, application rate, and differences between laboratory and field conditions affect interface behavior.
There are many conventional approaches aimed to mitigate pavement cracking, including: increasing overlay thickness (Bianchini et al., 2018), improving asphalt mixture composition (Karki et al., 2022), and incorporating geosynthetic interlayers within pavement systems (Canestrari et al., 2022; N. S. Correia & Zornberg, 2016). Among these techniques, geotextile interlayers are considered one of the more economical reinforcement approaches (Ameri et al., 2013; Pasetto et al., 2019). Previous studies demonstrated that proper impregnation of geotextile interlayers with tack coat significantly improves waterproofing performance by substantially reducing permeability and preventing water flow through the reinforced system (N. de S. Correia & Bueno, 2011; Solatiyan et al., 2020).
Despite the advantages associated with geotextile interlayers, their influence on interlayer bonding performance remains complex and not fully understood. Previous investigations indicated that incorporating geotextile materials may reduce bonding performance to some extent (Sudarsanan, Karpurapu, et al., 2018). Interface behavior and bond strength are influenced by several interacting factors, including tack coat condition, geosynthetic type, application rate, impregnation characteristics, surface texture, temperature, and reinforcement properties such as geotextile thickness and weight (N. S. Correia et al., 2023; Lee et al., 2020; Silva et al., 2024; Wang et al., 2021). In addition, proper impregnation of geotextiles with asphalt binder may improve tensile strength, fatigue resistance, and stiffness of asphalt mixtures (Rezende et al., 2020). These findings suggest that improving the behavior of the interlayer does not necessarily correspond to improved pavement performance, as geotextile interlayers may alter tack coat distribution and therefore affect bonding and rutting resistance. Nevertheless, the overall relationship between bonding performance and pavement behavior remains insufficiently clarified (Delbono & Giudice, 2014; Sudarsanan, Mohapatra, et al., 2018).
The effectiveness of geotextile interlayers in improving pavement performance, particularly reflective cracking and rutting resistance, has been widely reported. Regarding reflective cracking, evidence has been reported through both analytical and experimental approaches. Liu et al. (2018) evaluated Mirapave, a polypropylene nonwoven geotextile; TruPave, a nonwoven engineered paving mat; and PGM composite grids with fiberglass yarns (PGM-G50/50, PGM-G100/100, and PGM-G4) in Alaskan asphalt pavement systems. Using BISAR layered analysis for a 5 cm HMA surface, 10 cm base, 60 cm subbase, and subgrade, they found that all selected interlayers reduced the maximum tensile strain at the bottom of the HMA layer, with the reduction depending on interlayer type and stiffness. Experimental studies have provided further evidence regarding reflective-crack mitigation. Nejad et al. (2015) tested geosynthetic-reinforced asphalt beams simulating a cracked pavement with a 75 mm lower asphalt layer, a tack coat–geosynthetic interlayer, and asphalt overlays of 50, 75, and 100 mm. The materials included a PET nonwoven geotextile, PP nonwoven geotextiles, and PP–glass-fibre geocomposites. Under cyclic haversine loading at 20°C, the nonwoven geotextiles reduced the vertical crack growth rate and increased the number of cycles required for the crack to reach the overlay surface compared with unreinforced specimens. Similar findings were also reported for nonwoven polypropylene geotextiles. Zamora-Barraza et al. (2011) evaluated nonwoven polypropylene geotextiles in two-layer asphalt specimens consisting of 50 mm lower and upper asphalt layers, with a 40 mm cut in the lower layer to simulate an existing crack below the interlayer. Under repeated dynamic loading at 20°C, the polypropylene geotextiles increased the durability before reflective crack spread by about two to three times compared with the reference specimen.
Similarly, geotextile-reinforced asphalt mixtures exhibited increases in load-carrying capacity of up to 116%, while stiffness improved by approximately 25–31% (Menkash et al., 2024; Sarsam, 2025). A study by (Yin et al., 2022) reported that geotextile reinforcement reduced permanent deformation by 25.2% and improved stress distribution within pavement structures. However, several studies also reported reduced interface bonding after introducing reinforced interlayers, indicating that improved rutting resistance does not necessarily correspond to optimum interlayer bonding. Therefore, evaluating rutting resistance together with interlayer shear strength is essential for understanding pavement interface behavior.
Although numerous studies investigated the tack coat materials and geotextile on the pavement performance, limited attention has been directed toward the combined effect of application rate of tack coat and geotextile coverage condition on interlayer shear strength and rutting resistance. Moreover, the effectiveness of partial geotextile coverage remains insufficiently understood despite its potential to provide a more economical solution with acceptable bonding and mechanical performance. Therefore, this study evaluates the influence of different CSS-1h tack coat application rates and geotextile coverage conditions, including full coverage, partial coverage, and unreinforced interfaces, on the interlayer shear strength and rutting performance of double-layered asphalt concrete consisting of binder and wearing courses.
2. Materials
Two aggregate gradations are used to form the layers. penetration grade asphalt binder 40/50 and Portland cement as mineral filler used to produce samples. To bond layers tack coat have been used, also geotextile is used as paving fabric. All the characteristics of the materials used are acceptable in Iraqi State Corporation for Roads and Bridges SCRB/R9, 2003 and geotextile acceptable in (AASHTO M288-17, 2017; FHWA NHI-07-092, 2008) specifications.
2.1. Asphalt Binder
The asphalt binder type applied for the experiment has been sourced from Al-Dura refinery in the capital city of Iraq (Baghdad). An asphalt binder with a penetration grade of (40–50) was selected as it is widely employed in Iraq that suits regions experiencing high temperatures. The characteristics of asphalt binder are identical to the specifications SCRB/R9 based on a comprehensive series of physical tests are presented in Table 1.
Table 1:
Physical characteristics of asphalt binder
| Test | Test condition | ASTM Designation | Units | Test result | SCRB Specification Limits |
|---|---|---|---|---|---|
| Penetration | 100 [g], 25[ºC], 5 [sec] | D5 | 0.1 mm | 43.5 | 40–50 |
| Specific Gravity | 25 [ºC] | D-70 | [-] | 1.04 | _______ |
| Ductility | 25 [ºC], 5 [cm/min] | D-113 | cm | 140 | >100 |
| Flashpoint | _______ | D-92 | ºC | 295 | ≥232 |
| Softening Point (Ring & Ball) | 5 [ºC/min] | D-36 | ºC | 51 | _______ |
2.2. Aggregate
For this laboratory study, crushed aggregate obtained from the Al-Nibaie quarry was used. According to the Iraqi SCRB/R9 specification, dense-graded asphalt concrete is commonly used for wearing and binder courses in Hot Mix Asphalt (HMA) pavement construction in Iraq. Under this specification, Wearing Type IIIA and Binder Type II designate the aggregate gradation types adopted for the dense-graded asphalt concrete mixtures used in the wearing and binder courses, respectively. The nominal maximum aggregate sizes (NMAS) for the wearing and binder courses were 19 and 25 mm, respectively. The aggregate gradations for both courses were selected near the midpoint of the limits specified in SCRB/R9, as presented in Figure 1. The physical characteristics of the aggregate are listed in Table 2.
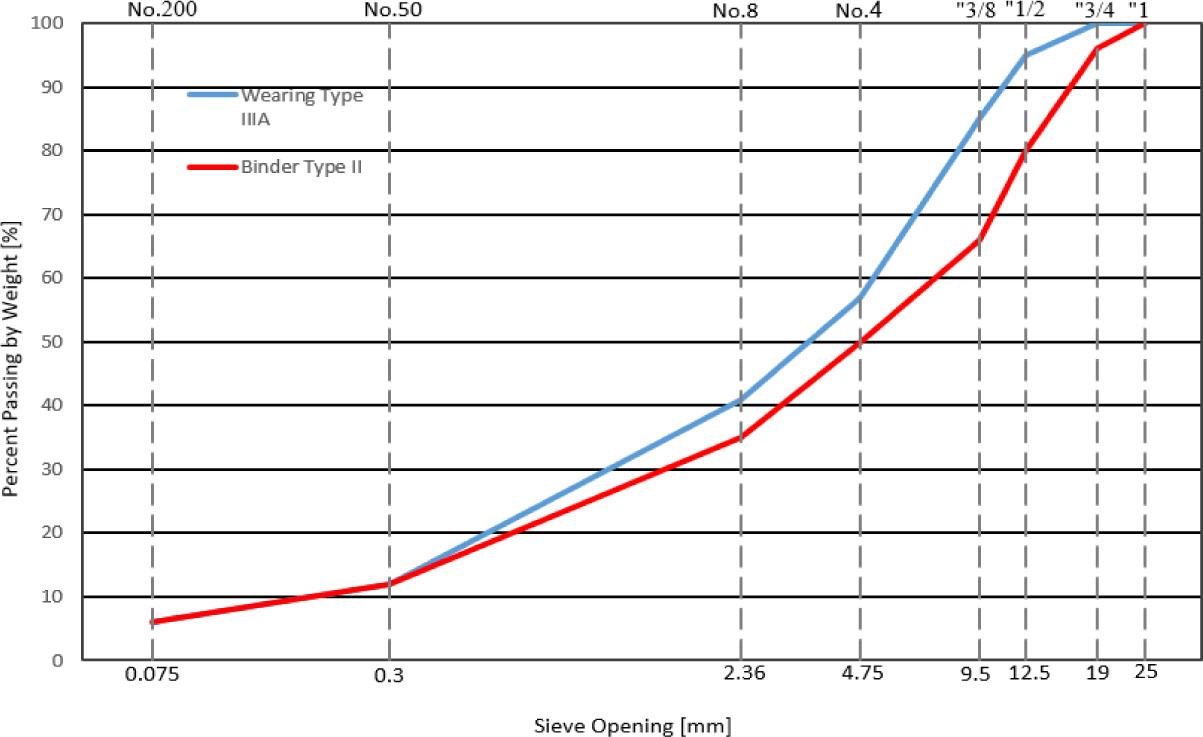
Figure 1:
Aggregate selected graduation
Table 2:
Physical Properties of aggregate
| Property | Units | Al-Nibaie aggregate | SCRB Properties limitations (2003) | ASTM standards | |
|---|---|---|---|---|---|
| Coarse Aggregate | Fine Aggregate | ||||
| Bulk specific gravity | [-] | 2.557 | 2.622 | N/A | (ASTMC127 and C128) |
| Apparent specific gravity | [-] | 2.604 | 2.679 | N/A | (ASTM C127 and C128) |
| Los Angles Abrasion | [%] | 19 | ---------- | Max. 30, Wearing, Max. 35, Binder | (ASTM C131) |
| Water absorption | [%] | 0.389 | 0.675 | N/A | (ASTM C127 and C128) |
| Sand equivalent | [%] | ----------- | 57 | Min. 45 | (AASHTO T176) |
2.3. Mineral Filler
Ordinary Portland Cement (OPC), produced locally from the Lafarge cement factory in Karbala, was used as a mineral filler in asphalt concrete mixtures. The mineral filler plays a key role in asphalt mixture performance, and a clearer understanding of their function contributes to improving pavement performance (Al-Tameemi et al., 2025). The physical characteristics of the mineral filler are shown in Table 3.
2.4. Tack coat
In this study, emulsified tack coat widely used in Iraq, namely, CSS-1h, were evaluated. Physical properties of emulsified are illustrated in Table 4.
Table 4:
Emulsified Asphalt Test Specifications Results
| Property | Units | Result | AASHTO M-208-2013 Limit | |
|---|---|---|---|---|
| Viscosity, Saybolt-Furol at 25 [◦C] | s | 54 | 20–100 | |
| Particle charge test | [-] | Positive | Positive | |
| Sieve test | [%] | 0.052 | Max 0.1 | |
| Distillation test | Oil distillate (by volume) | [%] | ---------- | ---------- |
| Residue | [%] | 60.1 | Min 57 | |
| Tests on residue from distillation | Penetration, 25 [◦C] | 0.1 mm | 45.3 | 40–90 |
| Ductility, 25 [◦C] | [cm] | 42 | Min 40 | |
| Solubility in trichloroethylene | [%] | 98.4 | Min 97.5 | |
2.5. Geotextile
As an interlayer between asphalt pavement courses geotextile material was integrated, to assess its impact on bonding behavior and structural response. Figure 2 illustrates the paving fabric used. Both AASHTO M288-17 and FHWA NHI-07-092 identify grab strength as the means of assessing the geosynthetic material as paving fabric and minimum required value is 450N. So, the selected geotextile has grab strength 750N, the mechanical, physical and hydraulic properties of the geotextile are exhibited in Table 5.
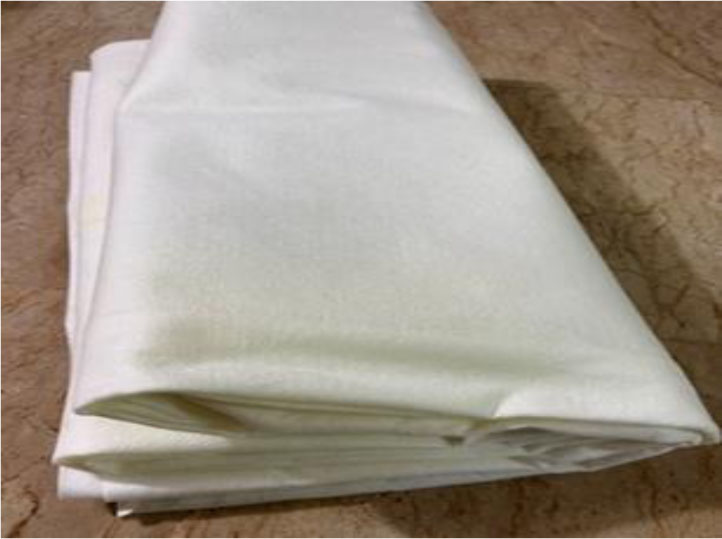
Figure 2:
Nonwoven Polypropylene Geotextile paving fabric used in this study
Table 5:
Geotextile reinforcement’s properties (as supplied by the manufacturer)
| Property | Test method | Units | Value |
|---|---|---|---|
| Mechanical properties | |||
| Grab Strength - MD | ASTM D 4632 | [N] | 750 |
| Grab Strength - CD | [N] | 750 | |
| Grab Elongation - MD | [%] | 40 | |
| Grab Elongation - CD | [%] | 55 | |
| Trapezoidal Tear strength - MD | ASTM D 4533 | [N] | 290 |
| Trapezoidal Tear Strength - CD | [N] | 290 | |
| Index Puncture Resistance | ASTM D 4833 | [N] | 320 |
| CBR Puncture Resistance | ASTM D 6241 | [kN] | 1.60 |
| UV Resistance after 500 h | ASTM D 4355 | [%] | 70 |
| Physical properties | |||
| Thickness under 2 kPa | ASTM D 5199 | [mm] | 1.40 |
| Weight | ASTM D 5261 | [g/m2] | 140 |
| Hydraulic properties | |||
| Permeability | ASTM D 4491 | [m/s] | 102 × 10−3 |
| Water Flow normal to the plane | ASTM D 4491 | [L/(m2.s)] | 102 |
| Apparent Opening Size | ASTM D 4751 | [mm] | 115 |
3. Mix Design and Production
Figure 3 presents the overall experimental procedure adopted in this study. Marshall tests were conducted in accordance with ASTM D6927 to find the optimum content of asphalt binder and volumetric properties of the HMA, Figure 4 presents the Marshall testing process. Thirty cylindrical specimens (4 in diameter × 2.5 in height) were prepared for both binder and surface layers. For each layer, five asphalt binder contents were evaluated (3.5, 4, 4.5, 5, 5.5) %, with three replicate specimens prepared and tested for each asphalt binder content. Therefore, fifteen specimens were prepared for each layer, and each data point presented in Figures 5 and 6 represents the average of three measured values. Based on the obtained results, the optimum amount of asphalt binder was determined at 4.5% for the binder layer and 4.9% for the surface layer.
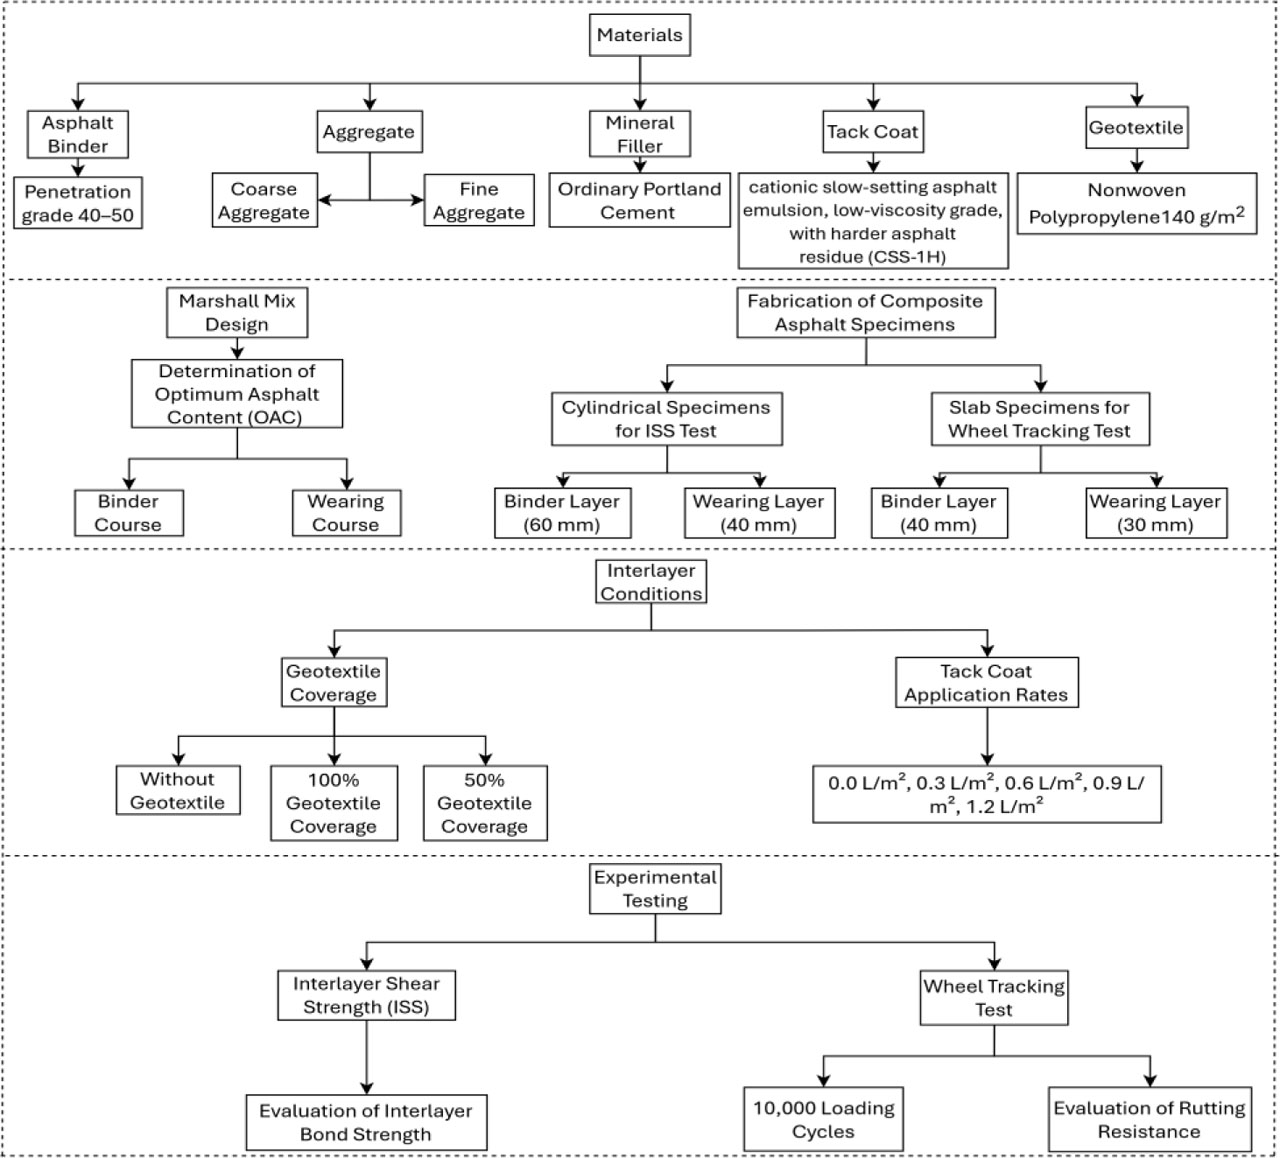
Figure 3:
Flow diagram of the experimental procedure
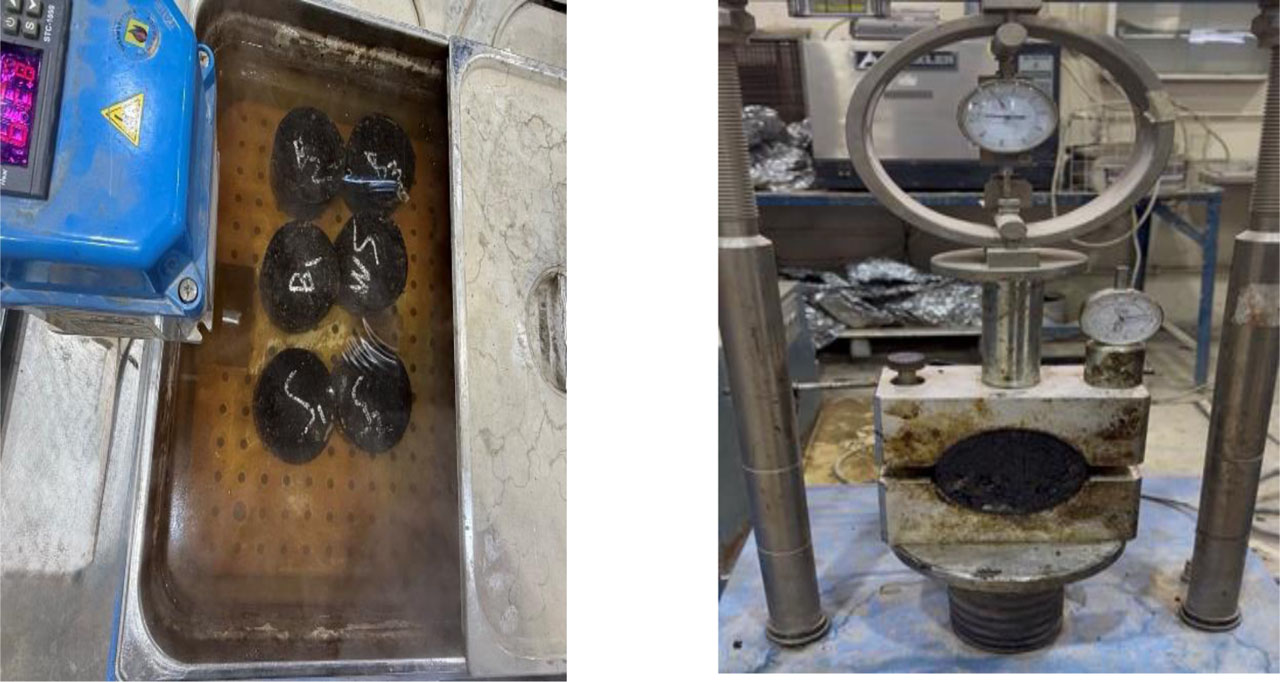
Figure 4:
Marshall specimens testing
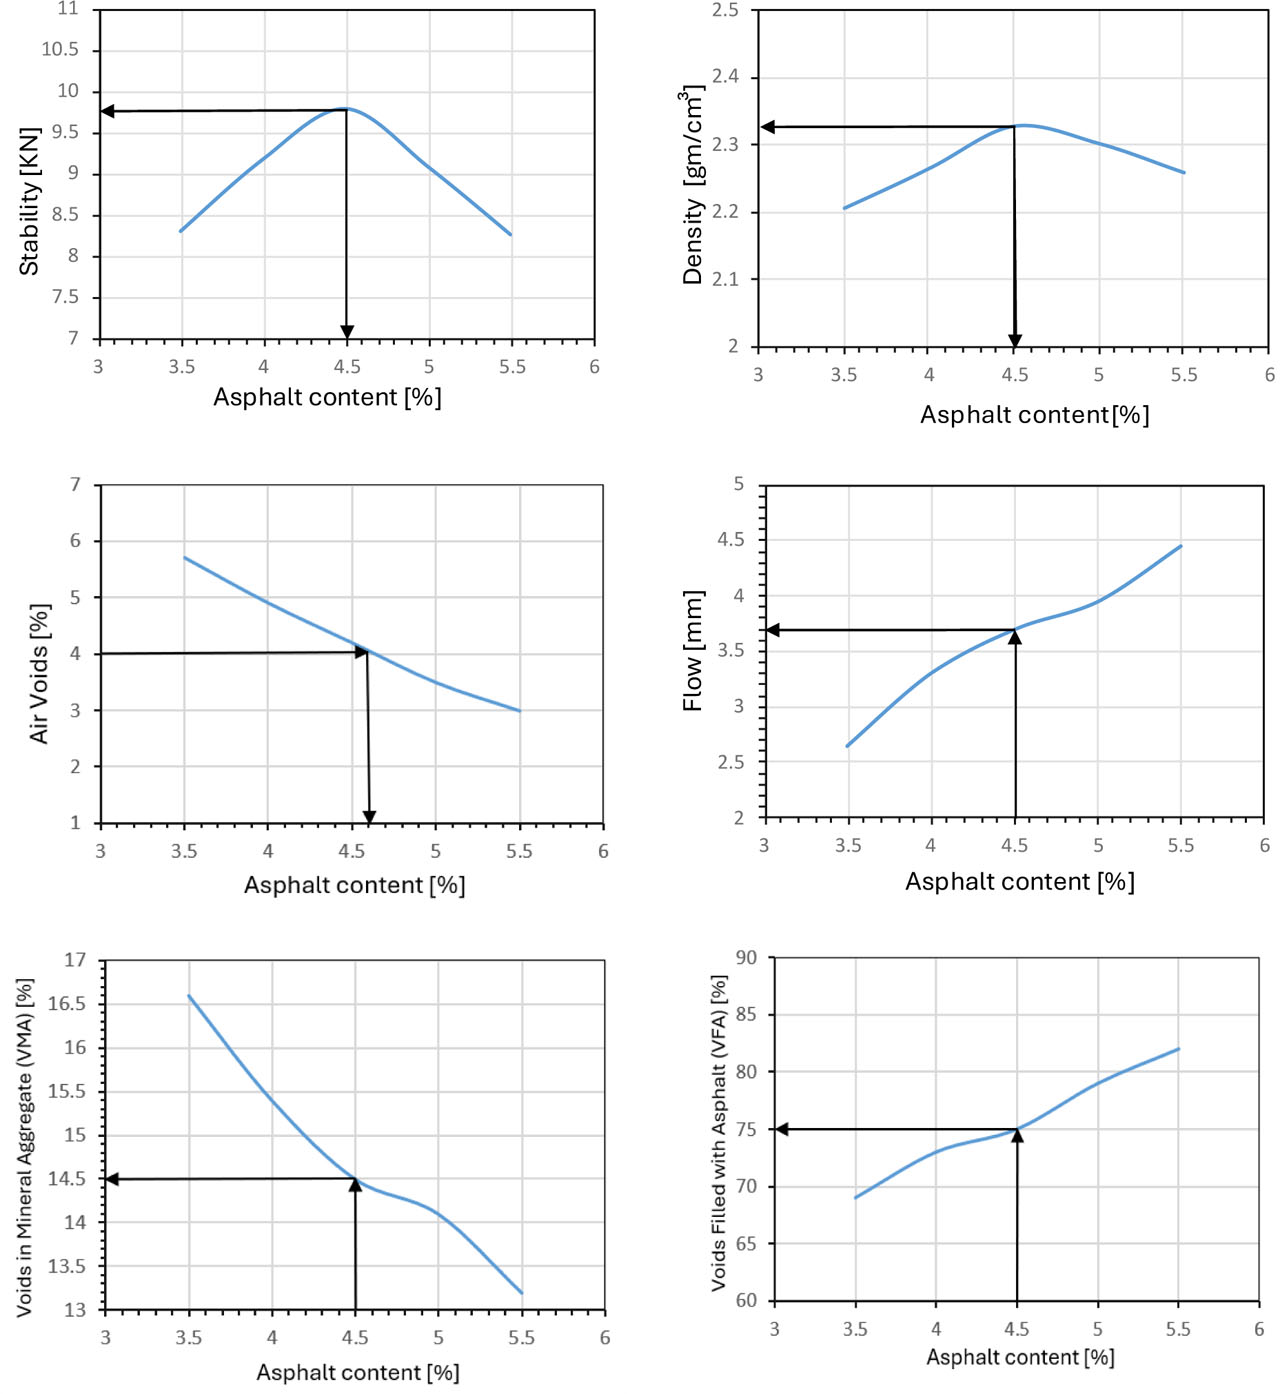
Figure 5:
Marshall outputs of Binder Layer
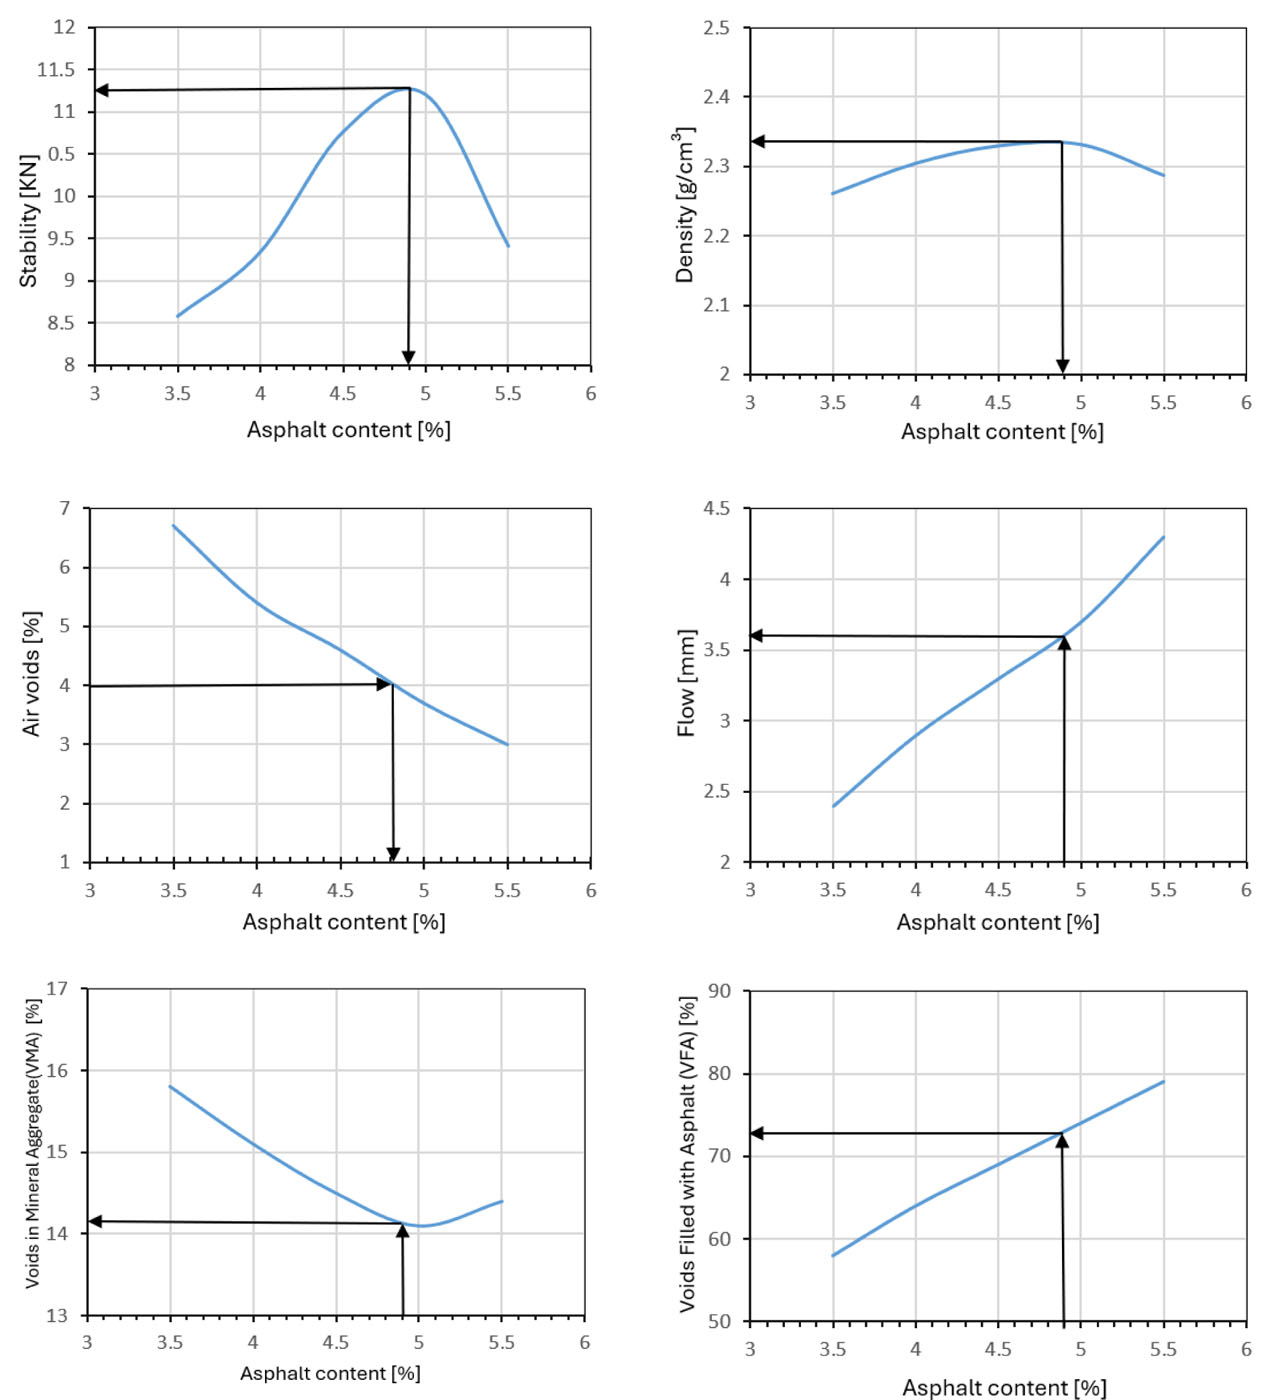
Figure 6:
Marshall outputs of Wearing Layer
4. Test samples Preparation
4.1. Preparation of double-layered samples
To estimate the bonding between asphalt concrete layers, laboratory-prepared specimens were fabricated according to Marshall specifications ASTM D6927 using aggregate gradation conforming to SCRB/R9. The specimens, prepared in a modified mold, with 101.6 mm diameter and 100 mm of total height. The height of the binder and wearing layers are 60 mm and 40 mm respectively. Tack coat emulsion and geotextile were applied at interface between the wearing and binder layers. The selected thickness of each layer was based on previous interlayer shear studies that used similar double-layer asphalt specimens for ISS evaluation (Panda et al., 2013; Giri and Panda, 2018; Kumar, 2024; Singh and Malhotra, 2018).
Specimens were categorized into three groups: a control group without geotextile, a group with 100% geotextile coverage, and a group with 50% geotextile coverage. Each group was tested at five CSS-1H application rates (0, 0.3, 0.6, 0.9, and 1.2 L/m2). This range was predefined and consistently applied to all three groups to ensure a balanced experimental design and enable direct comparison of their responses. Three replicate specimens were prepared and tested for each combination of interlayer condition and application rate, resulting in a total of 45 double-layered specimens across 15 experimental configurations. The results were reported as mean values, as shown in Table 6 and Figure 7, the specimens were prepared following the Marshall specimen preparation procedure and compacted using a Marshall hammer.
The lower layer was first compacted with 75 blows per face to achieve the required lower-layer thickness and density, and was left to cool in the mold for 24 h. On the following day, the CSS-1H emulsion was heated to 35 °C before application (Musselman et al., 2020). The tack coat was then applied at the required rate, followed immediately by geotextile placement in reinforced specimens. After complete breaking and curing of the emulsion, the upper layer could not be compacted from both faces because this could disturb the prepared tack coat/geotextile interface. Therefore, the upper layer was compacted from the top side only using 100 blows, which was selected based on preliminary compaction trials to achieve the required final thickness and adequate densification.
Table 6:
The process of specimens molding and compaction
| # | HMA Sample | Molding and Compaction Procedure (Layer Thickness [mm]) |
|---|---|---|
| 1 | Only tack coat (unreinforced) | 60 lower layer + tack coat + 40 upper layer = 100 total thickness |
| 2 | Tack coat and geotextile reinforced (100%) | 60 lower layer + tack coat +geotextile cover 100% of the surface area + 40 upper layer = 100 total thickness |
| 3 | Tack coat and geotextile reinforced (50%) | 60 lower layer + tack coat +geotextile cover 50% of the surface area + 40 upper layer = 100 total thickness |
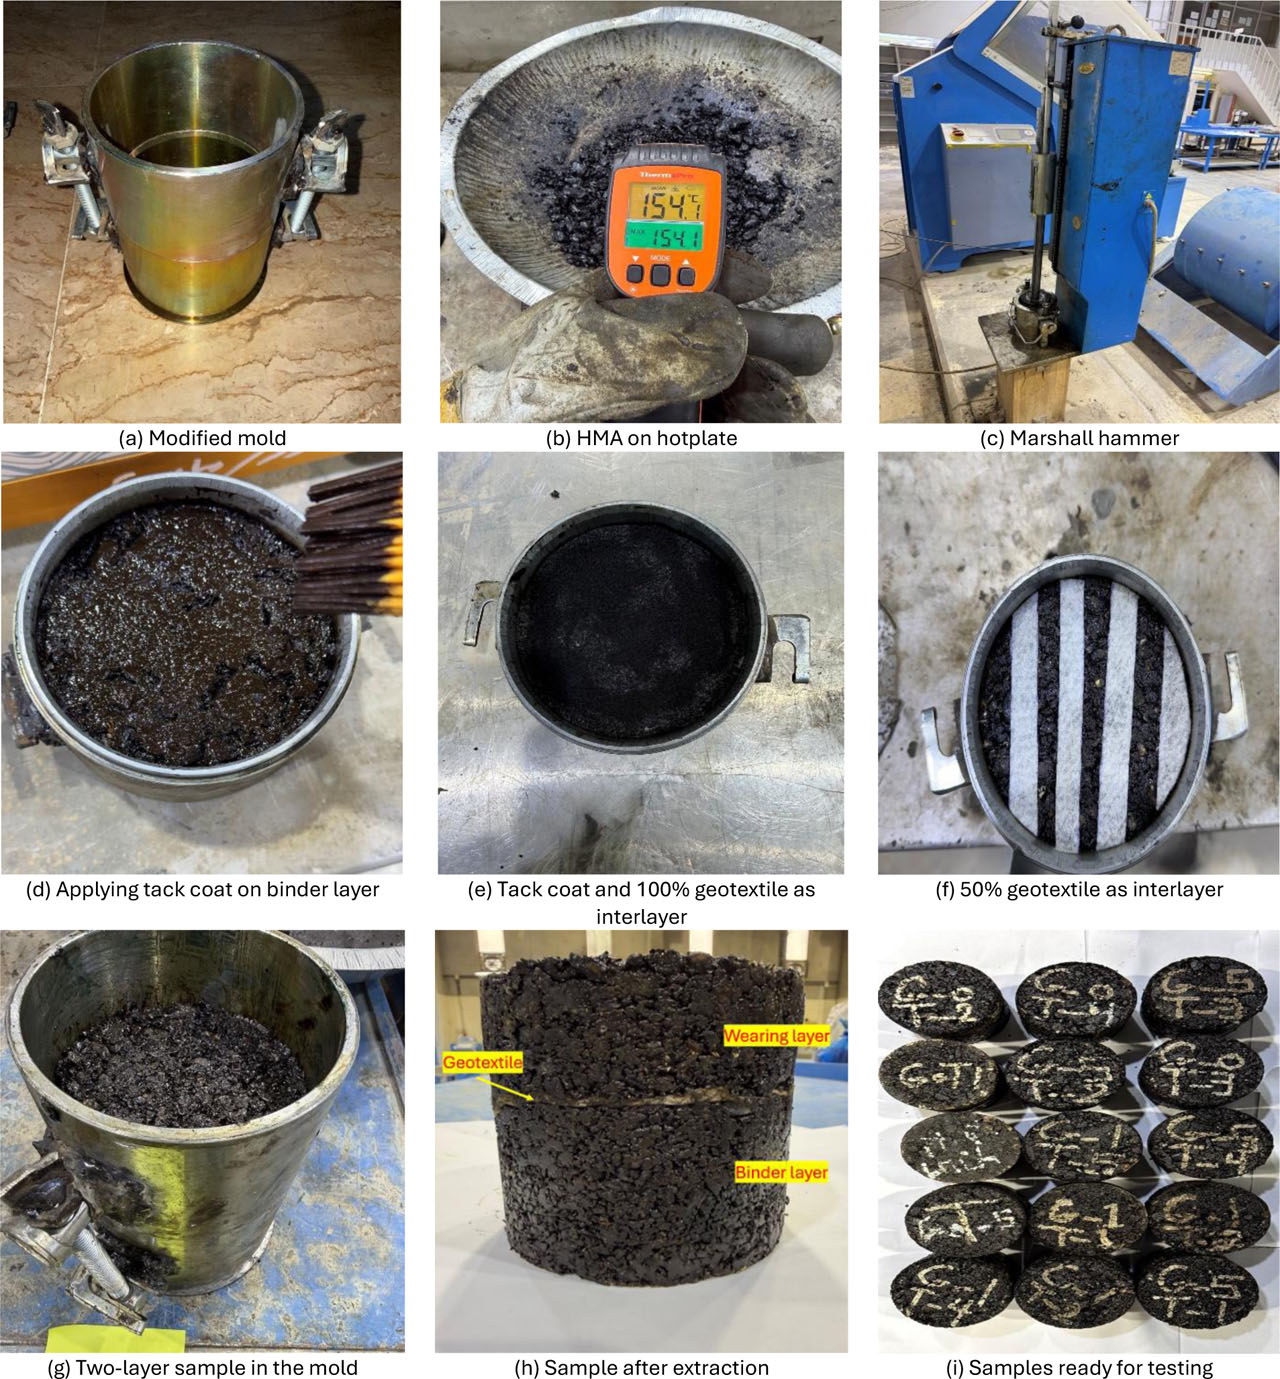
Figure 7:
preparation process of double-layered samples
4.2. Asphalt concrete slab samples preparation by roller compactor
HMA slab specimens for the wheel tracking test were prepared utilizing a Roller Compactor Device in accordance with EN 12697-33, built on the target bulk density and optimal asphalt binder content determined by the Marshall method. A predetermined mass of asphalt mixture was placed inside a rectangular steel mold measuring 305 × 400 × 100 mm (L × W × H). Compaction was achieved using a steel roller moving directly over the mixture surface under a constant vertical load of 5 kN to simulate field steel-wheel roller compaction.
The preparation started by heating the aggregate and asphalt binder to 170 °C and 150 °C, respectively. The materials were then mixed thoroughly on a hotplate to ensure uniform coating of the aggregate particles, followed by short-term aging to simulate production and placement conditions. Afterward, the asphalt concrete mixture was put into a preheated mold lined with paper, and the surface was carefully levelled before compaction.
A series of roller passes was applied to determine the number of cycles needed to accomplish the required layer thickness. After 63 compaction cycles, the binder layer reached the target thickness of 40 mm and was left inside the mold for 24 h to cool and ensure dimensional stability. The slab surface was then cleaned from loose particles before applying the CSS-1H tack coat and geotextile were applied according to the procedure and 15 experimental configurations described in Section 4.1.
To prepare the wearing layer, the same steps for preparing the binder layer were followed, except for the number of compaction cycles, which was 59 cycles to reach 30 mm thickness. Three replicate slabs were prepared and tested for each of the 15 experimental configurations, resulting in a total of 45 slab specimens. Figure 8 illustrates the process of slab preparation.
The slab layer thicknesses were selected to be compatible with the slab compactor and wheel tracking device, while maintaining the same slab geometry for all interlayer conditions. This allowed the effect of the interlayer system, including tack coat application rate and geotextile coverage, to be evaluated as the main variable affecting rutting performance under repeated wheel loading. The binder layer was kept thicker than the wearing layer to reflect the practical arrangement of asphalt pavement layers.
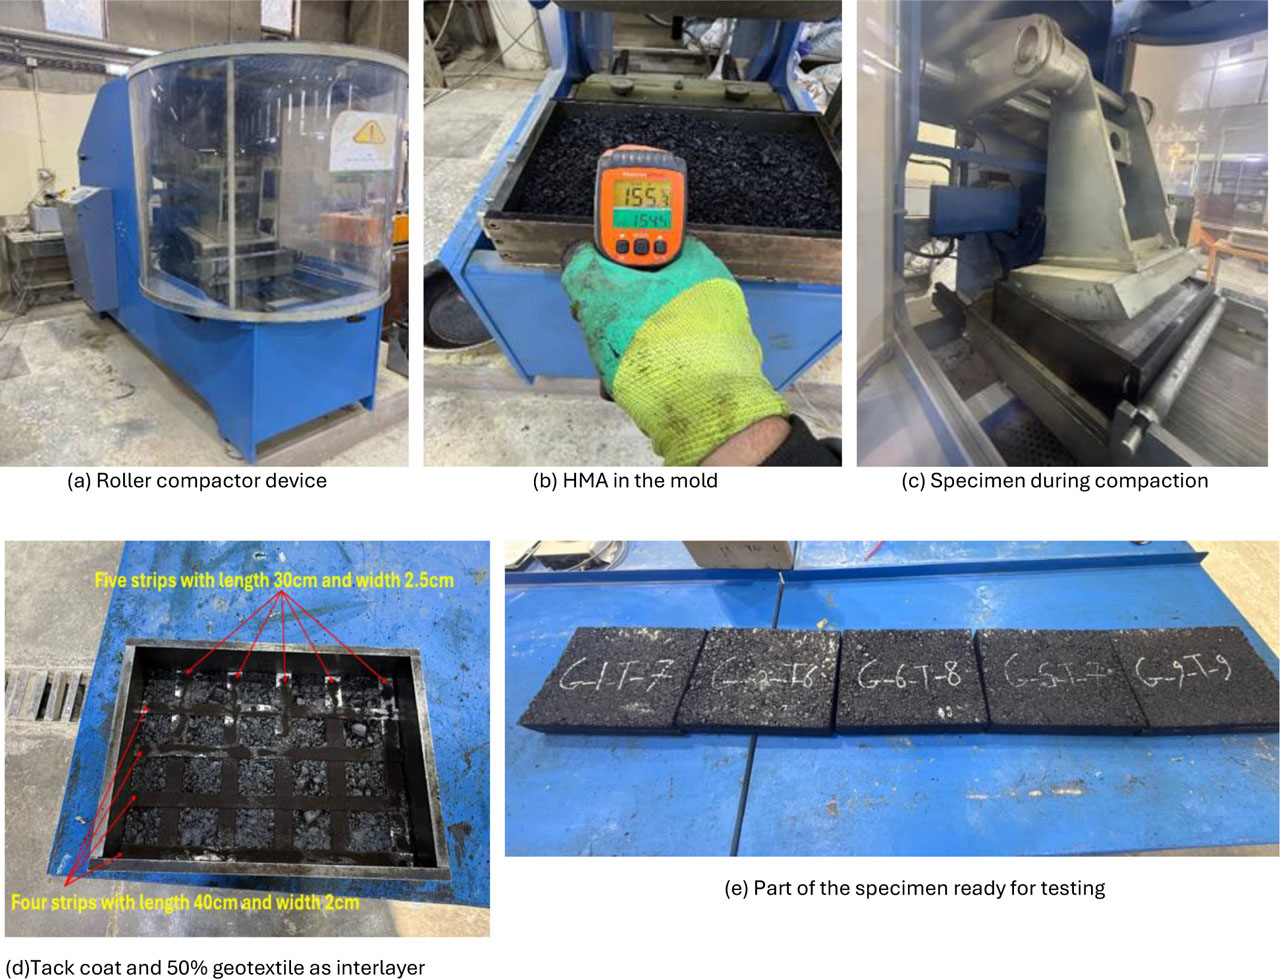
Figure 8:
preparation process of slabs
5. Experimental Tests
5.1. Direct Shear Bond Test
The direct shear bond test also known as interlayer shear strength test is a method for assessing the bond between asphalt concrete layers under loads and provides information on the maximum shear stress before failure at the interface between two layers. The experimental test was conducted following the procedure outlined in AASHTO TP 114-18, the testing apparatus consists of a stationary and a moving part, as shown in Figure 9, then placed inside a Marshall loading frame, the test is performed at a temperature of 20°C. The procedure begins by carefully placing the samples inside the shear apparatus so that the lower layer is in the stationary part and the upper layer is subjected to a shear loading at a uniform rate of 50.8 mm per minute. Based on previous research (West et al., 2005; Zaniewski et al., 2015), the gap width between the shear plates was 6.35mm. The figure 10 shows the test of specimens. To calculate interlayer shear strength, the ultimate applied load was assigned by the cross-sectional area of the samples, as follows:
Where:ISS = Interlayer shear strength [kPa],
Pmax = Ultimate load applied to specimen [kN],
A = Cross-sectional area of test specimen [m2].
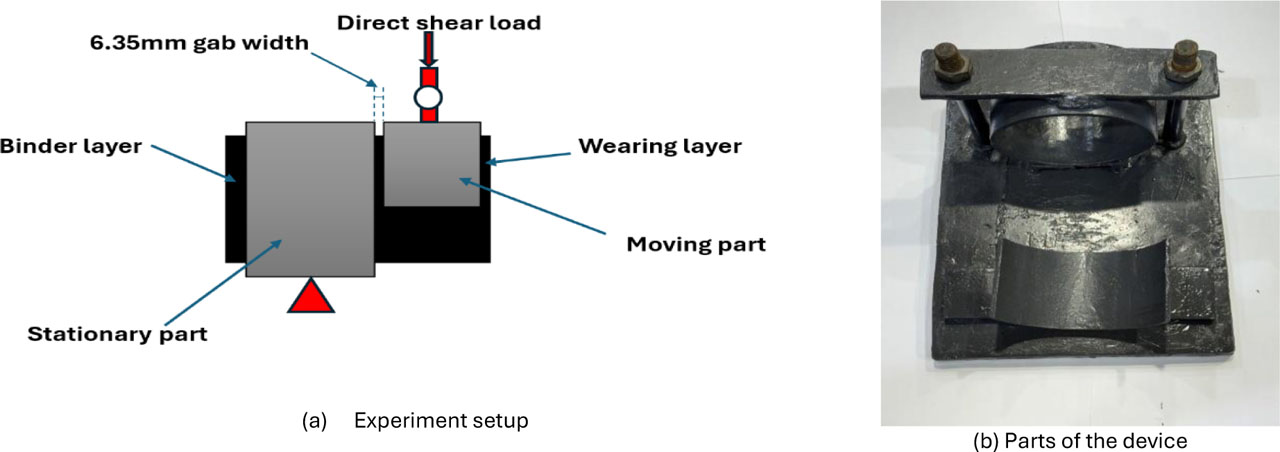
Figure 9:
Components of the interlayer shear strength testing apparatus
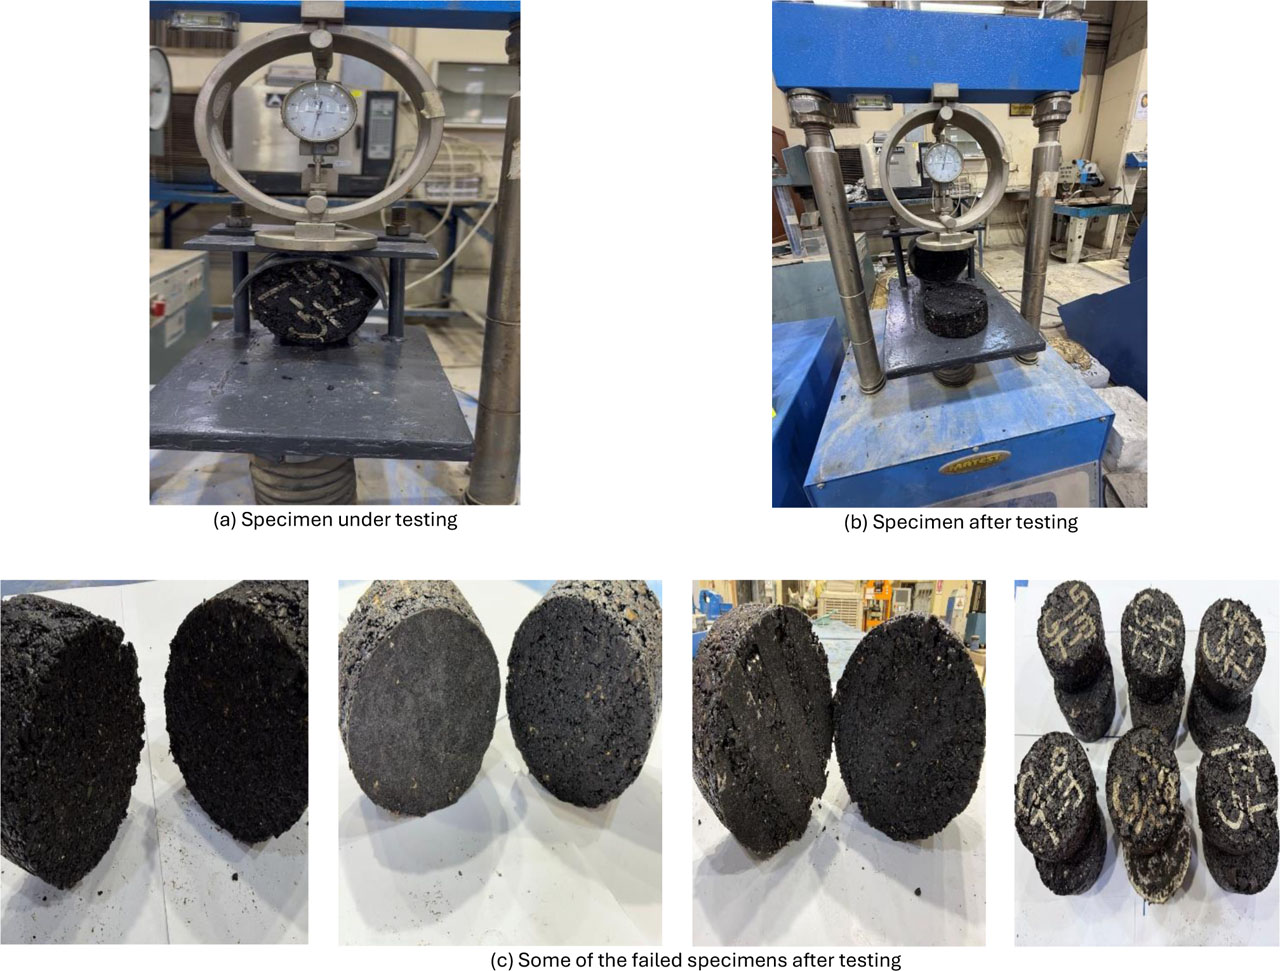
Figure 10:
ISS test specimens
5.2. Wheel Tracking Test
Rutting is one of the most significant problems and types of failure that appear in asphalt pavements. To study the effect of tack coat and geotextile between asphalt concrete layers, road conditions were simulated according to the standard specification AASHTO T 340–10 and EN 12697-22. This test provides information on the rutting depth resulting from a moving and concentrated load. The previously prepared slab with weight (19512gram) was placed inside the device on a moving base that rotated horizontally back and forth at a rate of (26 ± 1) cycle per minute, as shown in Figure 11. The apparatus was equipped with a heating system to acclimate the slab to the test temperature. The slab was maintained at a test temperature of 45°C for approximately two hours, and next the test was conducted by applying a wheel load of (700 ±10N) to the center of the slab, and it was subjected to testing for approximately six hours until it reached 10,000 cycle or a maximum rutting depth of 20 mm.
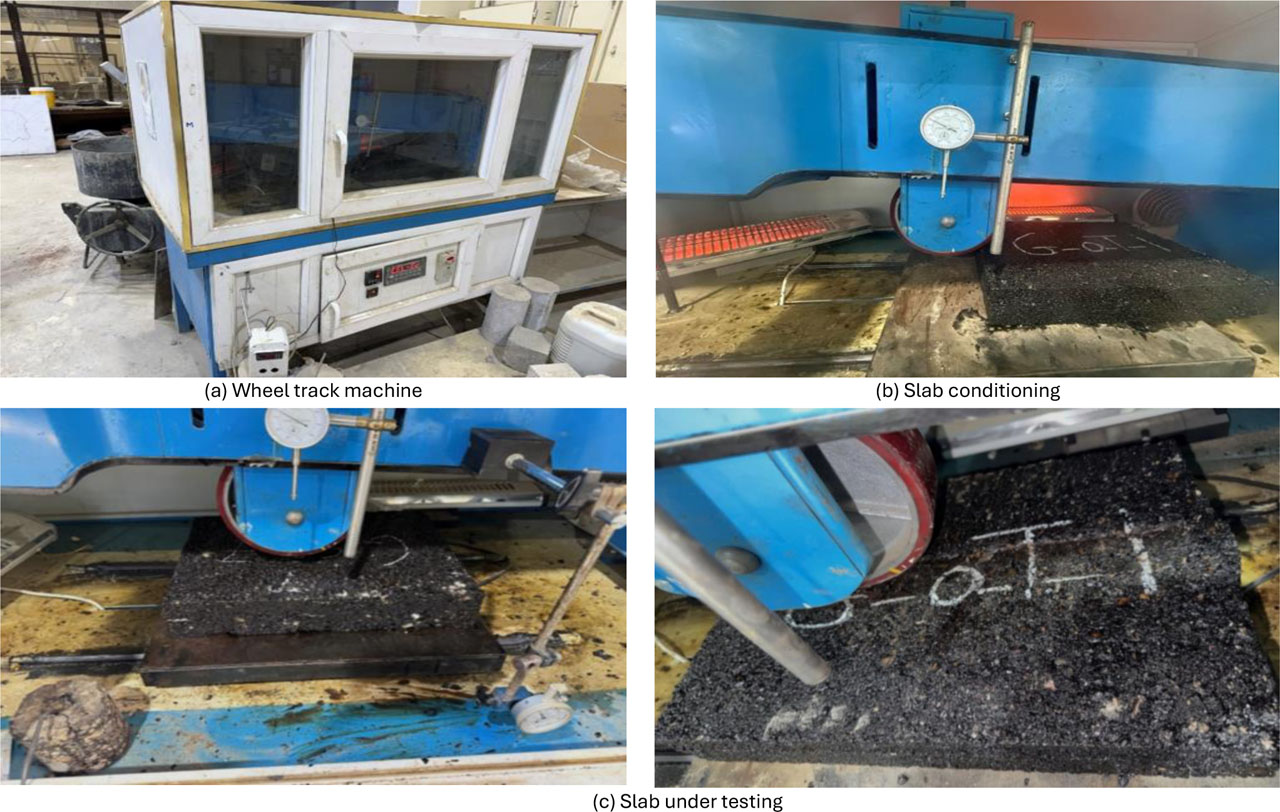
Figure 11:
Wheel Track test
6. Results and discussion
6.1. Comparative Analysis of Interlayer Shear Strength under Different Geotextile Coverage Conditions
Figure 12 reveals two distinct rate-dependent responses: the unreinforced interface reached its maximum ISS at a relatively low tack coat application rate, whereas the geotextile-reinforced interfaces generally required higher application rates to develop stronger bonding. At 0 L/m2, the unreinforced interface still exhibited an ISS of 836.42 kPa, indicating that some degree of interlayer bonding can develop through direct contact between the asphalt layers even without a tack coat, consistent with the findings of (Zaniewski et al., 2015).
However, the ISS value is significantly lower in cases of geotextile reinforcement 100% and 50% coverage at 0 L/m2, compared to the unreinforced case. This behavior could be because of the presence of geotextile which acts as a separating layer in the absence of a tack coat. This behavior would limit direct contact between layers and weaken interfacial bonding.
The shear strength initially increases in the unreinforced condition from 836.42 to 1083.89 kPa at 0.3 L/m2 of application rate (approximately 30%), followed by gradually reduction as the application rate further increase, reaching 564.74 kPa at 1.2 L/m2. This indicates that the benefit of the tack coat is relatively limited in this case, after the optimum, the interfacial resistance begins to decrease, this trend is consistent with (Ali et al., 2023; Alsadik et al., 2026). Which highlights the practical importance of precise control over the applied quantity, as higher amounts does not necessarily lead to better bonding.
By contrast, the two geotextile-reinforced condition exhibit a different response, shows a gradual increase in ISS with increasing application rate, while the ISS value retains lower than the unreinforced condition at low application rate (0.3 L/m2), this is consistent with previous research conducted by (N. S. Correia et al., 2023; Silva et al., 2024) found that when using a small amount of tack coat and in the presence of geotextiles and geosynthetic materials, the bonding between layers will be significantly reduced compared to samples without reinforced. This indicates that the applied tack coat is not yet sufficient for the geotextile to contribute to bonding.
Nevertheless, at the intermediate application rates, the interfacial behavior of the two geotextile coverage conditions became increasingly convergent. At 0.6 L/m2, the ISS values were 639.56 kPa for 50% coverage and 577.23 kPa for 100% coverage, with a difference of approximately 10%. This convergence became more pronounced at 0.9 L/m2, where the difference between 50% coverage (790.95 kPa) and 100% coverage (812.02 kPa) decreased to less than 3%. These results indicate that once a relatively sufficient amount of tack coat is available to improve interfacial interaction, the performances of the two coverage conditions become comparable, and the influence of coverage extent becomes relatively limited.
With application rates increasing to 1.2 L/m2, the difference between 50% and 100% geotextile coverage becomes more pronounced. The ISS value reaches 961.52 kPa for 100% coverage, which is approximately 32% higher than the 729.26 kPa for 50% coverage. This is due to the increased area of the geotextile that can absorb and retain the tack coat, thus helps enhancing the interfacial resistance and reducing the likelihood of slippage. This interpretation is consistent with (Silva, Saxena, et al., 2024), who emphasized the importance of applying sufficient tack coat when geosynthetic interlayers are used. For 100% geotextile coverage, tack coat application rates beyond the investigated range may reduce interlayer bond strength, although this possibility was not experimentally verified in the present study. A previous study reported a qualitatively consistent trend for an emulsified tack coat using mass-based application rates, with bonding peaking at 1.2 kg/m2 and declining beyond this rate (Zhang et al., 2022).
The maximum ISS was recorded for unreinforced condition at 1083.89 kPa, followed by 100% geotextile at 961.52 kPa and 50% coverage at 790.95 kPa. This corresponds to differences of about 11% between unreinforced and 100% coverage, 37% between unreinforced and 50%, and 22% between 100% and 50% coverage.
The near convergence observed at 0.6–0.9 L/m2, despite the renewed divergence at 1.2 L/m2, indicates that partial coverage can approach the bonding performance of full coverage only within an appropriate tack coat range, rather than consistently across all application rates. This interaction suggests potential material-use efficiency through reduced geotextile coverage
Overall, although the unreinforced condition achieves the highest peak ISS, the use of geotextile does not result in a critical decrease in bonding between layers when appropriate tack coat application rates are used. Under these conditions, the achieved shear resistance remains within an acceptable range without evidence of bond failure. However, this performance remains dependent on the application rate, as lower levels lead to noticeably reduced ISS values. Accordingly, the effectiveness of geotextile-reinforced systems should be considered in relation to the applied tack coat, where suitable application levels can maintain adequate bonding while offering additional functional benefits, such as moisture barrier capability and stress absorption (Raja et al., 2019; Salman & Joni, 2025; Solatiyan et al., 2020; Sun et al., 2020). These findings confirm that achieving effective interlayer bonding with geotextile is feasible when proper tack coat application is ensured.
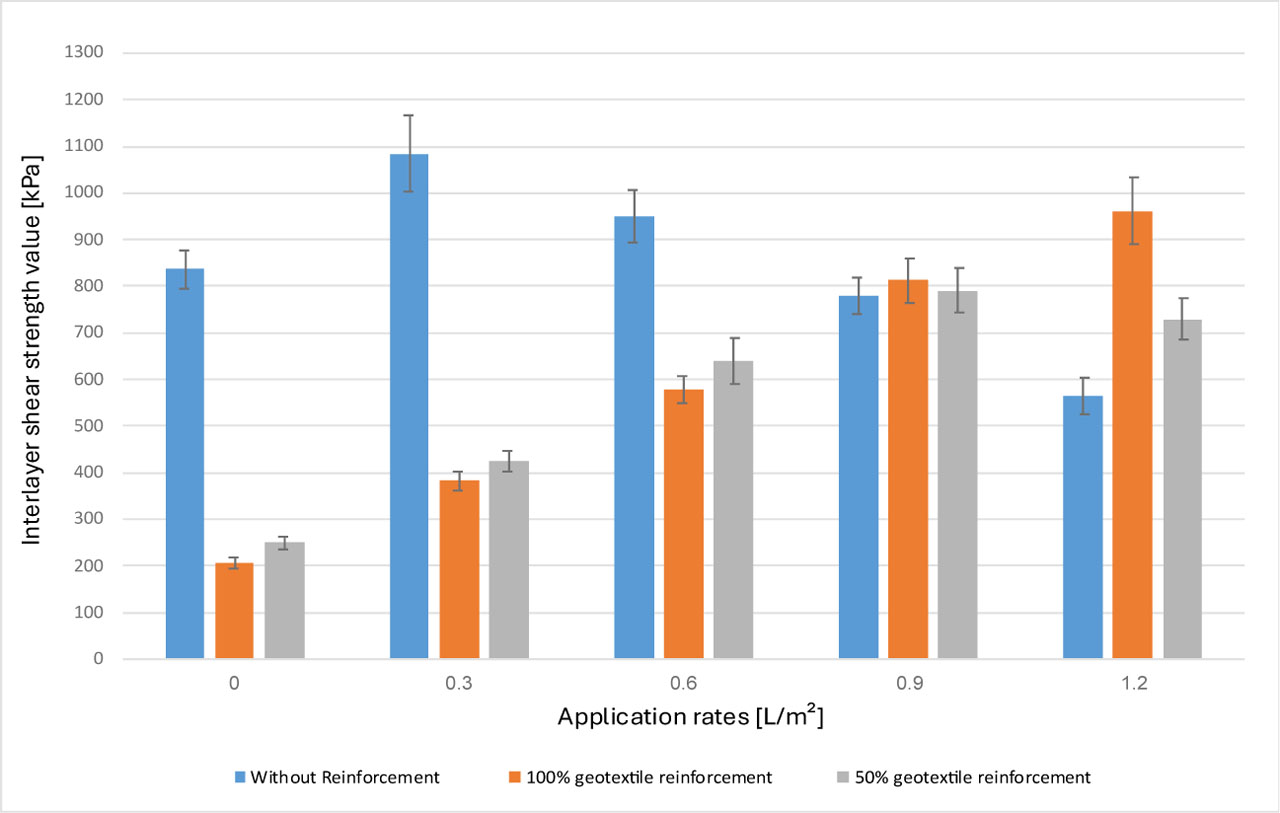
Figure 12:
ISS under varying tack coat application rates and geotextile coverage conditions
6.2. Comparative Analysis of Permanent Deformation under Different Geotextile Coverage Conditions
Figure 13 presents the final rut depth values obtained at the end of the Wheel Tracking test for the different tack coat application rates and geotextile coverage ratios. For specimens without geotextile, the lowest rut depth of 11.5 mm was obtained at 0.3 L/m2 of tack coat, which is equivalent to an improvement of approximately 10% compared to 12.4 mm without tack coat. This indicates improved contact and load transfer between the binder and wearing layers when the amount of tack coat is limited. However, beyond this level, the rut depth progressively increased, reaching 13 mm at 1.2 L/m2, approximately 13% above the minimum value observed at 0.3 L/m2. This indicates that with excessive application of the tack coat, there was a gradual deterioration in rutting resistance. From this behavior, it can be suggested that excessive tack coat may form a lubricating layer that promotes deformation under repeated loading, weakens interlayer bonding, and increases the potential for slippage between asphalt layers.
Introducing geotextile changed the rate-dependent rutting response, particularly when no tack coat was applied. Without the application of a tack coat, the rut depths were greater than unreinforced sample in both geotextile coverage conditions, particularly in the 50% coverage, where the rut depth reached 15.2 mm, demonstrating a 23% increase as compared to the interlayer untreated sample. Furthermore, the sample fully covered with geotextile recorded a rut depth of 14.1 mm, indicating that the presence of geotextile without a tack coat, was insufficient to increase rutting resistance. These results suggest that adequate impregnation and bonding are crucial to the effectiveness of the geotextile. If its absorption of the tack coat is insufficient, the geotextile may behave as a weak discontinuity layer, therefore not as part of the pavement system, rather than an effective reinforcing interlayer, and this effect becomes more pronounced under high temperature repeated loading.
With full geotextile coverage, rut depth decreased systematically as the tack coat application rate increased. The final rut depth at 1.2 L/m2 was 8.3 mm, compared with 14.1 mm at 0 L/m2, which is equivalent to an improvement within the same group of nearly 41% and approximately 28% compared to the best control condition (without geotextile). This result is consistent with (Meteab et al., 2022; Zhang et al., 2022), who similarly reported improved rutting resistance when a geotextile and tack coat were used between the binder and wearing layers, supporting the importance of treating the fabric and tack coat as an integrated interlayer system. As tack coat rate increased, the rut depth gradually decreased, the systematic reduction in rut depth suggests that the fabric may have absorbed and retained part of the additional emulsion, allowing it to function as an integrated interlayer rather than permitting the tack coat to accumulate as a free excess-binder layer. This mechanism may also contribute to more uniform stress distribution within the pavement system. These findings highlight that the best-performing tack coat rate depends on the interlayer configuration rather than being constant across pavement systems.
The 50% geotextile coverage also improved as the tack coat application rate increased up to 0.9 L/m2. The best performance was obtained at 0.9 L/m2 with a rut depth of 9.5 mm, corresponding to approximately 37% improvement relative to the untreated 50% coverage specimen and about 17% lower rut depth than the best control condition. Compared with the best observed 100% coverage condition, the difference in rut depth was only about 13%, indicating that partial coverage was capable of achieving rutting resistance relatively close to that of full coverage. This suggests that a significant portion of the reinforcement benefit can be achieved while minimizing the coverage ratio of geotextiles used, which may a more economical reinforcement approach. However, as opposed to 100% coverage system, the 50% coverage condition did not keep a continuous enhancement trend throughout the analyzed tack coat application range. A slight increase in rut depth from 9.5 to 9.9 mm occurred when the application rate increased from 0.9 to 1.2 L/m2. This behavior may be due to the discontinuous nature of partial coverage, where geotextile-reinforced areas absorb the tack coat while uncovered interface areas remain more susceptible to excessive buildup of binder material and localized deformation. In contrast, the 100% coverage system exhibited a more stable and consistent improvement trend, reflecting the advantage of continuous reinforcement and more uniform stress transfer across the interface.
Overall, the results demonstrate that the optimal rate of tack coat strongly relies on the configuration of interlayer system. For control specimens, a relatively low application rate was sufficient, whereas higher rates were required in geotextile-reinforced systems to develop stronger interaction between the fabric and the adjacent asphalt layers. Full geotextile coverage produced the most consistent and effective rutting resistance, while partial coverage provided substantial improvement with potentially greater economic efficiency.
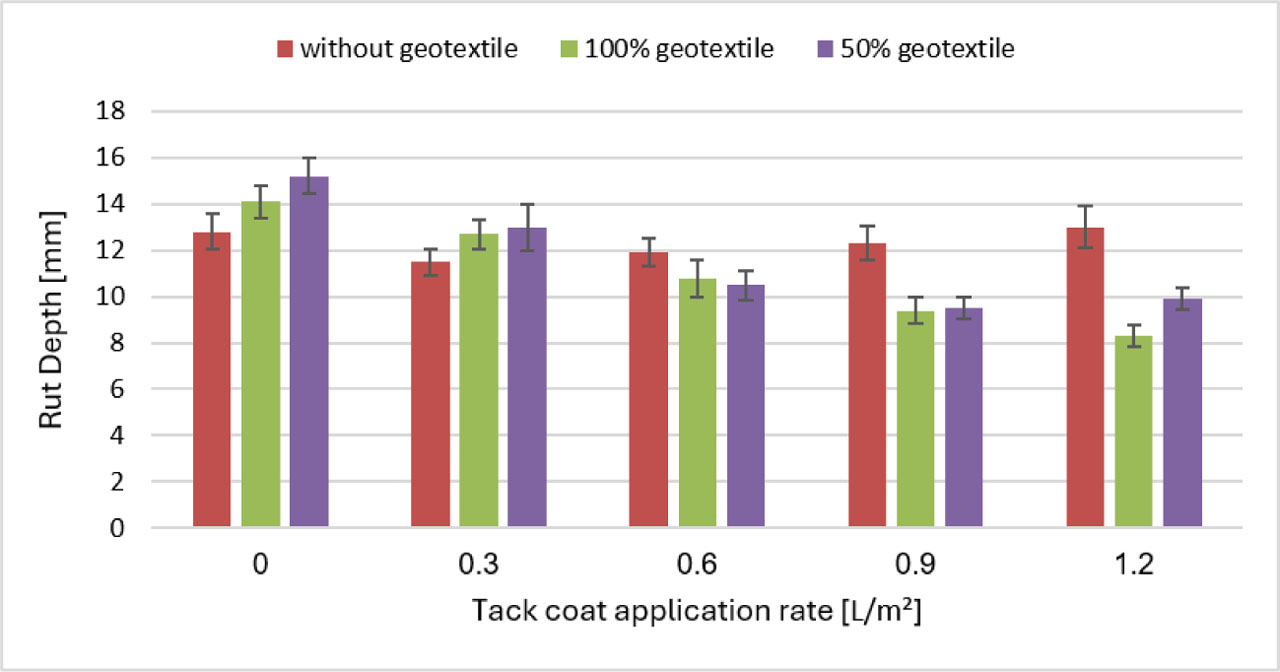
Figure 13:
Final rut depth at various rates of tack coat application and geotextile coverage conditions
7. Limitations and Future Research
The investigated tack coat application rates were limited to 1.2 L/m2. The selected range captured the best performance of the unreinforced and 50% geotextile coverage conditions, after which their performance declined. However, with 100% geotextile coverage, interlayer shear strength and rutting resistance continued to improve up to 1.2 L/m2. Therefore, only the full-coverage condition did not exhibit a turning point within the investigated range, and its actual optimum and potential deterioration at higher rates could not be determined. Future studies should examine higher rates, such as 1.5 L/m2, for full geotextile coverage, evaluate other geotextile and tack coat types, and conduct long-term field investigations under combined traffic and environmental loading, including climate-related temperature variations, particularly extreme heat conditions, to validate the laboratory findings and optimize the asphalt interlayer system.
8. Conclusions
Interlayer conditions can influence the structural response of layered asphalt pavements. This study evaluated the effects of tack coat application rate and geotextile coverage on interlayer shear strength and rutting resistance. Double-layer asphalt specimens consisting of binder and wearing courses with different aggregate gradations were prepared. Three interlayer conditions (without geotextile, 50% geotextile coverage, and 100% geotextile coverage) were evaluated at tack coat application rates ranging from 0 to 1.2 L/m2 using interlayer shear and wheel-tracking tests. Based on the findings of this research, the following conclusions can be drawn under the materials investigated and laboratory testing conditions:
The optimal tack coat rate of application relied on the interlayer condition. The highest inter-layer shear strength (1083.89 kPa) was obtained for the unreinforced specimens at a tack coat application rate of 0.3 L/m2. Conversely, geotextile reinforced specimens required higher application rates to compensate for emulsion absorption and to ensure adequate bonding between asphalt concrete layers.
The effect of geotextile reinforcement is considerable regarding pavement performance. At the optimum tack coat rate for each condition, reinforced specimens with 100% and 50% coverage showed lower ISS values of 961.52 and 790.95 kPa, respectively, compared with 1083.89 kPa without reinforcement, representing reductions of 11.3% and 27.0%. However, they demonstrated greater resistance to rutting, with rut depths of 8.3 and 9.5 mm, respectively, compared with 11.5 mm without reinforcement, corresponding to reductions of 27.8% and 17.4%.
The ultimate rutting resistance was achieved at 100% geotextile coverage, resulting in an approximately 28% reduction in rut depth compared with the optimum unreinforced condition. Similarly, 50% geotextile coverage reduced rut depth by 17.4%, indicating that partial reinforcement can improve resistance to permanent deformation while reducing geotextile consumption relative to full coverage. However, its economic viability depends on the combined costs of the geotextile, increased tack coat consumption, and additional construction effort.
Excessive tack coat application had a negative impact on the rutting performance of unreinforced specimens due to increasing the tack coat layer thickness which promoted interlayer slippage and reduced bonding strength between pavement layers. In parallel, tack coat application rate led to a better rutting performance of the reinforced samples because of the absorption capacity of the geotextile. Part of the tack coat was absorbed and retained by the geotextile which is an essential step for the optimum bonding between geotextile and the two asphalt concrete layers. The geotextile acted as an additional reinforcing layer to increase interfacial resistance and to reduce the potential for slippage. These results imply that the optimal tack coat application rate is dependent on the type of interlayer treatment. The application rate of the tack coat should be optimized based on the pavement-specific system, rather than applying a uniform application rate for all pavement structures.
Enhancements of interlayer bond strength did not necessarily contribute to improvements in rutting resistance. The specimens with the maximum bond strength were not the same as the ones with the optimal rutting performance, which confirms the importance of considering both parameters when assessing asphalt concrete pavements.
The combination of 100% coverage of geotextile and the rate application of tack coat of 1.2 L/m2 produced the best performance against rutting among the studied range (8.3 mm), while control specimens showed the highest interlayer shear strength at 0.3 L/m2 (1083.89 kPa).
The best performance against rutting was achieved at the maximum application rate (1.2 L/m2) of tack coat that was studied in the current study. Previous research (Zhang et al., 2022) observed a degradation in interlocking strength beyond this rate, although it is recommended that more future studies could be useful to assess higher application rates accompanied by intermediate geotextile coverage ratios of 50% to 100%.
Notes
[1] Contributed by Author Contributions
A.A. conceived and designed the study. H.A. conducted the experiments and collected the data. H.A. performed the statistical analysis. A.A. contributed to data interpretation and manuscript drafting. All authors critically reviewed and approved the final version of the manuscript and agreed to be accountable for all aspects of the work.