

Table 1:
Slab types that are adopted in this study, with their mix proportions
| Group | No. | Slab ID | Mix type | Slab type | Material proportions | |||||
|---|---|---|---|---|---|---|---|---|---|---|
| Cement | Water | RCA | NCA | Fine aggregate | SP | |||||
| I | 1 | SSR | MR | Solid | 450 | 225 | 0 | 850 | 820 | 2.25 |
| II | 2 | HS-R0 | MR | Hollow | 450 | 225 | 0 | 850 | 820 | 2.25 |
| 3 | HS-R25 | M1 | Hollow | 450 | 225 | 212.5 | 675.5 | 820 | 4.5 | |
| 4 | HS-R50 | M2 | Hollow | 450 | 225 | 425 | 425 | 820 | 5.625 | |
| 5 | HS-R75 | M3 | Hollow | 450 | 225 | 675.5 | 212.5 | 820 | 6.75 | |
Table 2:
Experimental test results of slab specimens
| Slab ID | Mix type | f'c MPa | fspt MPa | Slab type | Experimental results | Failure type | |||
|---|---|---|---|---|---|---|---|---|---|
| 1st cracking | Peak state | ||||||||
| Pcr, kN | Δcr, mm | Pp, kN | Δp, mm | ||||||
| SSR | MR | 39.81 | 4.94 | Solid | 41.25 | 1.70 | 170.846 | 18.492 | Flexure |
| HS-R0 | MR | 39.81 | 4.94 | Hollow | 31.57 | 1.98 | 148.686 | 18.864 | Shear |
| HS-R25 | M1 | 39.55 | 4.40 | Hollow | 37.84 | 1.04 | 148.182 | 12.17 | Shear |
| HS-R50 | M2 | 35.5 | 4.10 | Hollow | 35.04 | 0.94 | 135.762 | 10.723 | Shear |
| HS-R75 | M3 | 30.24 | 3.83 | Hollow | 27.34 | 1.30 | 111.078 | 15.779 | Shear |
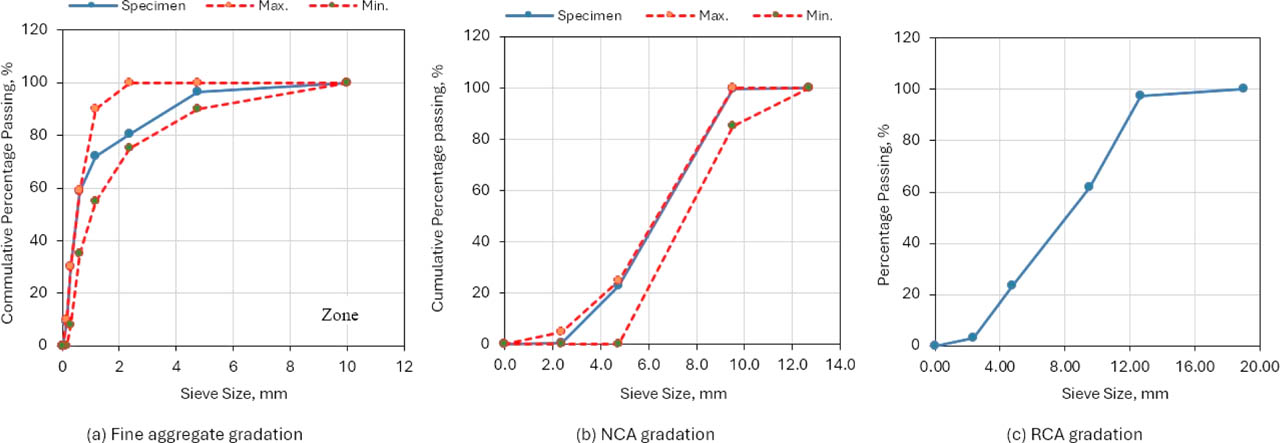
Figure 1:
Sieve analysis of the fine aggregate, normal coarse aggregate, and recycled concrete aggregate
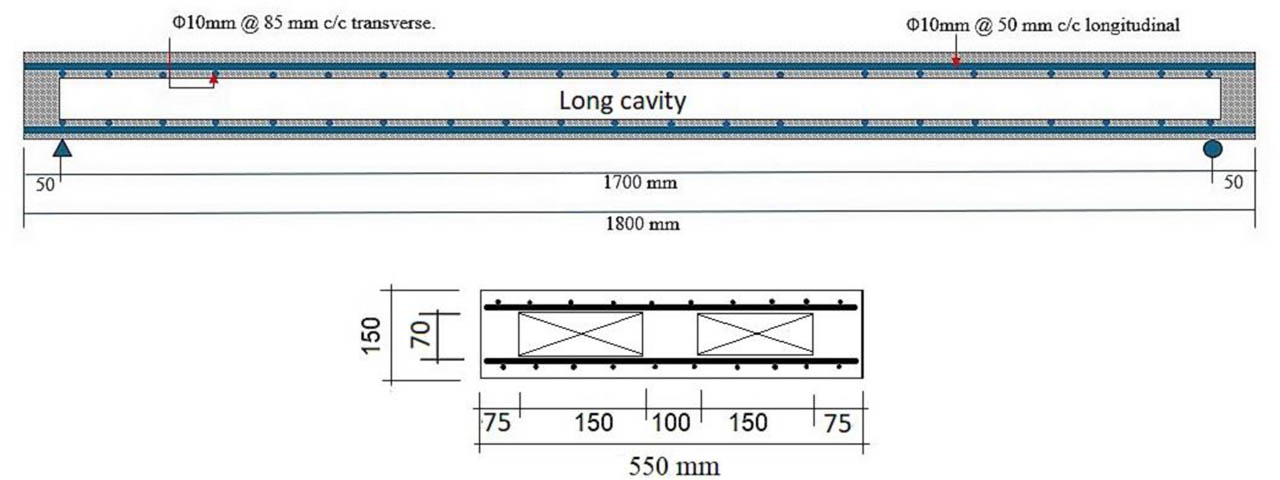
Figure 2:
Longitudinal and transverse sections of the hollow-core one-way slab
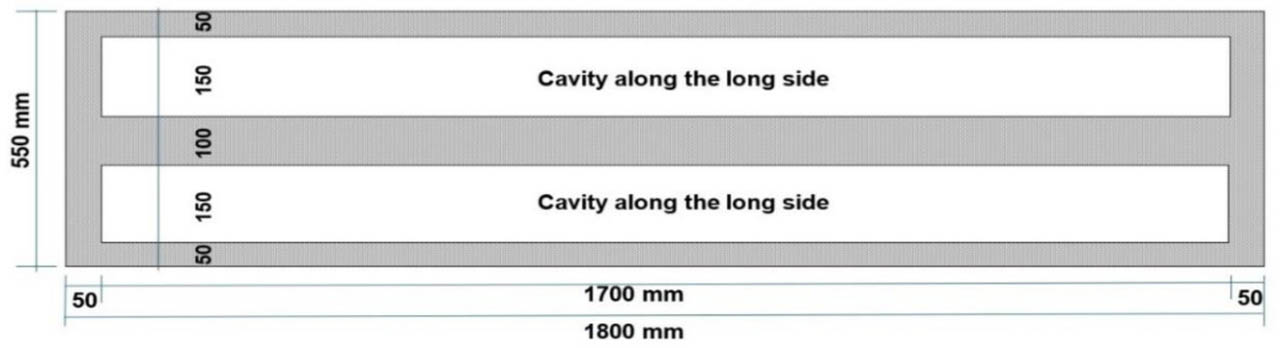
Figure 3:
Arrangement of cavities in the slab to make a hollow-core one-way slab
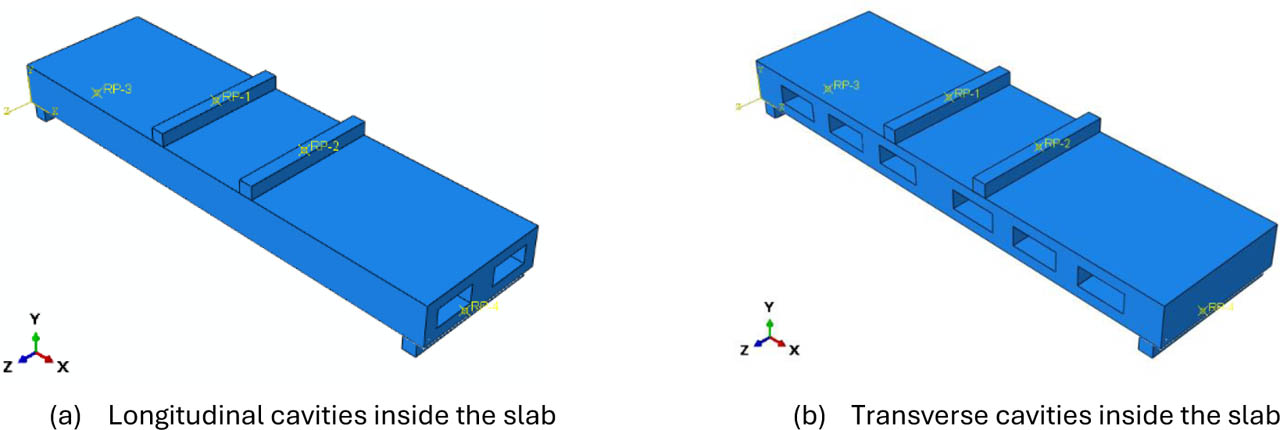
Figure 4:
The orientation of openings in the slab
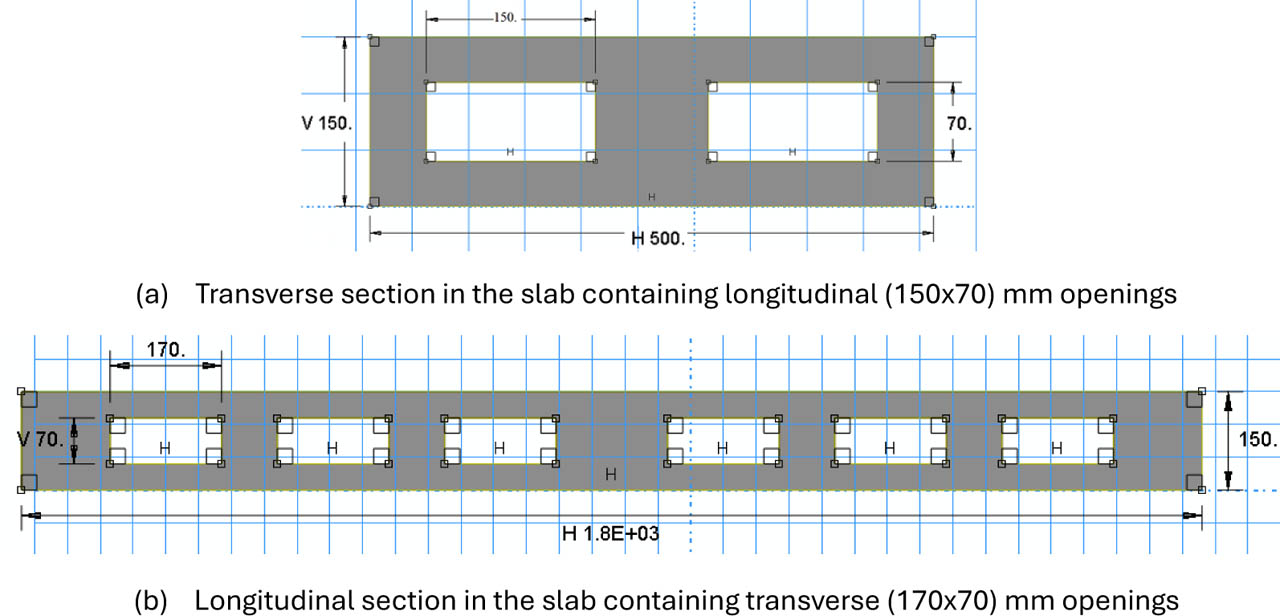
Figure 5:
Sections in the analysed slabs
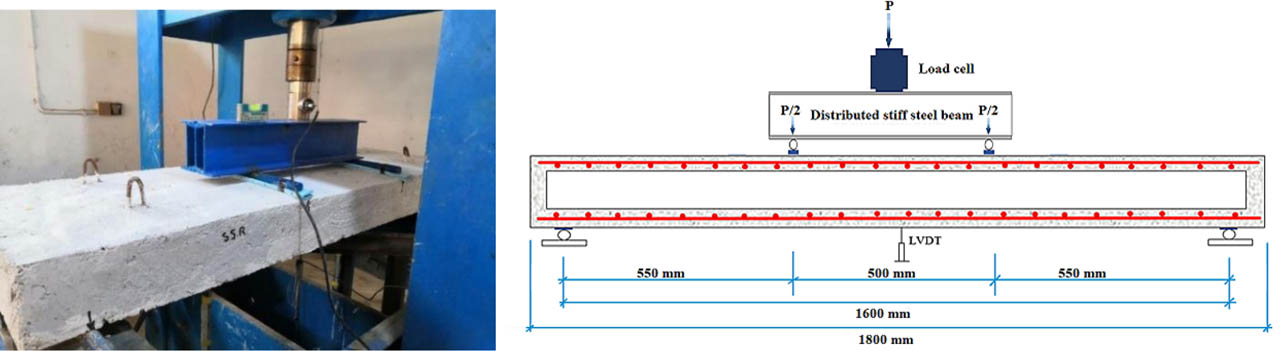
Figure 6:
Test setup of the slab specimen
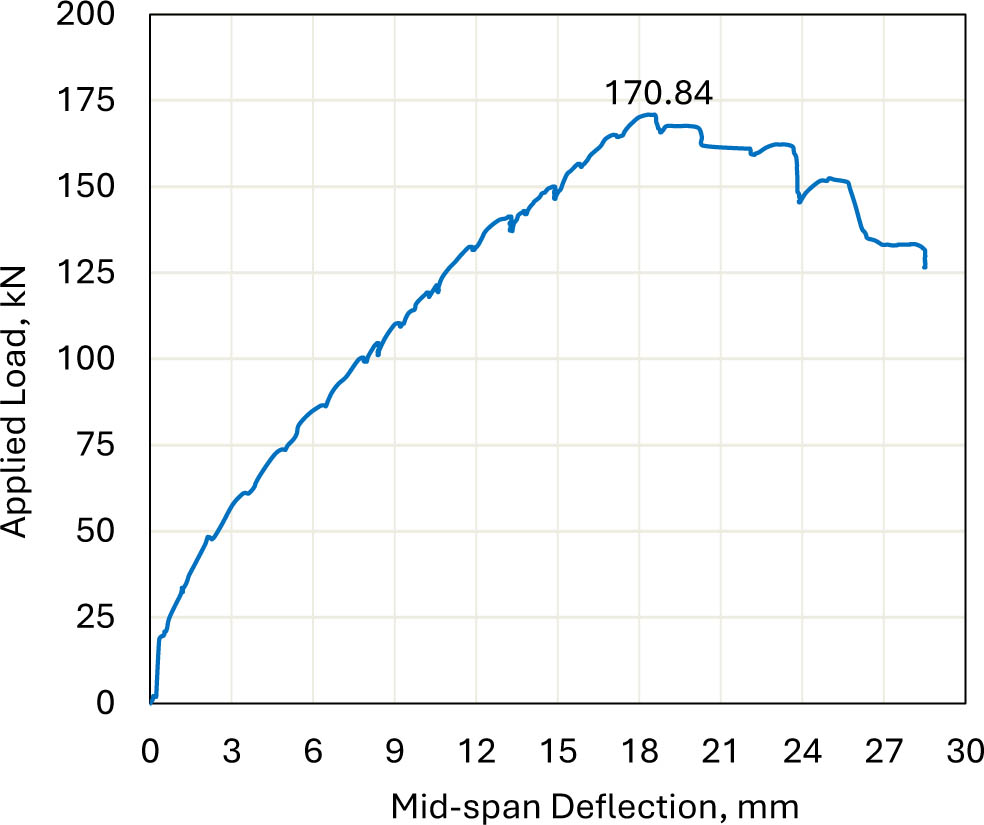
Figure 7:
The load mid-span deflection of the solid slab specimen, SSR
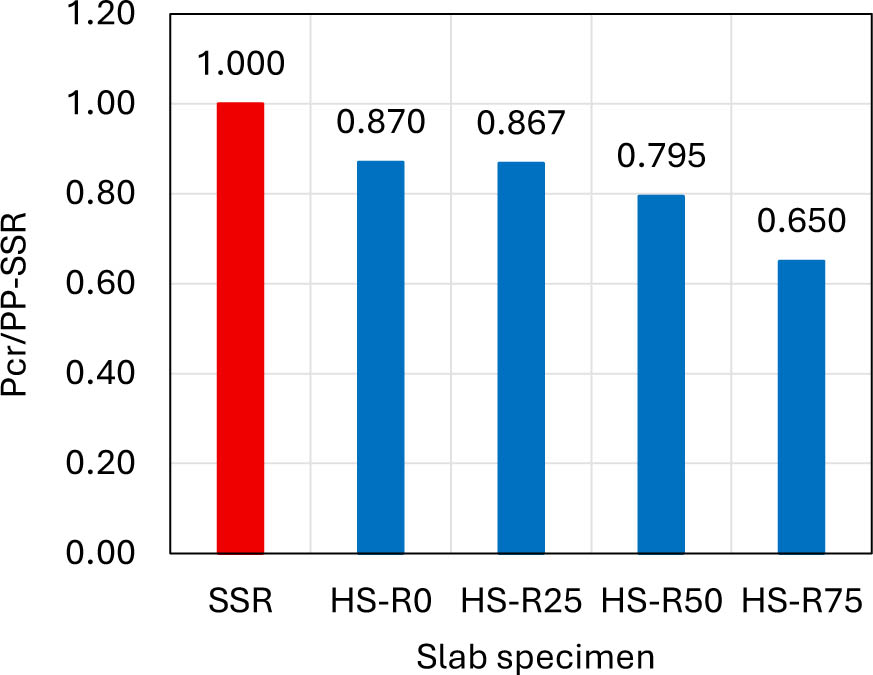
Figure 8:
The ratio of the peak load of hollow specimens to that of the load of the solid specimen
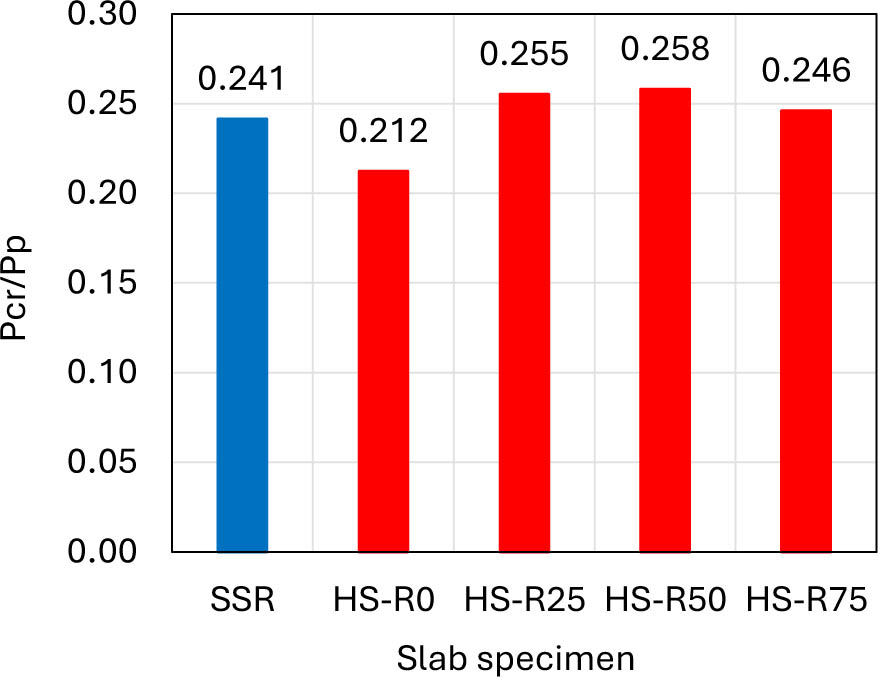
Figure 9:
The ratio of cracking to peak load of the first group of slab specimens
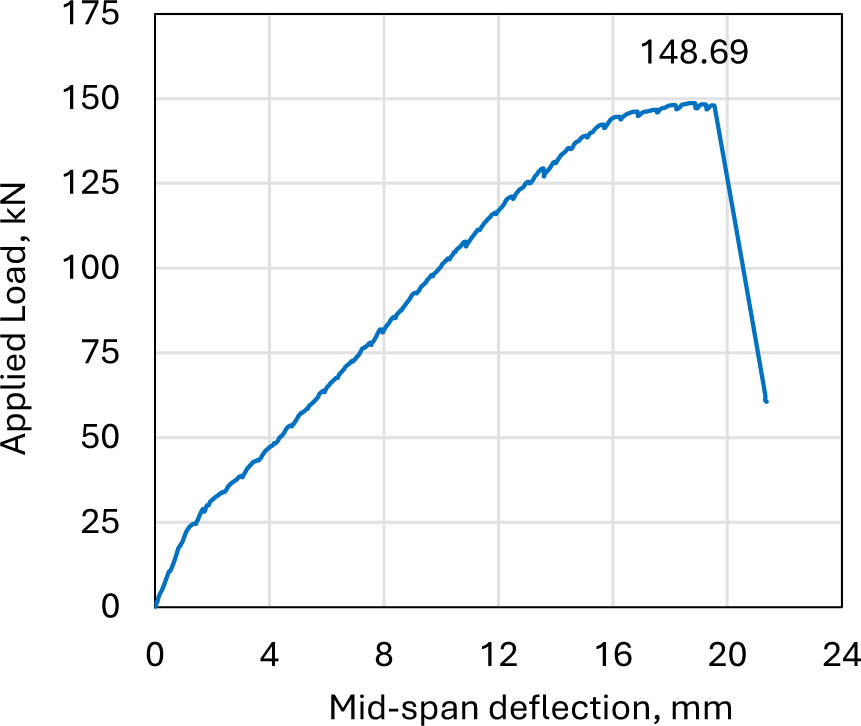
Figure 10:
The load-deflection relationship of HS-R0
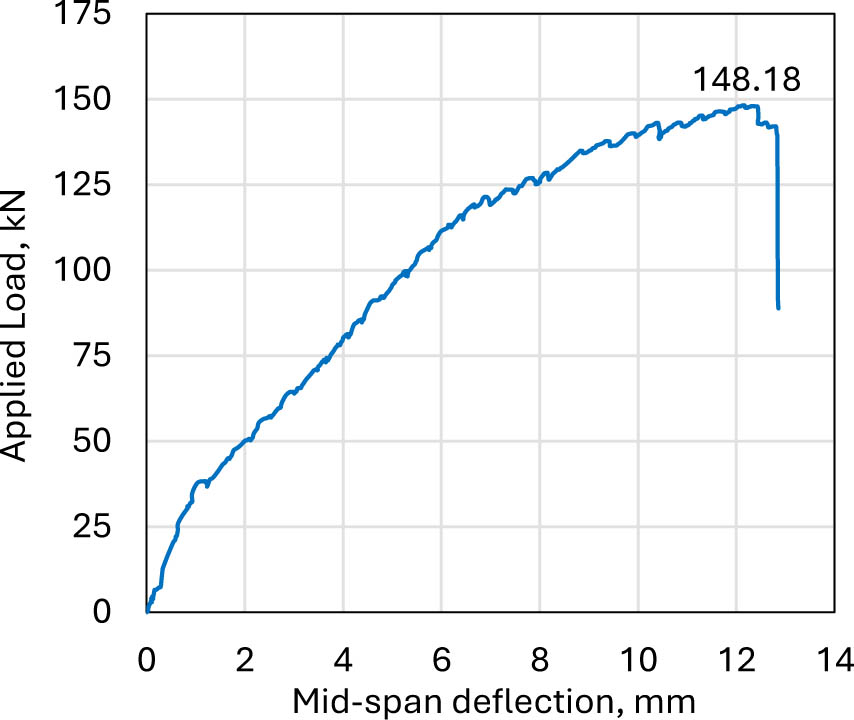
Figure 11:
The load-deflection relationship of HS-R25
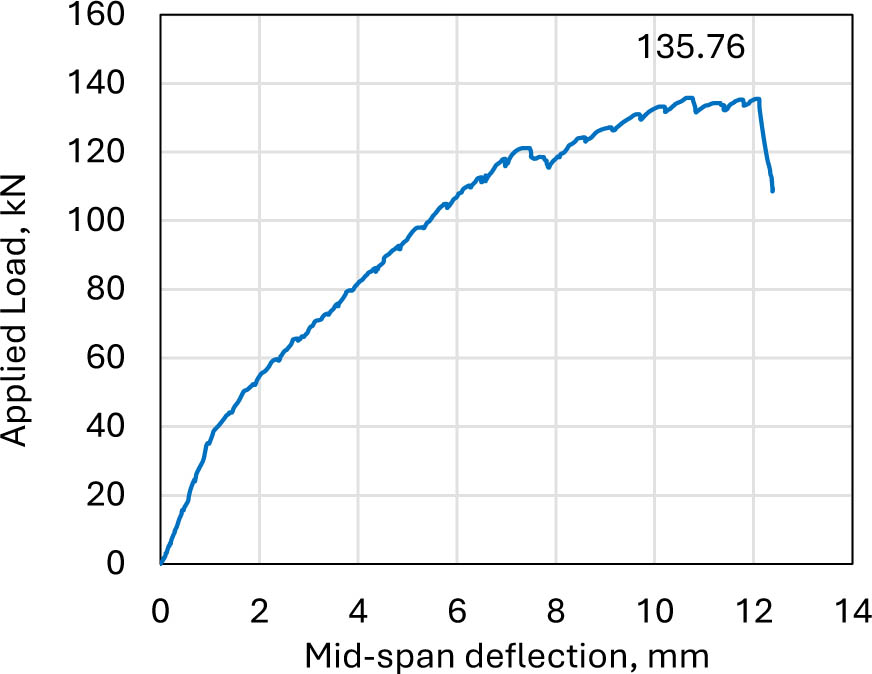
Figure 12:
The load-deflection relationship of HS-R50
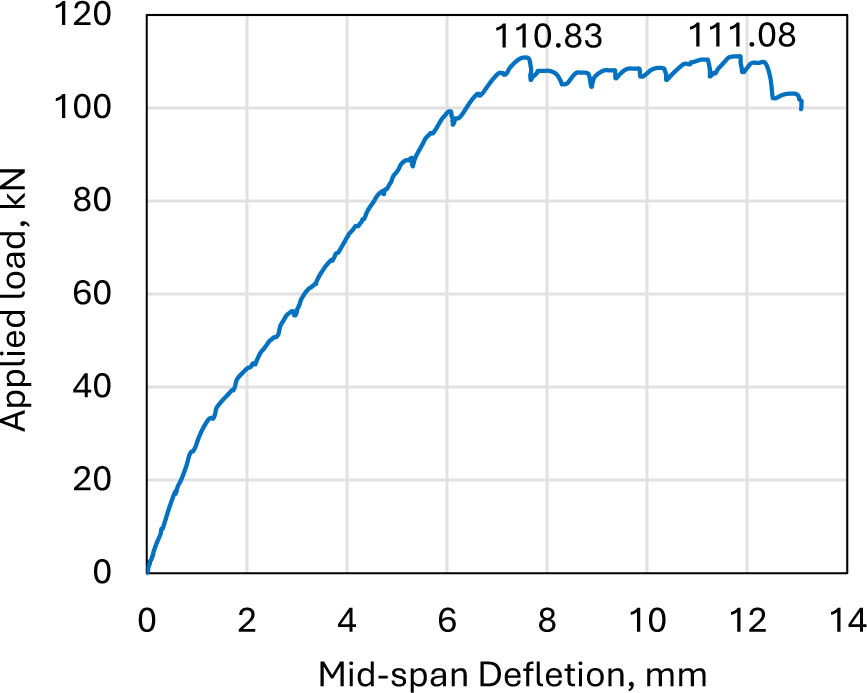
Figure 13:
The load-deflection relationship of HS-R75
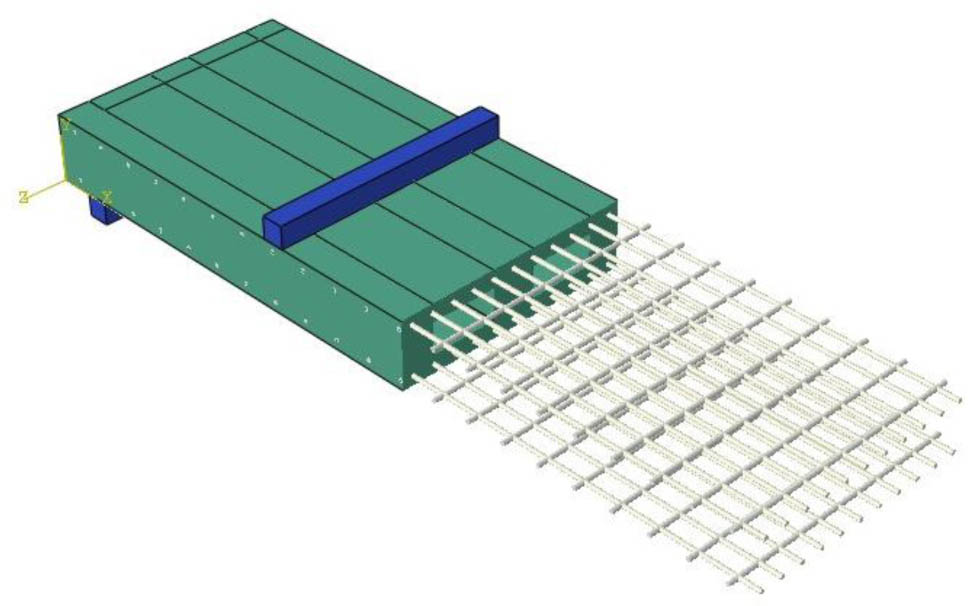
Figure 14:
The simulation of Slab constituents via Abaqus
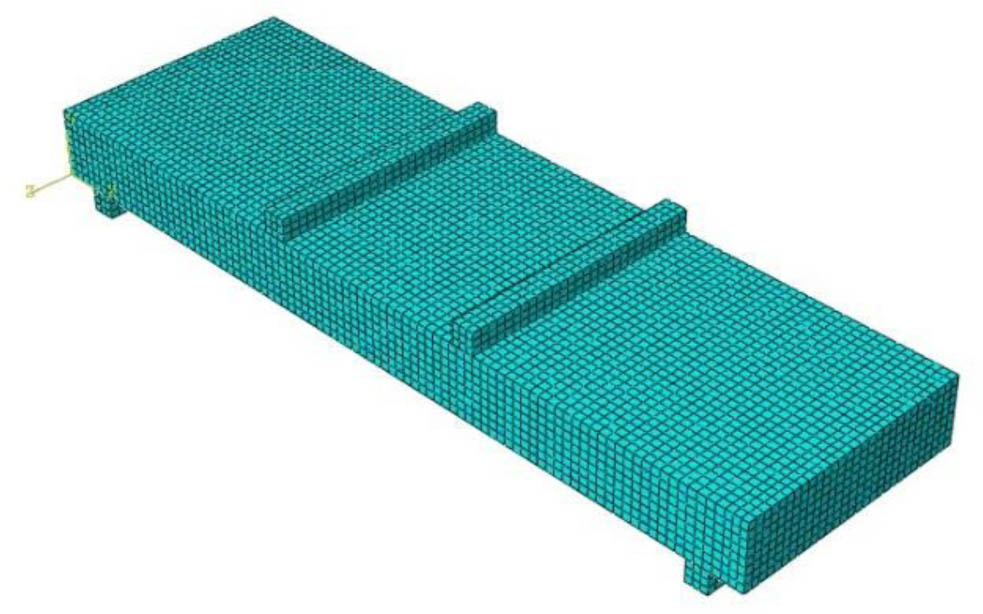
Figure 15:
Meshing of the slab's constituents
Table 3:
The material properties and parameters applied for simulating the hollow core slabs via Abaqus
| Substance | Properties | |||||||
|---|---|---|---|---|---|---|---|---|
| Concrete | Modulus of elasticity, Ecc | Poisson's ratio | ||||||
| Variable, according to the compressive strength | 0.18 | |||||||
| Dilation angle | eccentricity | fbo/fco | Shape factor | Viscosity parameter | ||||
| 32 | 0.1 | 1.16 | 0.67 | 1E-8 | ||||
| 10 mm steel rebars | Yielding stress | Elastic modulus | Poisson's ratio | |||||
| 590 MPa | 200000 MPa | 0.3 | ||||||
Table 4:
FEA and experimental results of slab specimens at cracking and peak state
| Slab ID | FEA results | Experimental Results | ||||||||
|---|---|---|---|---|---|---|---|---|---|---|
| 1st cracking | Peak state | Yield state | 1st cracking | Peak state | ||||||
| Pcr, kN | Δcr, mm | Pp, kN | Δp, mm | Py, kN | Δy, mm | Pcr, kN | Δcr, mm | Pp, kN | Δp, mm | |
| SSR | 30.17 | 0.73 | 170.42 | 20.66 | 160.16 | 9.20 | 41.25 | 1.704 | 170.846 | 18.492 |
| HS-R0 | 27.07 | 0.73 | 155.88 | 25.92 | 139.66 | 9.70 | 31.573 | 1.987 | 148.686 | 18.864 |
| HS-R25 | 25.72 | 0.73 | 148.18 | 12.36 | 135.53 | 10.03 | 37.837 | 1.04 | 148.182 | 12.17 |
| HS-R50 | 22.76 | 0.64 | 134.50 | 11.04 | 132.79 | 10.58 | 35.04 | 0.94 | 135.762 | 10.723 |
| HS-R75 | 19.69 | 0.59 | 116.03 | 9.64 | Not reached | 27.34 | 1.304 | 111.078 | 15.779 | |
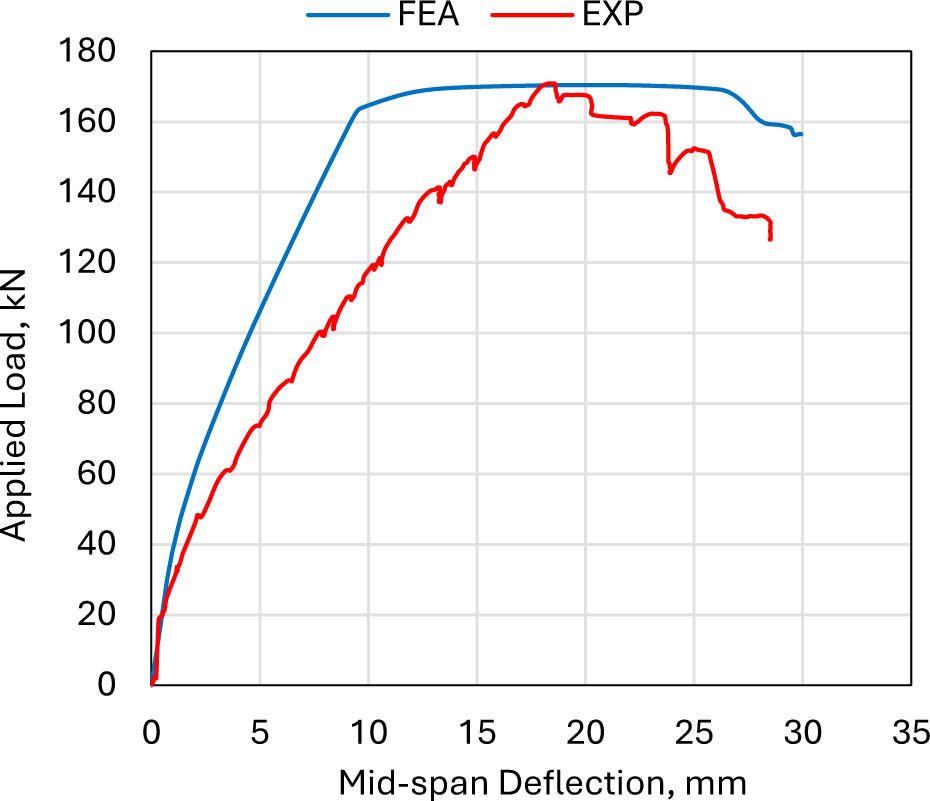
Figure 16:
Load-deflection behaviour of SSR
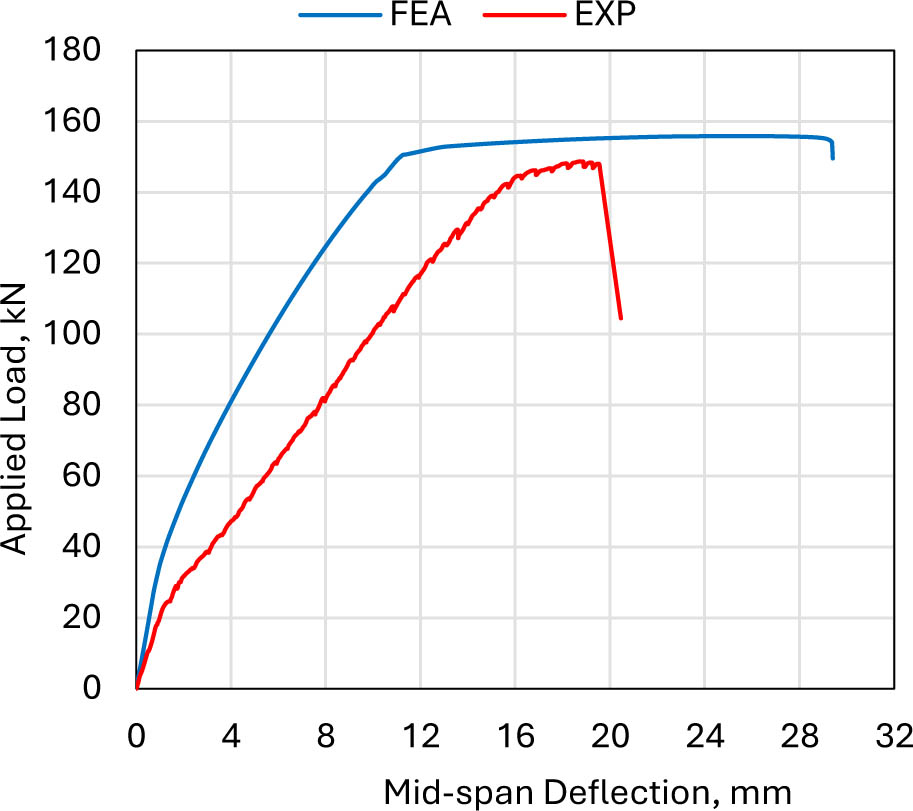
Figure 17:
Load-deflection behaviour of HS-R0
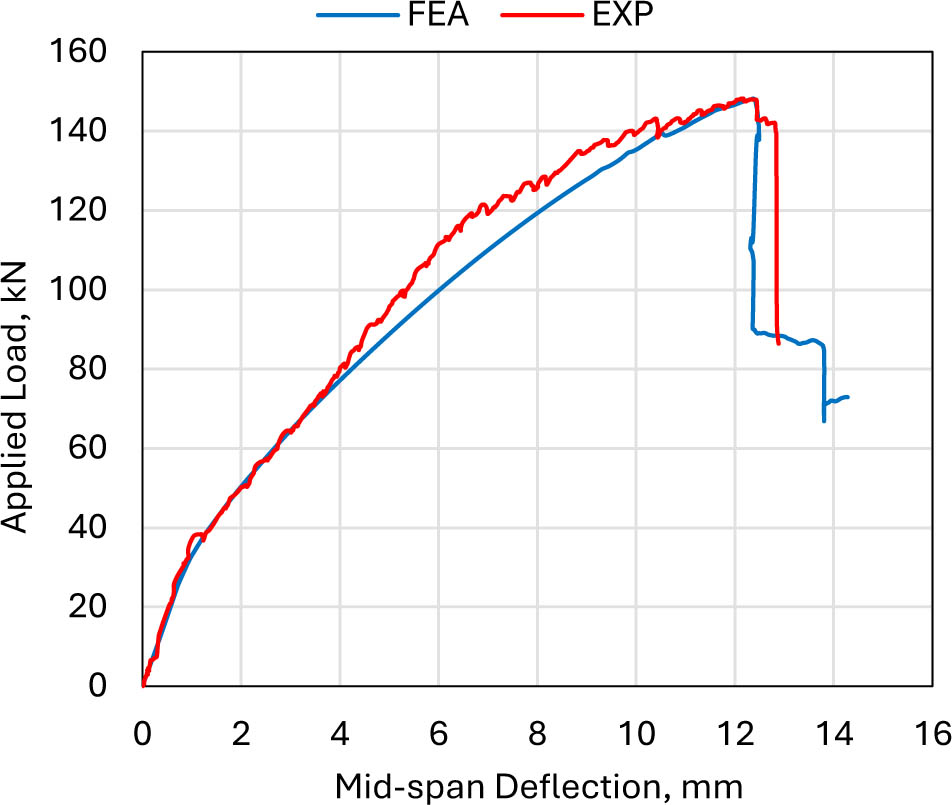
Figure 18:
Load-deflection behaviour of HS-R25
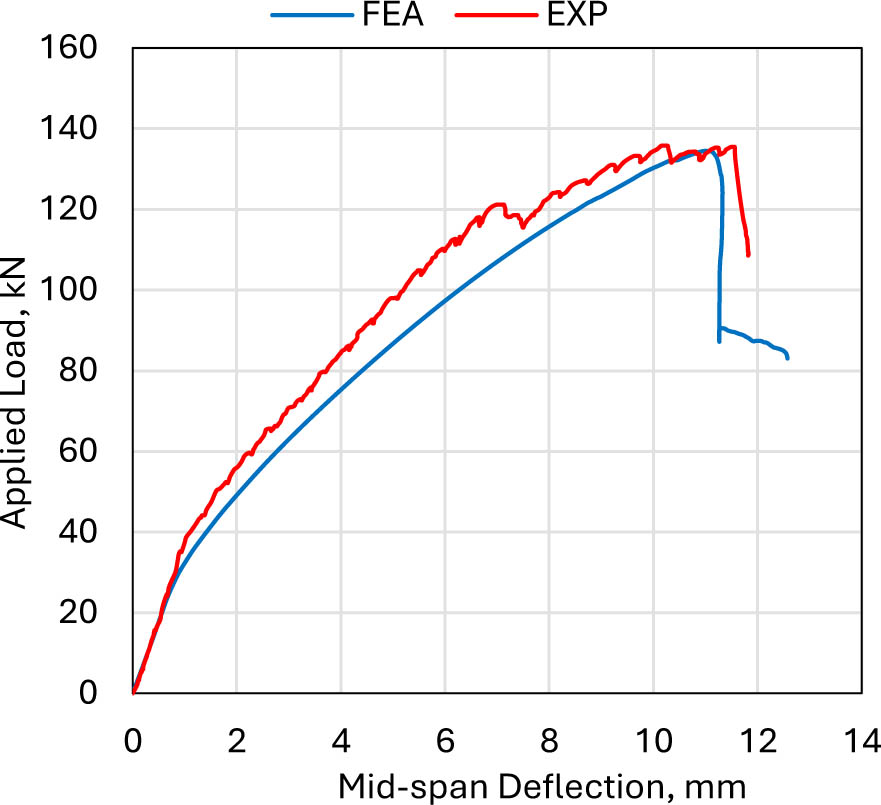
Figure 19:
Load-deflection behaviour of HS-R50
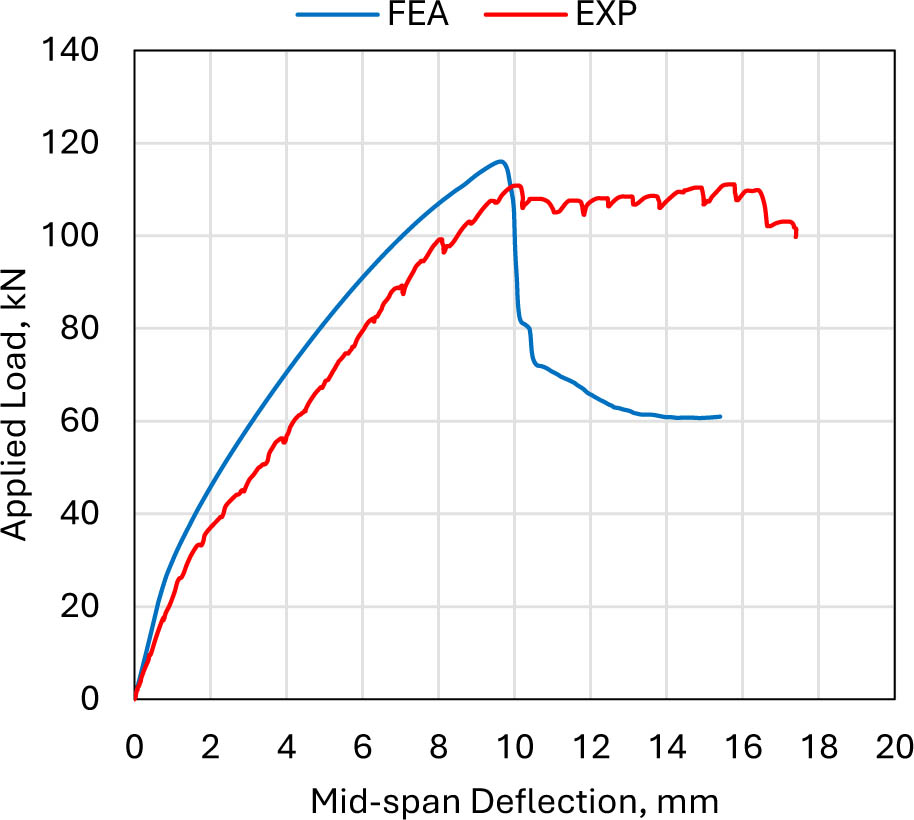
Figure 20:
Load-deflection behaviour of HS-R75
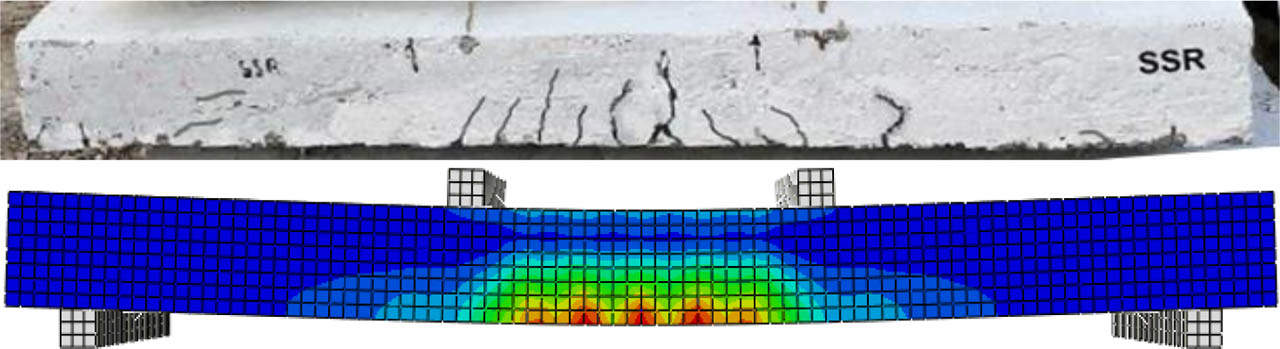
Figure 21:
The failure cracks of the solid slab, SSR
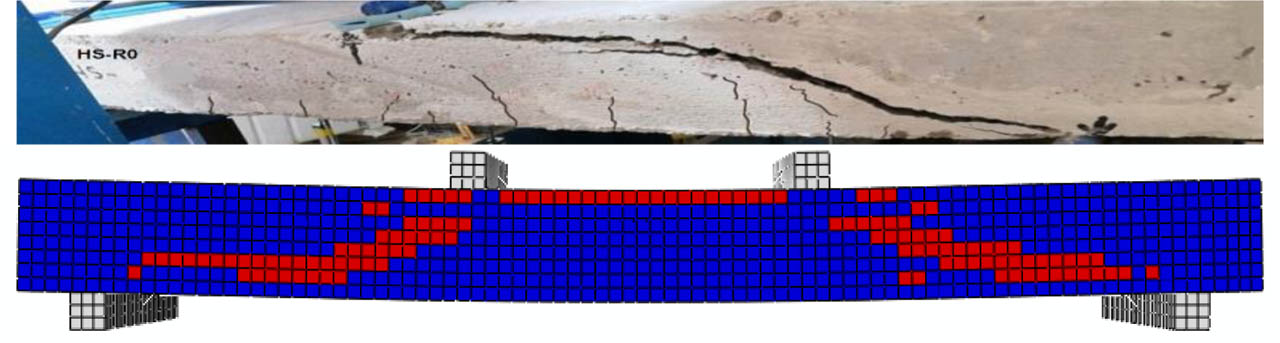
Figure 22:
Shear failure of the hollow-core slab specimen, HS-R0
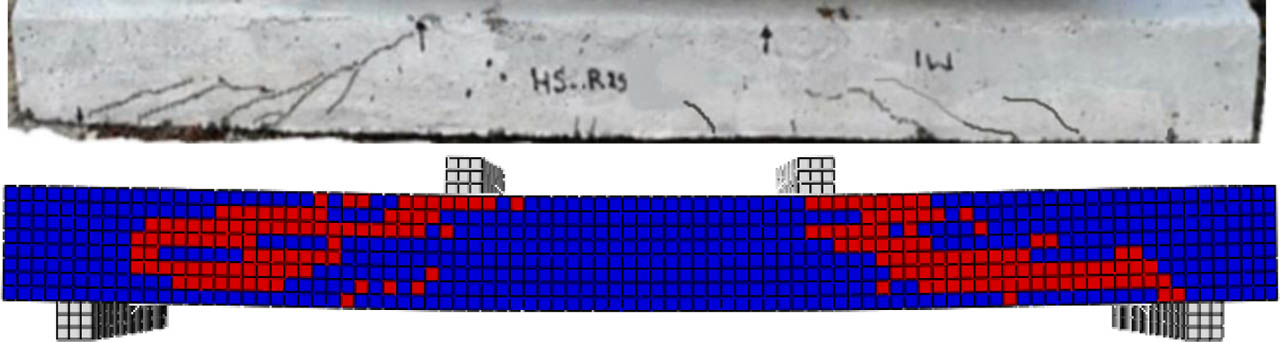
Figure 23:
Shear failure of the hollow-core slab specimen, HS-R25
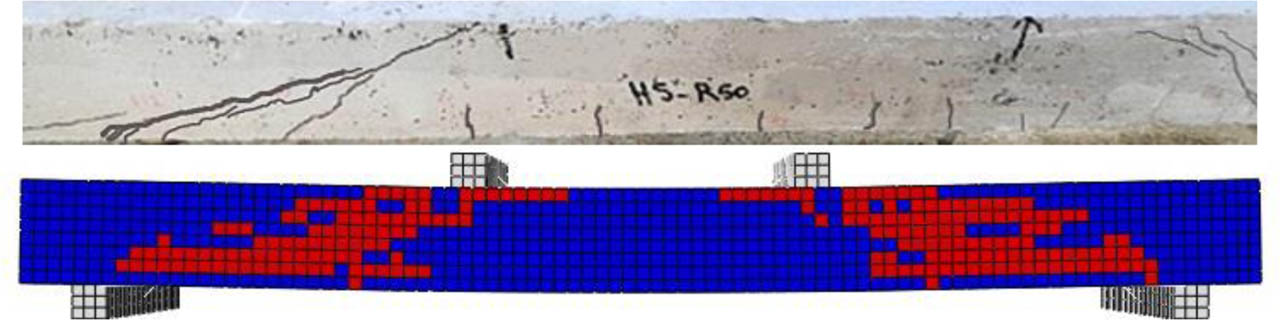
Figure 24:
Shear failure of the hollow-core slab specimen, HS-R50
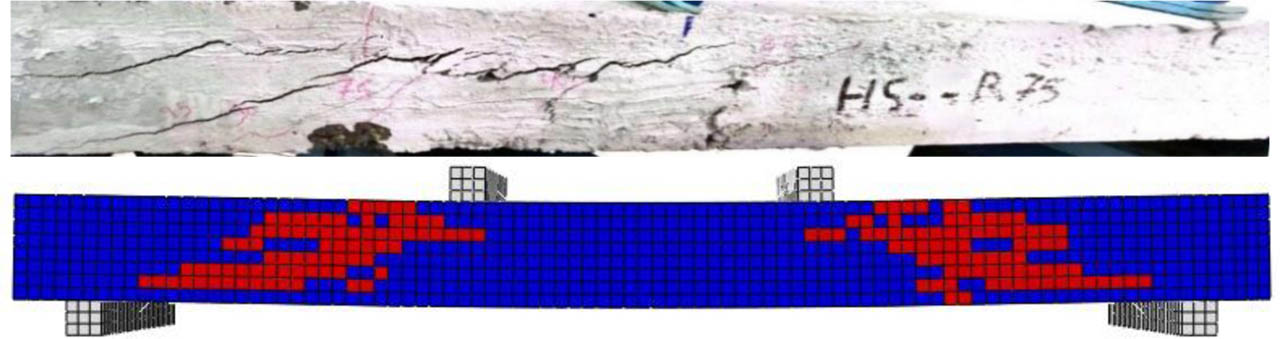
Figure 25:
Shear failure of the hollow-core slab specimen, HS-R75
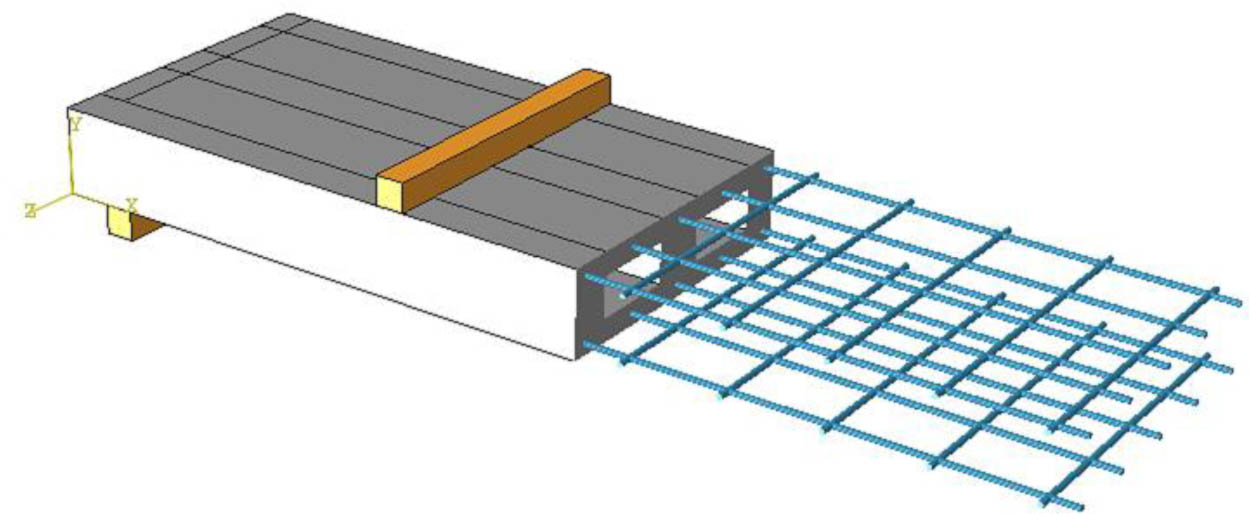
Figure 26:
Changing the reinforcement ratio
Table 5:
FEA results of slab specimens upon changing the reinforcement ratio
| Slab ID | ρ= 0.499 | ρ=1.248 | ||||||||||
|---|---|---|---|---|---|---|---|---|---|---|---|---|
| Pcr | Δcr | Py | Δy | Pp | Δp | Pcr | Δcr | Py | Δy | Pp | Δp | |
| SSR | 27.02 | 0.732 | 101.51 | 8.21 | 109.22 | 25.08 | 30.17 | 0.73 | 160.16 | 9.20 | 170.42 | 20.66 |
| HS-R0 | 23.95 | 0.718 | 87.41 | 8.18 | 95.29 | 21.74 | 27.07 | 0.73 | 139.66 | 9.70 | 155.88 | 25.92 |
| HS-R25 | 21.58 | 0.684 | 83.33 | 8.29 | 90.45 | 20.70 | 25.72 | 0.73 | 135.53 | 10.03 | 148.18 | 12.36 |
| HS-R50 | 20.35 | 0.638 | 81.76 | 8.35 | 88.73 | 20.97 | 22.76 | 0.64 | 132.79 | 10.58 | 134.50 | 11.04 |
| HS-R75 | 17.46 | 0.594 | 77.63 | 8.56 | 83.75 | 21.54 | 19.69 | 0.59 | not yield | 116.03 | 9.64 | |
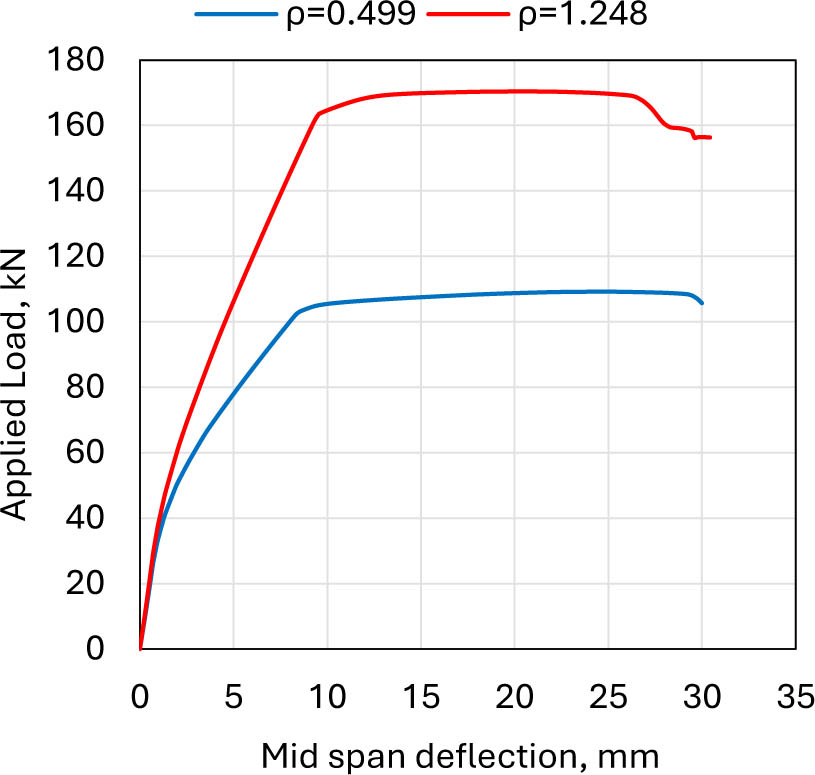
Figure 27:
Load-deflection of solid slab, SSR for the two reinforcement ratios
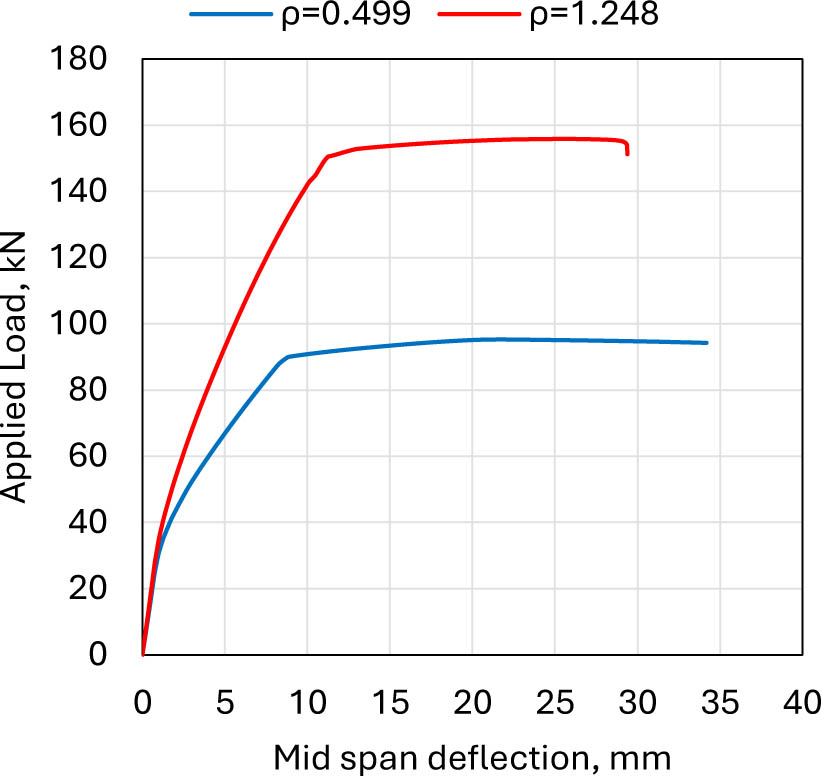
Figure 28:
Load-deflection of hollow core slab, HS-R0, for the two reinforcement ratios
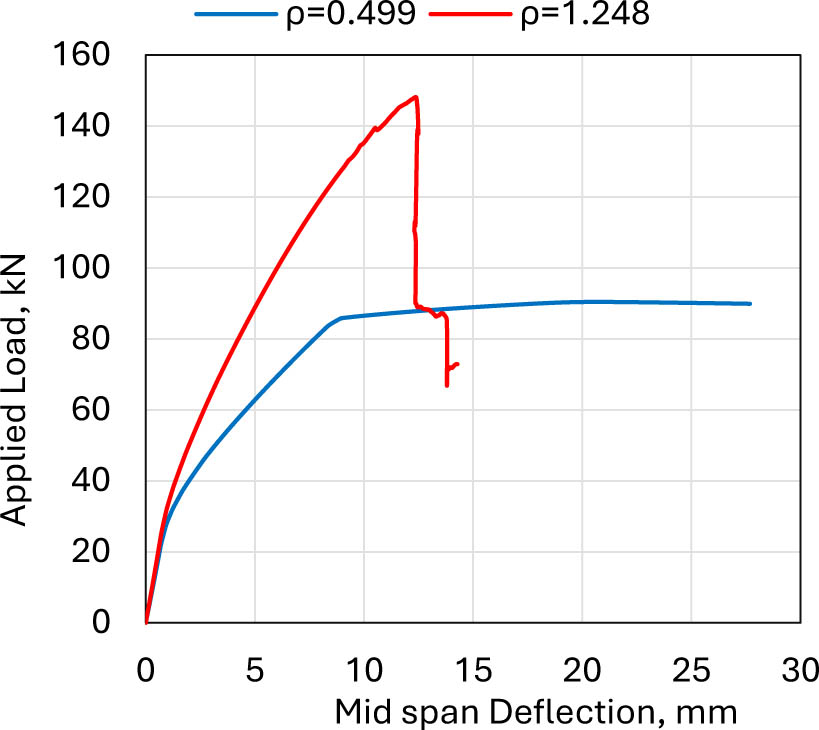
Figure 29:
Load-deflection of hollow core slab, HSR25, for the two reinforcement ratios
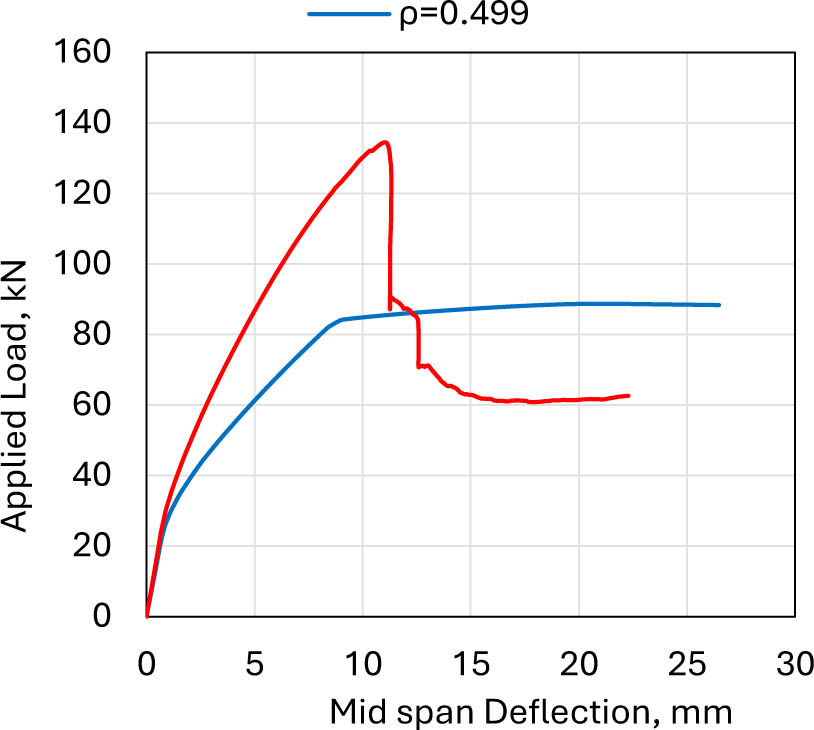
Figure 30:
Load-deflection of hollow core slab, HS-R50, for the two reinforcement ratios
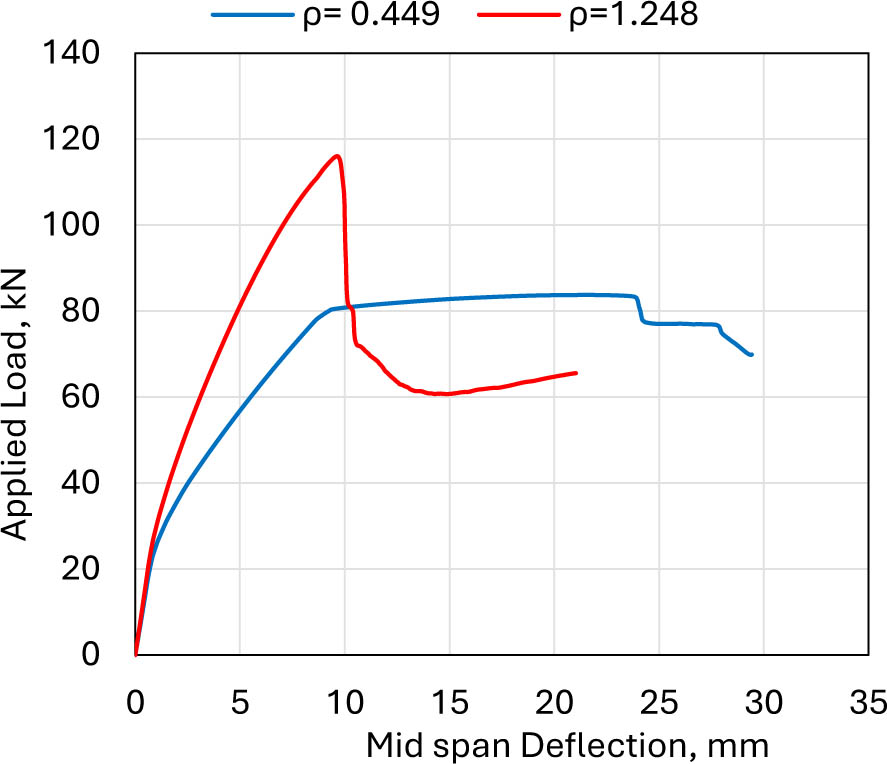
Figure 31:
Load-deflection of hollow core slab, HS-R75, for the two reinforcement ratios
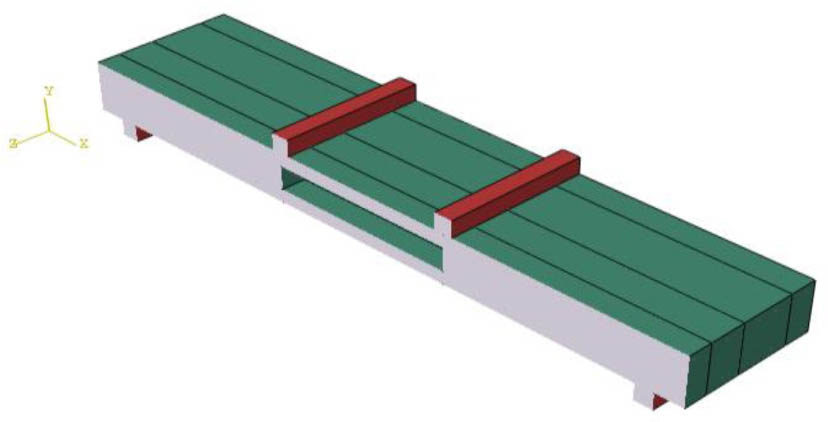
Figure 32:
The second adopted parameter: change the void size by minimizing the length of the voids
Table 6:
FEA results of slab specimens upon changing the void size
| Slab ID | Length of void = 500 mm | Length of void = 1700 mm | ||||||||||
|---|---|---|---|---|---|---|---|---|---|---|---|---|
| Pcr | Δcr | Py | Δy | Pp | Δp | Pcr | Δcr | Py | Δy | Pp | Δp | |
| HS-R0 | 27.63 | 0.72 | 147.09 | 9.10 | 157.85 | 22.47 | 27.07 | 0.73 | 139.66 | 9.70 | 155.88 | 25.92 |
| HS-R25 | 25.27 | 0.69 | 143.26 | 9.19 | 154.07 | 22.44 | 25.72 | 0.73 | 135.53 | 10.03 | 148.18 | 12.36 |
| HS-R50 | 23.74 | 0.64 | 140.85 | 9.22 | 151.13 | 21.08 | 22.76 | 0.64 | 132.79 | 10.58 | 134.50 | 11.04 |
| HS-R75 | 20.61 | 0.60 | 137.53 | 9.62 | 143.11 | 19.37 | 19.69 | 0.59 | not yield | 116.03 | 9.64 | |
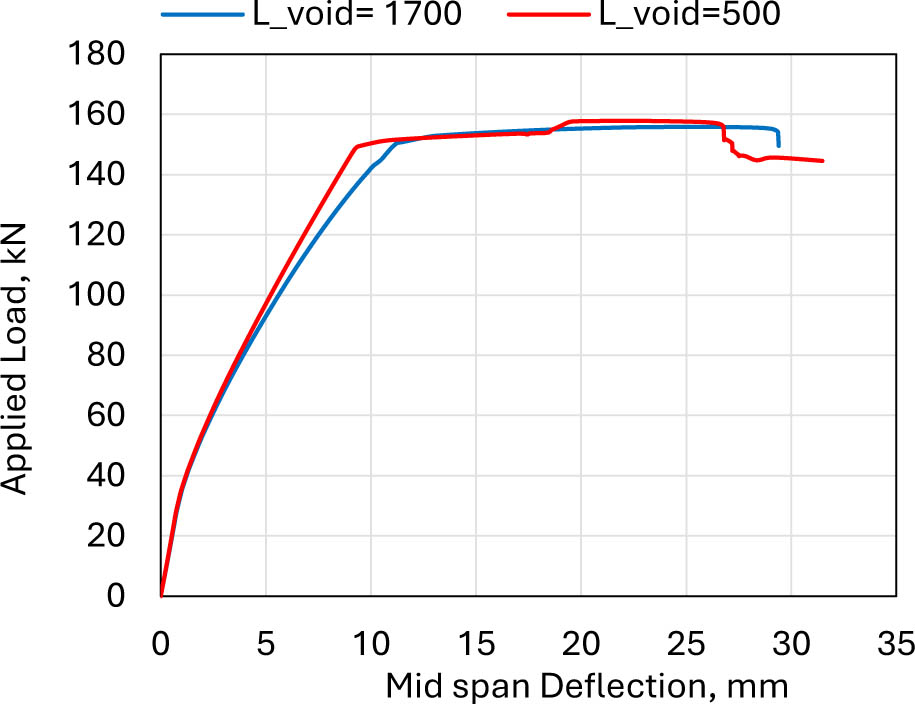
Figure 33:
Load-deflection of hollow core slab, HS-R0, upon changing the voids' size
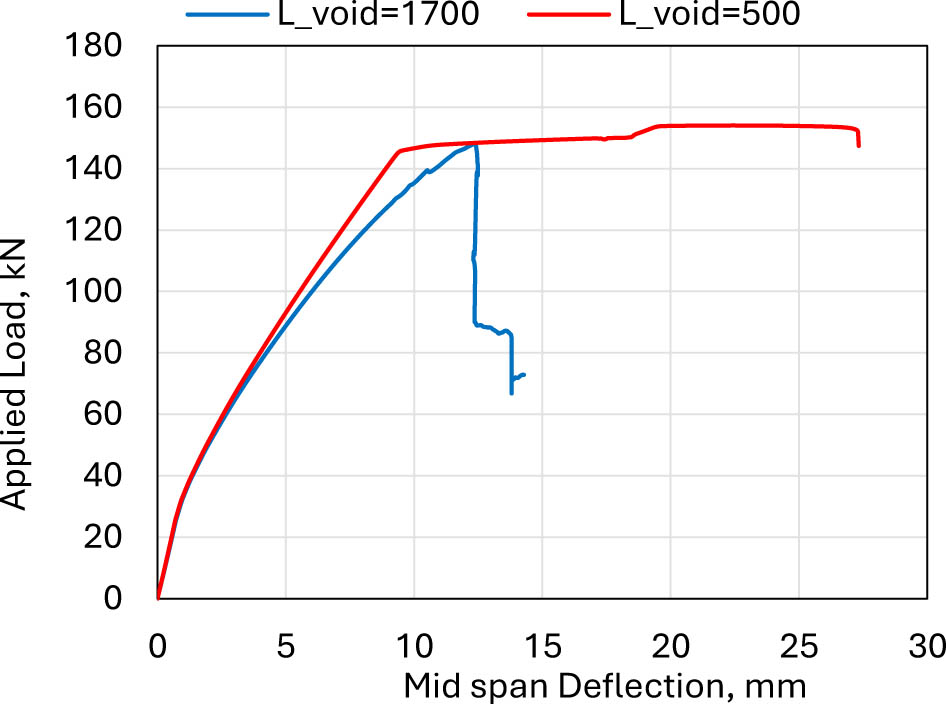
Figure 34:
Load-deflection of hollow core slab, HS-R25, upon changing the voids' size
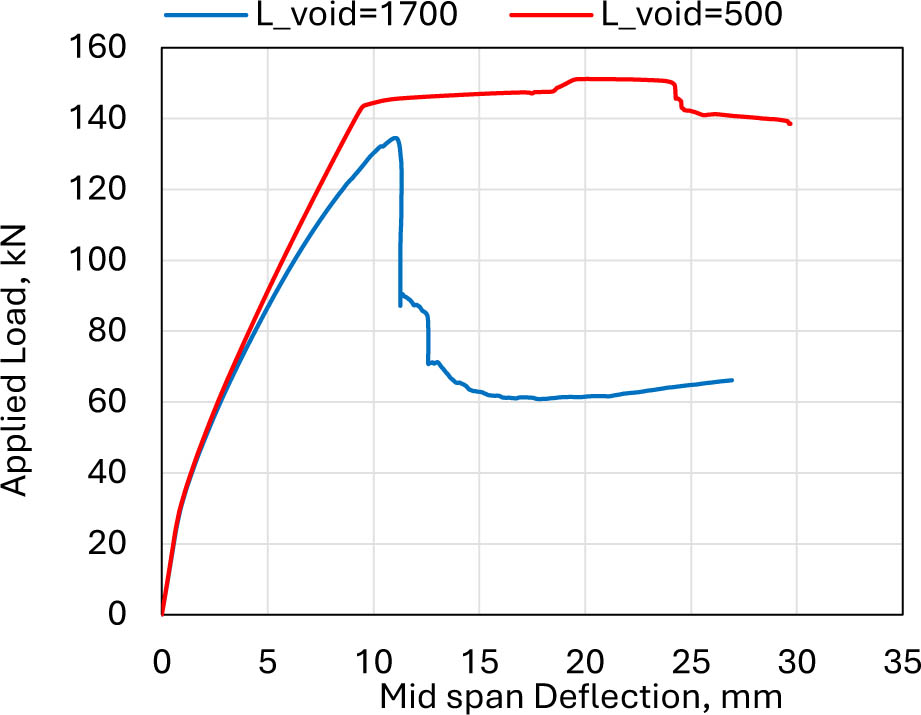
Figure 35:
Load-deflection of hollow core slab, HS-R50, upon changing the voids' size
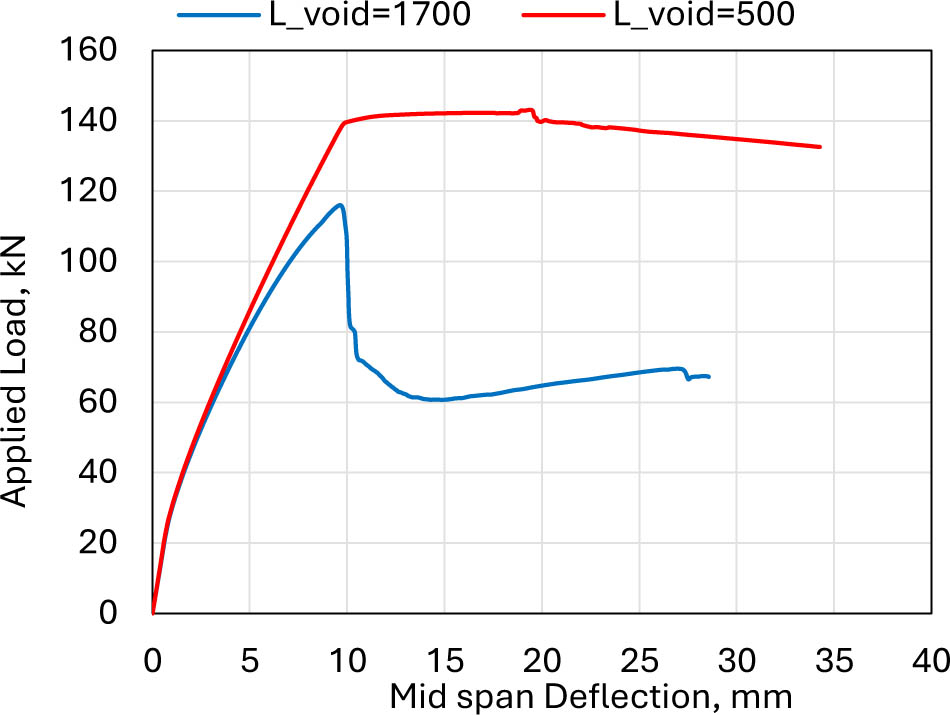
Figure 36:
Load-deflection of hollow core slab, HS-R75, upon changing the voids' size