

1. Introduction
Concrete slabs occupy a relatively large area in reinforced concrete buildings since they serve as floors and roofs. Their large area and the resulting weight they place on other structural elements, such as beams, columns, and foundations, necessitate increasing dimensions and reinforcement of these elements, thus increasing the overall weight of the structure (Khouzani et al., 2020). Furthermore, the increased dead weight of these slabs limits their dimensions to reveal the design limits and to withstand bending and shear stresses and meet the deflection requirements (Al-fakher et al., 2021; Kheder & Al-Windawi, 2005).
Reducing a slab's weight significantly lowers the structure's overall dead weight and positively affects the dimensions of other structural elements, especially the foundation. One method of reducing slab weight is to leave voids in the middle of the slab section, if this does not significantly affect its structural behaviour and load-bearing capacity (Abdulhussein et al., 2023). Many researchers and manufacturers have adopted mechanisms to leave voids within the slab section to reduce its weight while considering its load-bearing capacity. Al-Gasham et al. (2019) investigated the structural performance of reinforced concrete one-way slabs incorporating expanded polystyrene balls of 60, 70, and 90 mm sizes. The findings indicated that slabs with small to medium void ratios showed flexural failure similar to that of solid slabs, with only slight decreases in ultimate load capacity and stiffness. The slab with a larger void ratio reduced the load capacity to 79% and shifted the failure mode from flexural to brittle shear. Mahdi and Ismael (Mahdi & Ismael, 2021) experimentally investigated the structural behaviour of hollow-core reinforced self-compacting concrete one-way slabs, using recycled polypropylene pipes to form longitudinal voids. The results indicated that increasing the longitudinal voids reduced the maximum load and increased the deflection compared to the solid slab. Similarly, increasing the void diameter decreased the ultimate load while increasing the deflection. The materials used to create the cavities vary, as do the shapes of the cavities themselves. Some researchers have used high-density polyethylene spheres (Kanth and Poluraju 2023), while others have used PVC pipes (Hakeem et al. 2021).
Recent experimental work has investigated the flexural behaviour of one-way reinforced concrete slabs with longitudinal hollow cores of polystyrene blocks to reduce the weight by 22.86%. The results showed a decrease in both ultimate load capacity and energy absorption compared to the equivalent solid slab. Increasing the tensile reinforcement ratio from 0.58% to 1.03% improved the load-carrying capacity of hollow-core slabs by up to 44.6%. Overall, the findings showed that longitudinal hollow-core slabs can achieve substantial weight reduction without compromising structural integrity, provided that appropriate reinforcement and steel fibre content are adopted (Al-Bayati et al., 2024).
On the other hand, concrete is one of the most important materials in the construction industry. The consumption of raw materials in concrete production has serious impacts on Earth's environment and life. The concrete industry consumes over 4 billion tons of cement annually (Adesina & Zhang, 2024; Jonny Nilimaa, 2023; Mohamad et al., 2021). Cement production is a major contributor to global warming and environmental pollution because of the release of greenhouse gases, primarily carbon dioxide (Benhelal et al., 2021; Cement, 2011; Grau et al., 2025; Wolfova, 2022). Furthermore, the consumption of raw materials in concrete production itself causes harmful environmental effects. Also, construction and demolition waste has recently become a prime source of environmental pollution (Shkirman et al., 2025). They constitute a significant fraction of the total massive waste produced by human activities. These wastes include residues from building substances, such as concrete, bricks, steel, nylon, plastic, and glass (Ighalo & George, 2020; Omar & Muthusamy, 2021; Xu et al., 2024, Ahmed et al., 2025). Waste processing systems are increasingly stressed, since the huge quantities from construction and demolition processes result in waste being stacked in landfills or randomly thrown down into the soil. This stacking not only deteriorates expanded lands but also contributes to releasing pollutants that affect air, water, and soil quality (Ighalo & George, 2020).
According to the reports of the United Nations Environment Program (UNEP), construction and demolition waste occupies (25% – 30%) of the total global solid waste, annually producing around 2.2 billion tons. This great volume is expected to rise by more than 40% by 2030 due to the acceleration of urban growth (David C. Wilson, 2024; Programme, 2024; Zhang et al., 2024). The U.S. Environmental Protection Agency (EPA) reported that 67% of the waste represents concrete only, making it the most influential ingredient of that waste category (Purchase et al., 2022). Demolished or old concrete waste particularly results in serious environmental challenges, as it is an intensive, heavy substance that is difficult to decompose naturally. Discarded concrete may have unreacted cement or chemical additives, which can migrate into earth layers and groundwater, leading to long-term chemical pollution. Using recycled aggregate from old concrete can reduce environmental impacts and achieve sustainability (David C. Wilson, 2024; Purchase et al., 2022).
This study presents experimental and numerical investigations on five slab specimens: one solid, and four hollow-core one-way slab specimens, to evaluate structural behaviour under four-line loading, and to determine their loading capacity and deflection. Test results include the first-cracking and ultimate load, deflection, and failure mode. Two main parameters were adopted in this study. The first parameter was comparing the impact of longitudinal and transverse voids in the slab. The second was the percentage of recycled concrete aggregate (RCA) to replace the normal coarse aggregate (NCA). There were four percentages: 0%, 25%, 50%, and 75%.
2. Experimental Program
2.1. Slab Specimens
Five RC slabs with identical dimensions of (550x1800) mm and a 150 mm thickness were cast: a solid reference slab with no cavities, cast by a reference mix that had no RCA. One hollow-core slab was cast using reference concrete, without replacing the NCA with RCA. Three hollow-core slabs were cast using RCA at 25%, 50%, and 75%. The specimens were coded as follows: the solid slab was coded as SSR, which stands for the reference solid slab. HS refers to hollow-core slab, and R denotes the RCA percentage. For example, HS-R0 represents a hollow-core slab with no RCA replacement. HS-R50 is a hollow-core slab with 50% RCA replacing NCA. Table 1 lists all slab specimens cast throughout this study, with their identification symbols and the mixing proportions used. Only one slab was tested per configuration; therefore, the work was carried out with precision and high control.
Table 1:
Slab types that are adopted in this study, with their mix proportions
| Group | No. | Slab ID | Mix type | Slab type | Material proportions | |||||
|---|---|---|---|---|---|---|---|---|---|---|
| Cement | Water | RCA | NCA | Fine aggregate | SP | |||||
| I | 1 | SSR | MR | Solid | 450 | 225 | 0 | 850 | 820 | 2.25 |
| II | 2 | HS-R0 | MR | Hollow | 450 | 225 | 0 | 850 | 820 | 2.25 |
| 3 | HS-R25 | M1 | Hollow | 450 | 225 | 212.5 | 675.5 | 820 | 4.5 | |
| 4 | HS-R50 | M2 | Hollow | 450 | 225 | 425 | 425 | 820 | 5.625 | |
| 5 | HS-R75 | M3 | Hollow | 450 | 225 | 675.5 | 212.5 | 820 | 6.75 | |
2.2. Material Properties and Mixed Proportions
According to the parameters adopted in this study, which included replacing a proportion of NCA with an RCA, four concrete mixes were produced to cast five slab specimens. The mix consists of 450 kg/m3 ordinary Portland cement (ASTM Type I), as illustrated in Table 1. The cement was conformed to ASTM C150-16 (ASTM International, 2015) and to the Iraqi Standard Specification (IQS N0.5, 2019) (CASQC, 2019). 820 kg/m3 natural fine aggregate with a fineness modulus of 2.53, and a bulk density of 1660 kg/m3 conforms to the Iraqi specifications No. 45/1984. Water content was 225 kg/m3. The coarse aggregate was variable, as illustrated in Table 2. Natural crushed gravel was used as an NCA in the mixtures. The maximum gravel size was 14 mm, with a bulk density of 1577 kg/m3. It was consistent with the Iraqi Specifications No. 45/2021. The recycled concrete aggregate was produced by crushing old cubes (150 mm) that underwent laboratory testing. Concrete cubes were crushed using a steel hammer and a crushing machine, then sieved to determine the size of the coarse aggregate. The remaining aggregate on a 4.75 mm sieve and passing through a 14 mm sieve was used as coarse RCA. The compressive strength of the concrete cubes used to produce RCA ranged from 20 to 25 MPa. The RCA was sieved to achieve the required grading in compliance with ASTM C33 (ASTM C33, 2018). The RCA bulk density was 1370 kg/m3 with a water absorption coefficient of 5%, and it was used in an SSD state to reduce the absorption of mixing water. Figure 1 shows the gradation of the three types of aggregate used.
Table 2:
Experimental test results of slab specimens
| Slab ID | Mix type | f'c MPa | fspt MPa | Slab type | Experimental results | Failure type | |||
|---|---|---|---|---|---|---|---|---|---|
| 1st cracking | Peak state | ||||||||
| Pcr, kN | Δcr, mm | Pp, kN | Δp, mm | ||||||
| SSR | MR | 39.81 | 4.94 | Solid | 41.25 | 1.70 | 170.846 | 18.492 | Flexure |
| HS-R0 | MR | 39.81 | 4.94 | Hollow | 31.57 | 1.98 | 148.686 | 18.864 | Shear |
| HS-R25 | M1 | 39.55 | 4.40 | Hollow | 37.84 | 1.04 | 148.182 | 12.17 | Shear |
| HS-R50 | M2 | 35.5 | 4.10 | Hollow | 35.04 | 0.94 | 135.762 | 10.723 | Shear |
| HS-R75 | M3 | 30.24 | 3.83 | Hollow | 27.34 | 1.30 | 111.078 | 15.779 | Shear |
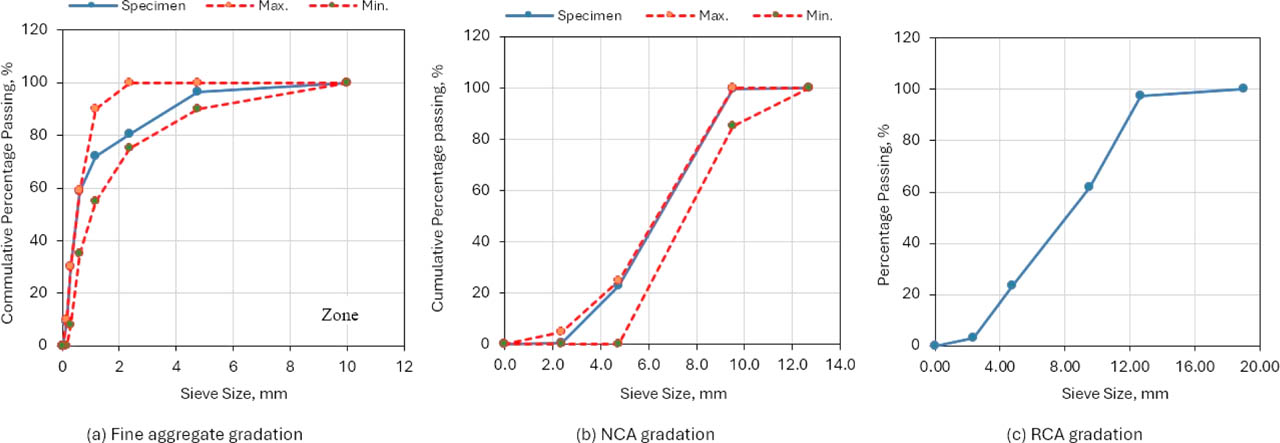
Figure 1:
Sieve analysis of the fine aggregate, normal coarse aggregate, and recycled concrete aggregate
Using RCA in the mix reduces concrete workability; therefore, superplasticizers are used to improve fresh and hardened properties (Abdulkareem et al. 2024). Sika ViscoCrete-180 GS (Sika corporation, 2022), a high-range water reducer, retarder, and slump retainer, was used as a superplasticizer to modify the workability of fresh mixtures. It conforms to the requirements of ASTM C494-Type F and G (ASTM C494, 2017). The superplasticizer dosage was varied following the replacement ratio of RCA. Increasing the percentage replacement of recycled concrete aggregate reduces the workability of the fresh concrete mix. This is due to the recycled aggregate's ability to absorb the mixing water. However, in this study, the water-to-cement ratio was maintained constant at 0.5%, while workability was modified by increasing the superplasticizer content. Ordinary potable tap water was used for all mixtures and to cure all the specimens.
The slab was reinforced with a relatively high reinforcement ratio of 1.248% to compensate for the effect of the voids in the hollow-core slab. The slab was reinforced with 10 mm-diameter bars distributed in a grid pattern in two layers. The main reinforcement was in the longitudinal direction because the slab test will be done longitudinally, considering a specimen from the entire slab. The spacing between longitudinal bars was 50 mm, and the spacing between transverse bars was 85 mm, as illustrated in Figure 2. The concrete cover was 20 mm from all directions. The yield stress of the rebar was 590 MPa, the ultimate strength was 690 MPa, and the maximum elongation was 11.93%.
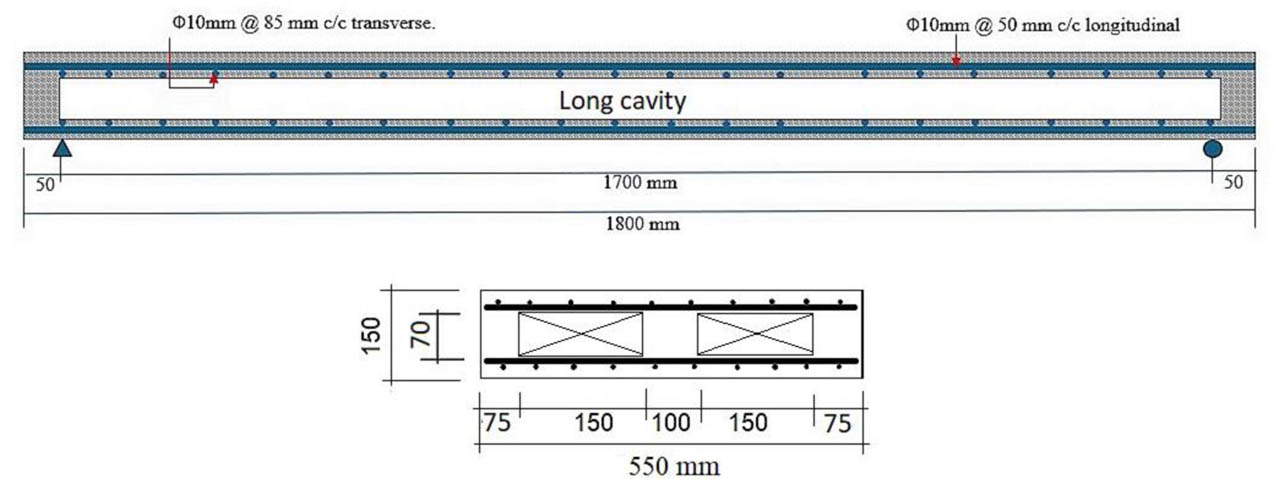
Figure 2:
Longitudinal and transverse sections of the hollow-core one-way slab
2.3. One-way Hollow Core Slab Details
A one-way slab was designed according to the ACI Code, and a specimen of this slab with (1800 x 550) mm dimensions was selected for experimental testing due to the limited width of the available testing apparatus.
Cavity distribution in a one-way slab depends on the orientation of the stress transfer through the slab sections upon loading. To achieve optimal performance of the hollow-core slab, the direction of the cavities should be chosen to minimize their impact on bending moment resistance. Therefore, it is convenient to distribute cavities in the long direction of the specimen, along the secondary rebars' directions, since the stress transfer is in the short side direction, where the loads transfer in the short direction in the one-way slab. The short direction resists the maximum bending moment; thus, the main reinforcement is in the short direction.
Two (1700 × 150) mm cavities with a thickness of 70 mm were adopted to manufacture the hollow-core one-way slab. The presence of these voids reduced the slab's weight by 24% of. Figures 2 and 3 illustrate the cavity arrangement in the slab. Styrofoam was used to create voids in the slab. Styrofoam is the trade name for expanded polystyrene, a lightweight plastic material. It is typically white and has an extremely low density. It is a brittle material that has low elasticity. It has good thermal insulation and is chemically stable.
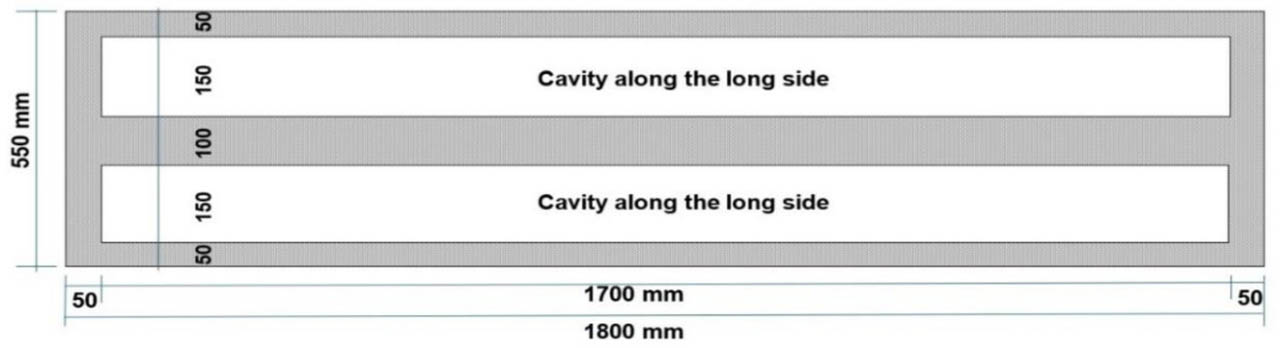
Figure 3:
Arrangement of cavities in the slab to make a hollow-core one-way slab
3. Experimental Results and Discussion
3.1. Test of a Cavity Direction in the Long Direction Versus the Short Direction
Before commencing the practical work and to demonstrate the effect of the cavity orientation on the slab's structural behaviour, a finite element analysis was conducted using Abaqus software on two identical slabs having the same dimensions as the adopted one: the first containing openings in the longitudinal direction and the second containing openings in the transverse direction, as illustrated in Figure 4. Two longitudinal cavities, with section dimensions of (150 × 70) mm, were used as longitudinal openings, while six transverse openings of (170 × 70) mm were used as transverse openings in the short direction, as depicted in Figure 5. Both types reduce the slab weight by approximately 24%. All the criteria and parameters required for the Abaqus analysis were identical for both slabs. The analysis results showed that when the cavities were placed longitudinally, the maximum load-bearing capacity was 104 kN and the maximum deflection was 8.5 mm, whereas when cavities were placed transversely, the load-bearing capacity was 82.9 kN and the maximum deflection was 11.5 mm. The directions and number of cracks also differed. The analysis shows that the longitudinal cavities yield better structural behaviour; therefore, the cavities were oriented longitudinally in the experiments.
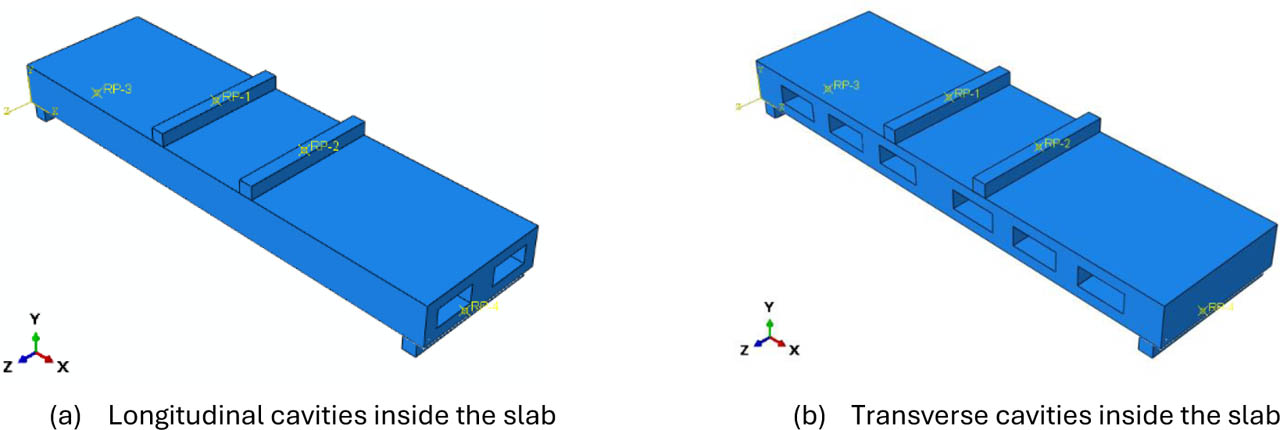
Figure 4:
The orientation of openings in the slab
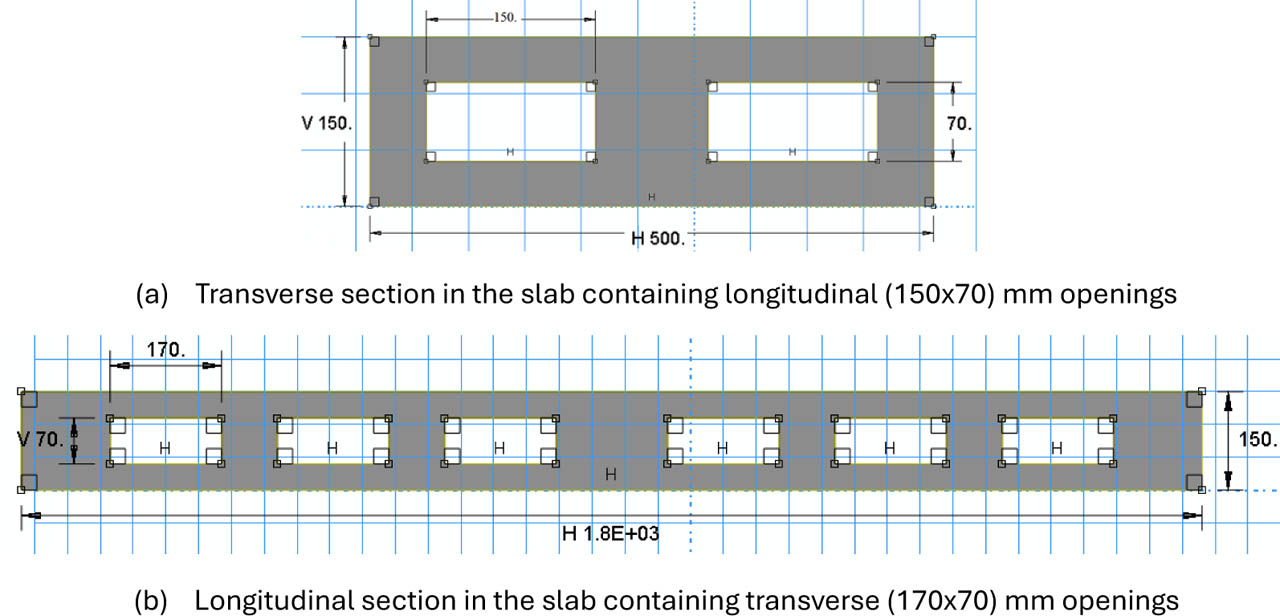
Figure 5:
Sections in the analysed slabs
3.2. The Test Results of the Slab's Specimens
All slab specimens were tested under four-point loading with a shear span of 550 mm on both sides of the slab. The load was applied to a steel beam-frame using a manual hydraulic jack, and the load was distributed and transmitted to the slab by two equal line loads spaced 500 mm apart. The specimens were placed on the testing frame and supported by roller lines along two edges with a 1600 mm clear span, as shown in Figure 6. The static load was gradually increased in increments of 5–10 kN until it collapsed. A canister load cell was inserted between the hydraulic jack and the distributed loading plate to record the applied load. Furthermore, the specimens' central deflection was recorded using a linear variable differential transducer (LVDT) positioned at the mid-span, below the slab specimen. The load cell and LVDT were connected to a data logger to record the loads and deflections sequentially.
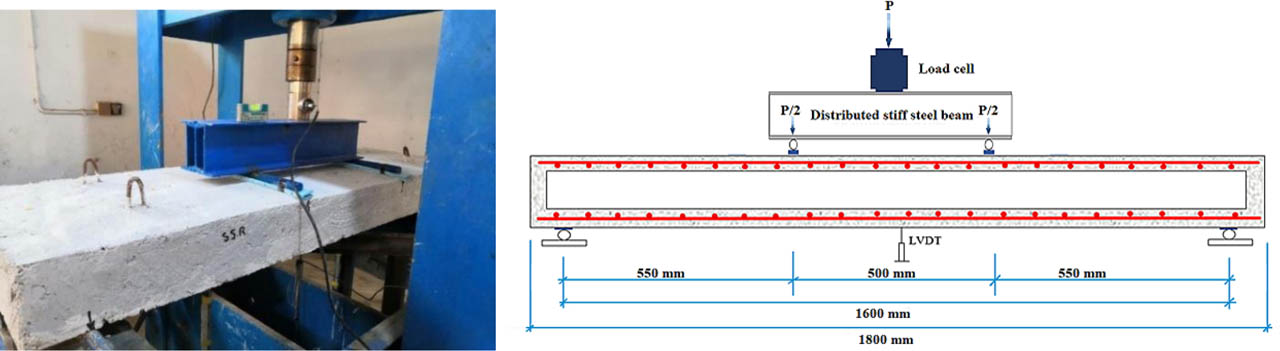
Figure 6:
Test setup of the slab specimen
Table 2 illustrates the results of the experimental tests of the five slab specimens conducted in this study. Test results can be categorized into two groups. The first group includes the solid slab specimen; the second group comprises four hollow specimens with RAC percentages of 0%, 25%, 50%, and 75%.
3.2.1. Load-deflection Behaviour of a Solid Slab Specimen (SSR)
The first visible crack appeared in the tension zone below the mid-slab of the underside, at a load of 41.25 kN with a deflection of 1.704 mm. However, as shown in Figure 7, the linear behaviour of the load-deflection curve changed to nonlinear after a load of 20.8 kN and a deflection of 0.53 mm. This change does not necessarily refer to the occurrence of the first visible crack, which can be attributed to the formation of invisible microcracks in the tension zone that reduce stiffness, but cannot be recorded as the first visible crack. Also, bond slip between rebar and concrete may occur at relatively low loads, causing increasing deflection without an accompanying increase in load. The peak load sustained by the solid slab reached 170.85 kN with a corresponding deflection of 18.5 mm. The slab exhibited high stiffness up to approximately half the cracking load, as shown in Figure 7, where the load-deflection curve is closer to the vertical load axis. Then the curve deviates further until it reaches the maximum load. After the maximum load, the deflection increased more than the load-bearing capacity decreased, indicating relatively high ductility and energy absorption due to the high slab reinforcement ratio.
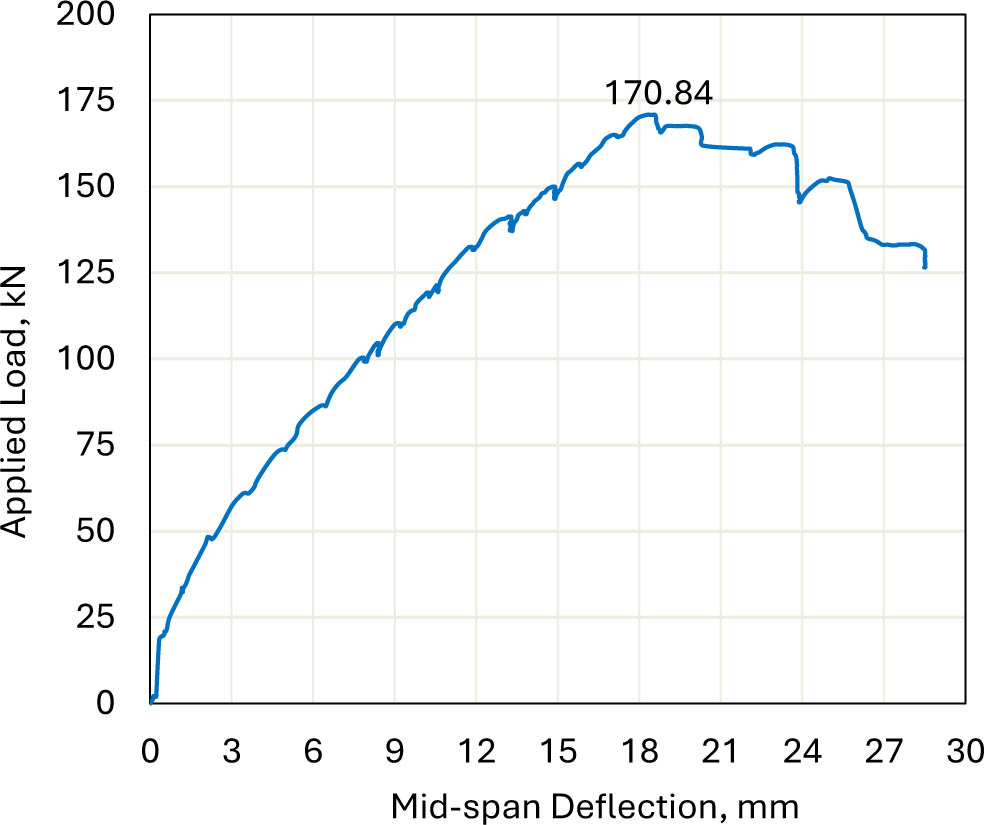
Figure 7:
The load mid-span deflection of the solid slab specimen, SSR
The first crack was followed by the initiation of additional flexural cracks, which extended vertically upwards. Those cracks appeared below the slab's mid-space between the load lines, along with a few cracks in the shear span, but these did not extend for a long distance, indicating a redistribution of stress within the length of the loading span. With increased loading, the flexural cracks began to extend upward and widen. Then the stress concentrated on one of the flexural cracks, which led to failure. The failure type in the solid slab was flexural failure.
The hollow-core slab without replacement NCA by RCA; HS-R0 recorded the highest peak load of 148.69 kN and the highest accompanying deflection of 18.86 mm in the second group. The reduction in weight of the hollow-core slab was 24%, while the decrease in ultimate load-bearing capacity was approximately 13% compared to the solid slab. This indicates that leaving cavities in the slab provides both economic and sustainable advantages, as the reduction in weight relative to the reduction in load-bearing capacity is substantial.
The second specimen in the group, HS-R25, in which the RCA replaced 25% of NCA, recorded a peak load close to that of the slab HS-R0. It recorded 148.18 kN while sustaining a lower deflection of 12.17 mm, which was 65 % of the deflection of the first slab at peak load, as shown in Figure 8. The results show that replacing 25% of the NCA with RCA does not significantly affect the slab's load-bearing capacity, but it has a more pronounced effect on deflection.
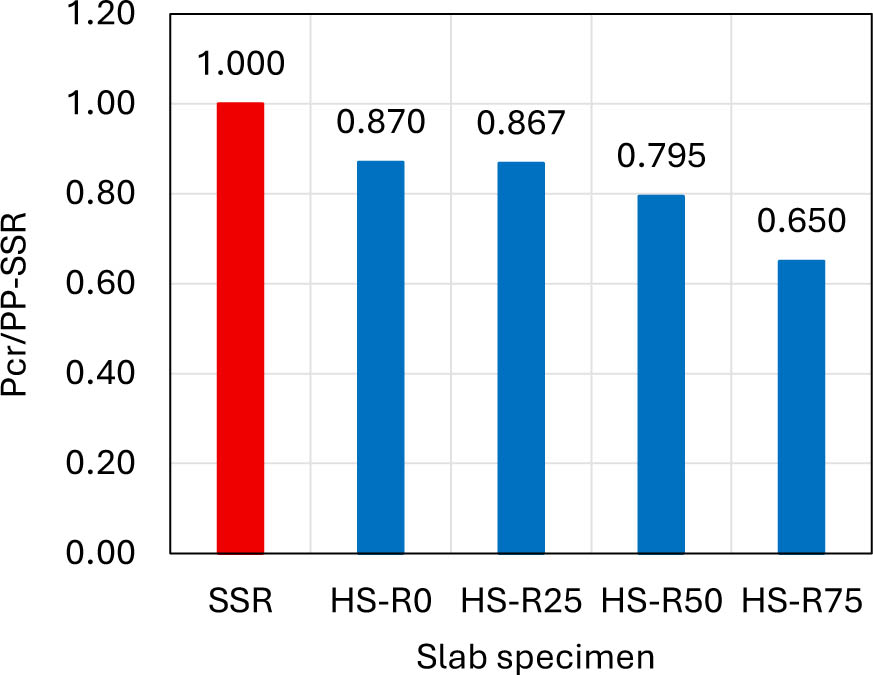
Figure 8:
The ratio of the peak load of hollow specimens to that of the load of the solid specimen
The third specimen, HS-R50, which contains 50 % RCA, endured a peak load of 135.76 kN, which is lower than that of the solid slab by 20.5 % and lower than that of the hollow-core slab without RCA and with 25 % RCA by 8.7 % and 8.4 %, respectively. The accompanying deflection was lower than that of HS-R0 and HS-R25 by 43 % and 11.89 %, respectively, as shown in Figure 8. Again, the reduction in weight compared to the reduction of load-bearing capacity when replacing NCA with 50% RCA is also economical and more sustainable.
The fourth specimen, HS-R75, which contains 75 % RCA, sustained the lowest peak load of 111.08 kN, which is lower than that of the solid slab by 35 %, lower than the hollow-core slab without RCA by 25.3 %, lower than that with 25 % RCA by 25 %, and lower than that with 50 % RCA by 18.2 %, as shown in Figure 8. The accompanying deflection was lower than that of the solid slab, HS-R0, by 14.7 % and 16.4 %, respectively, but it is higher than that of HS-R25 and HS-R50 by 29.7 % and 47.2 %, respectively.
The failure mode of the four specimens was a shear failure caused by diagonal cracking in the shear span between the loading and supporting lines.
The first crack of HS-R0 occurs at 31.57 kN, representing 21 % of the peak load sustained by the slab, as shown in Figure 9. The load-deflection behaviour shows high stiffness up to two-thirds of the cracking load, where the load-deflection curve is closest to the vertical load axis. The curve then deviates further, resulting from increased deflection with increasing load until it reaches the peak load; thereafter, it drops sharply in a straight, sloping direction, as shown in Figure 10. This sharp drop in the softening region of the curve is due to shear failure, which is sudden and brittle. The reason for shear failure in hollow-core slabs is due to the presence of voids in the shear path, where high shear stresses are generated at the loading lines and proceed according to the beam action hypothesis towards the support lines. Since the concrete area in the voids is not adequate, the ability to withstand shear stresses is reduced.
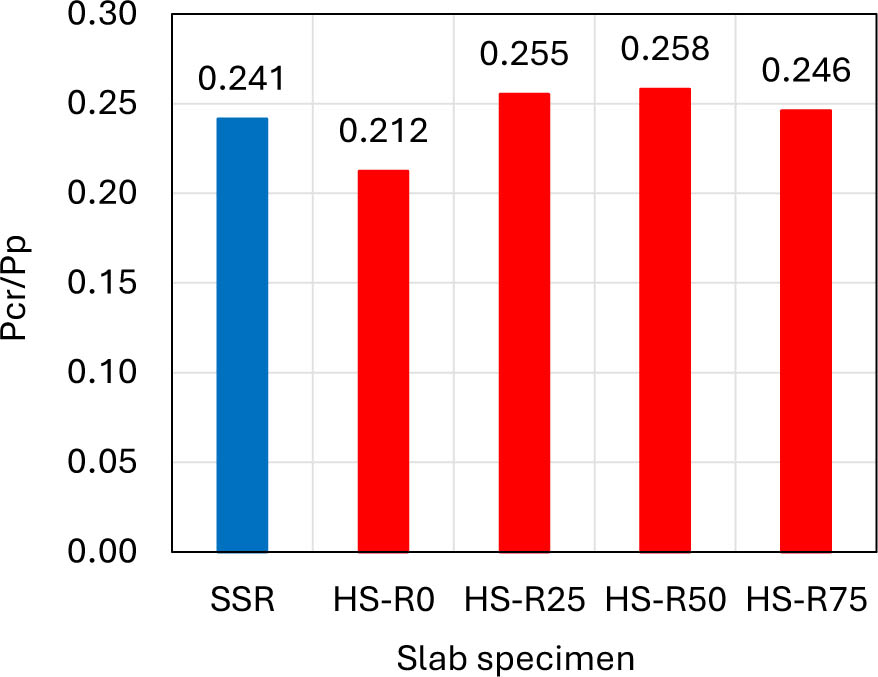
Figure 9:
The ratio of cracking to peak load of the first group of slab specimens
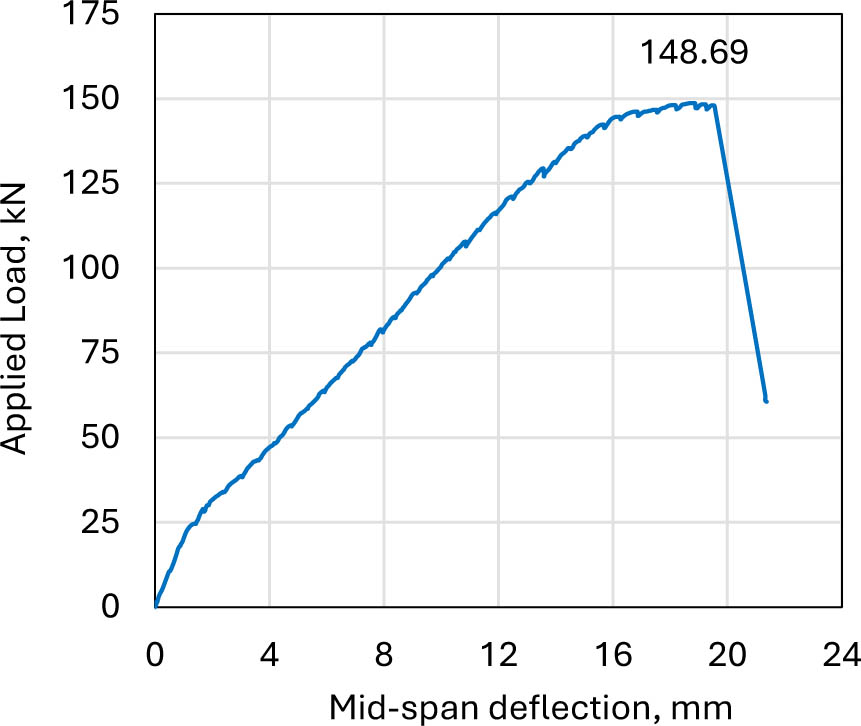
Figure 10:
The load-deflection relationship of HS-R0
The first crack of HS-R25 occurs at 37.84 kN in a flexural zone at the middle span between the two loading lines, which represents 25.5 % of the peak load that is borne by the slab, as shown in Figure 9. A few short and wide flexural cracks emerged at the tension zone. However, upon increasing the load, diagonal cracks initiated and developed in the shear span between the loading and supporting lines, until the stresses accumulated at one or more of the diagonal cracks, leading to shear failure.
The load-deflection behaviour shows high stiffness up to the cracking load, as the load-deflection curve is closest to the vertical load axis. The curve then deviates further because of increased deflection with increasing load until it reaches the peak load; thereafter, it drops sharply in a straight vertical direction, which indicates the loss of ductility, as shown in Figure 11. This sharp vertical drop in the softening region is due to shear failure, which is sudden and brittle.
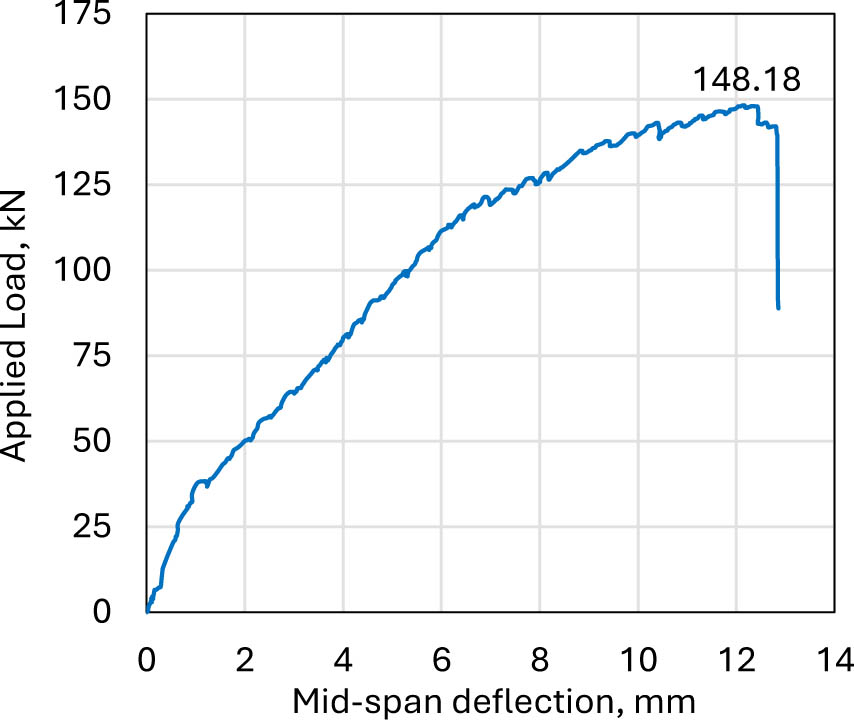
Figure 11:
The load-deflection relationship of HS-R25
The first crack of HS-R50 occurs at 35.04 kN, which represents 25.8 % of the peak load sustained by the slab, as shown in Figure 9. The load-deflection behaviour shows high stiffness up to 40 kN, which is more than the cracking load, as shown in Figure 12. The curve then deviates further because of increased deflection with increasing load until it reaches the peak load; thereafter, it drops sharply in a straight sloping direction, indicating the loss of ductility. This sharp drop in the softening region is due to shear failure, which is sudden and brittle.
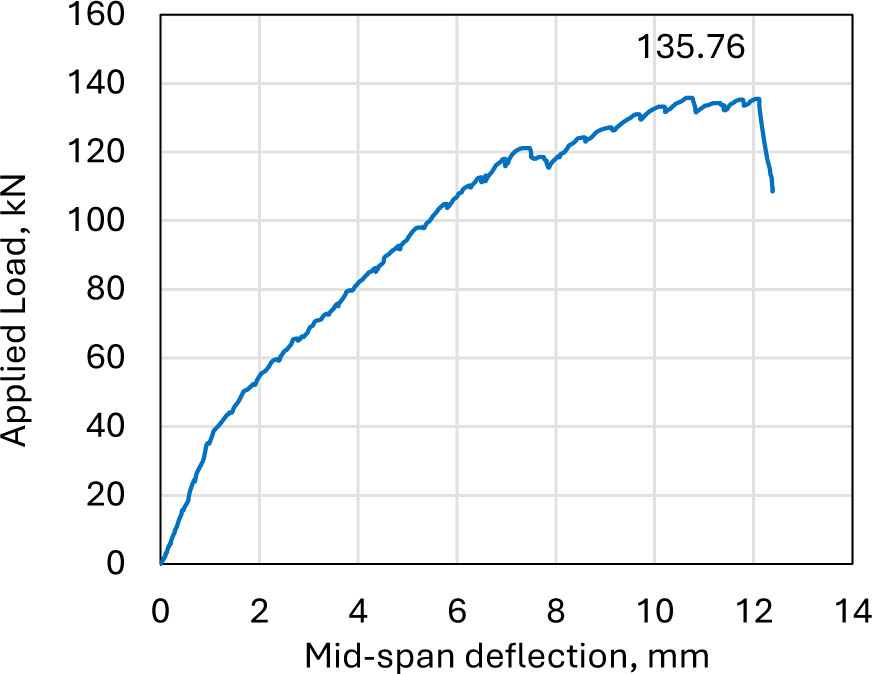
Figure 12:
The load-deflection relationship of HS-R50
The first crack of HS-R75 occurs at 27.34 kN, which represents 24.6 % of the maximum load sustained by the slab, as shown in Figure 9. The load-deflection behaviour shows high stiffness up to the cracking load, as shown in Figure 13. The curve then deviates further because of increased deflection with increasing load. At a peak state, the slab withstood the maximum load with a significant increase in deflection, indicating high energy absorption. That is because of a high reinforcement ratio. Thereafter, the curve drops slightly in the softening region, indicating the loss of ductility at the shear failure.
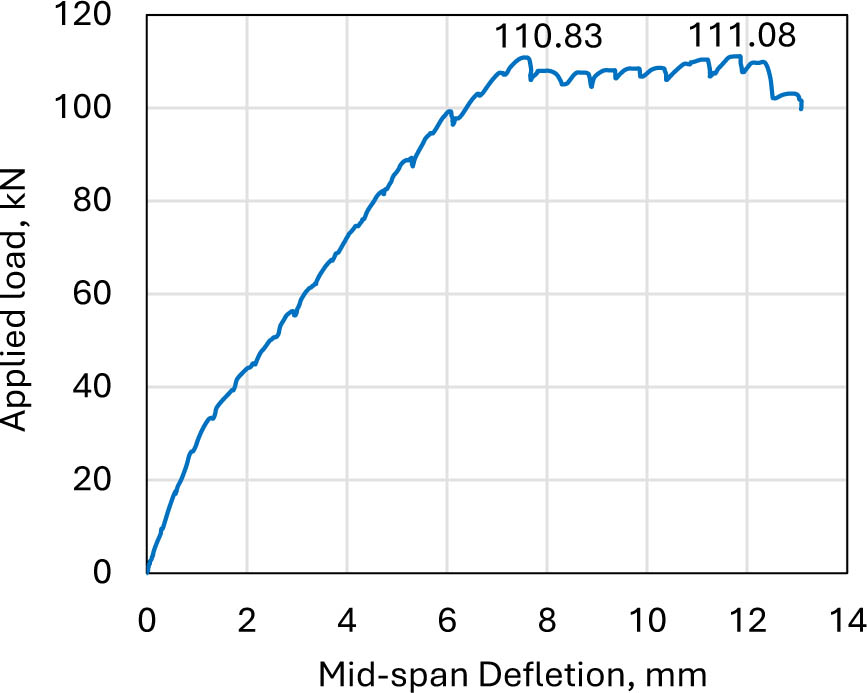
Figure 13:
The load-deflection relationship of HS-R75
The results obtained from practical experiments showed that the deflection of a hollow-core slab under maximum load is lower than that of a solid slab. This can be attributed to several possibilities, the most important being brittle shear failure, which occurs more rapidly than flexural failure, which relates to the concept of shear failure, where diagonal cracks develop rapidly, and the section does not need to bend significantly before failure; therefore, failure occurs at a relatively small deflection. This indicates that the slab does not continue to deform for long after reaching the maximum load, thus reducing deflection.
3.3. Impact of Testing Parameters on the Structural Behaviour of the Hollow-core Slab Specimens
3.3.1. Impact of Voids on the Structural Behaviour of the Hollow-core Slab
The structural behaviour of the slab in flexure includes compressive stresses induced in the region above the neutral axis and tensile stresses in the region below it. This means that the concrete near the neutral axis has a limited contribution to bending. Therefore, removing the concrete from this area reduces the weight with a limited effect on the bending moment, as the concrete above the neutral axis resists compressive stresses and the rebars in the tension zone are responsible for the tensile stresses in the slab section.
The study results showed that the load-bearing capacity of the hollow-core slab was approximately 13% lower than that of the solid slab at peak load, and the cracking load of the hollow-core slab was 23.5% lower than that of the solid slab. Regarding the deflection at peak load, both slabs exhibited almost identical deflection; the solid slab deflected by 18.5 mm and the hollow-core slab by 18.86 mm, as shown in Table 2. This indicates that the presence of the voids has a limited effect on the total deflection of the hollow-core slab.
Despite the cavity between the top and bottom layers of a hollow-core slab, its behaviour remains similar to that of a solid slab. When a load is applied to the slab, it bends. As a result of this bending, the fibres in the top layer shorten, i.e., they withstand compression, while the fibres in the bottom layer elongate, i.e., they withstand tensile stress. These opposing stresses generate bending moments within the slab cross-section. When the moment increases to the cracking moment, flexural cracks develop in the middle lower surface of the slab, where the tensile stresses generated due to bending exceed the concrete's tensile strength. As a result of the flexural cracks and increased applied load, stresses are redistributed along the longitudinal cross-section of the slab, based on the beam action hypothesis. This transfers stresses to the shear span, between the load line and the support line, leading to diagonal tensile stresses, which cause diagonal cracking when diagonal tensile stresses exceed the concrete tensile strength. If there is not enough concrete in the middle of the beam section because of voids, which shorten the path of the cracks, the diagonal cracks will spread faster than the flexural cracks, and this will cause shear failure of the slab. The relatively high reinforcement ratio contributes to enhancing flexural resistance.
3.3.2. Impact of RCA Percentage on the Hollow Core Slab Structural Behaviour
Replacing 25% of the NCA with RCA did not affect the load-bearing capacity of the hollow-core slab, but it caused a 35% decrease in deflection, due to sudden shear failure. While a 50% RCA content resulted in only an 8.7% decrease in the load-bearing capacity of the hollow-core slab, a greater reduction in deflection was reached, 43%. A 75% content had a more significant impact on load-bearing capacity, resulting in a 25% decrease. Therefore, replacing NCA by 25% and 50% does not significantly affect the load-bearing capacity of the hollow-core slab. Furthermore, the high reinforcement ratio of the hollow-core slab increased its load-bearing capacity. Conversely, deflection decreases, and failure is more likely to be of the sudden and brittle shear type.
3.3.3. Impact of Mechanical Properties on the hollow core slab structural behaviour
Table 2 shows the compressive and tensile strengths of the four mixes used to cast the five hollow core slabs. Regarding the effect of replacing NCA with RCA on compressive and tensile strength, the compressive strength decreased slightly, by only 0.66%, when 25% was replaced. The strength decreased further when 50% and 75% of the NCA was replaced with RCA, reaching 12% and 32%, respectively.
As for tensile strength, the impact of replacing NCA with RCA was more pronounced. Tensile strength decreased by 12.3%, 20.5%, and 29% at replacement rates of 25%, 50%, and 75%, respectively.
Since the concrete tensile strength affects cracking initiation in the concrete slab when tensile stresses in the concrete section reach the tensile strength, it impacts the cracking load as well as the ultimate load the slab can sustain. Increasing tensile strength delays the first cracking and distributes cracks to be fine and spaced apart. However, the effect of tensile strength is eliminated after the cracks appear, as the tensile stresses are then transferred to the rebars. On the other hand, compressive strength influences the slab behaviour when stresses are redistributed along the longitudinal section of the slab, based on the beam's action mechanism in stress distribution. Increasing compressive strength increases the slab's ability to withstand higher loads and it also improves the section's shear resistance, as it partially depends on compressive strength. However, shear strength is generally lower in hollow core slabs due to the reduced area of the shear-resistant concrete.
Hollow core slabs with 0% and 25% recycled aggregate exhibited the same maximum load-bearing capacity. When the NCA was replaced with 50% RCA, the slab's load-bearing capacity decreased by 9.5%, which is less than the decrease in compressive and tensile strength (12% and 20.5%, respectively). When the aggregate was replaced with 75%, the slab's load-bearing capacity decreased by 34%, while the decrease in compressive strength was 32%, and the decrease in tensile strength was 29%. Therefore, a 25% replacement rate does not affect the slab's load-bearing capacity, while a 50% replacement ratio has less impact on the slab's load-bearing capacity than on its compressive and tensile strength. One may consider conducting further research using Phase Change Materials (PCM) to reduce the thermal gradient during the curing process of the concrete mixture made from the materials used in the present experiment, as presented in (Hsino and Jankowiak 2022).
3.3.4. ACI Provisions for Shear in One-way Hollow-core Slabs
According to the ACI philosophy, the shear behaviour of one-way hollow-core slabs differs significantly from that of solid slabs. In one-way slabs, including hollow ones, shear strength depends primarily on the concrete, the interlocking mechanism between aggregate particles, and the transfer of forces through the compression zone. It is calculated using the ACI equation.
Where:bw - the effective cross-sectional width.
This is significant in hollow-core slabs, as it represents the sum of the rib thicknesses, not the total slab width. That leads to a decrease in shear strength and stress concentration in the ribs. (d) represents the effective depth between the rebar centre in the tension zone and the top of the compression fibres. Therefore, shear failure in hollow-core slabs is brittle and often occurs without warning. ACI considers increasing the longitudinal reinforcement ratio to indirectly improve shear strength through dowel action, which enhances crack cohesion and reduces crack width.
4. Numerical Analysis of Slab Specimens
The experimentally tested slabs were simulated using the finite element method via Abaqus software to verify the experimental results and to conduct further study on hollow core slabs and identify additional parameters that might affect their behaviour under load in other conditions. Therefore, two additional parameters were considered: the slab reinforcement ratio and the void size.
4.1. Slab's Simulation in Abaqus
The tested specimen consists of a concrete slab, a grid of orthogonal 10 mm rebars, and loading and supporting steel rods. The concrete slab and steel rods are simulated as a 3-dimensional continuum with 8 nodes using reduced-integration (C3D8R); each node has 3 degrees of freedom. Steel rebar is simulated as 2-noded truss elements (T3D2). The C3D8R element can simulate 3-dimensional continuum solids. It can display tensile and compressive behaviour, along with large strains (Al-azzawi and Abed 2016; Jabbar 2023). The T3D2 element is adopted to emulate the one-dimensional steel rebars, assuming only axial strain. Figure 14 depicts the discretization of the slab.
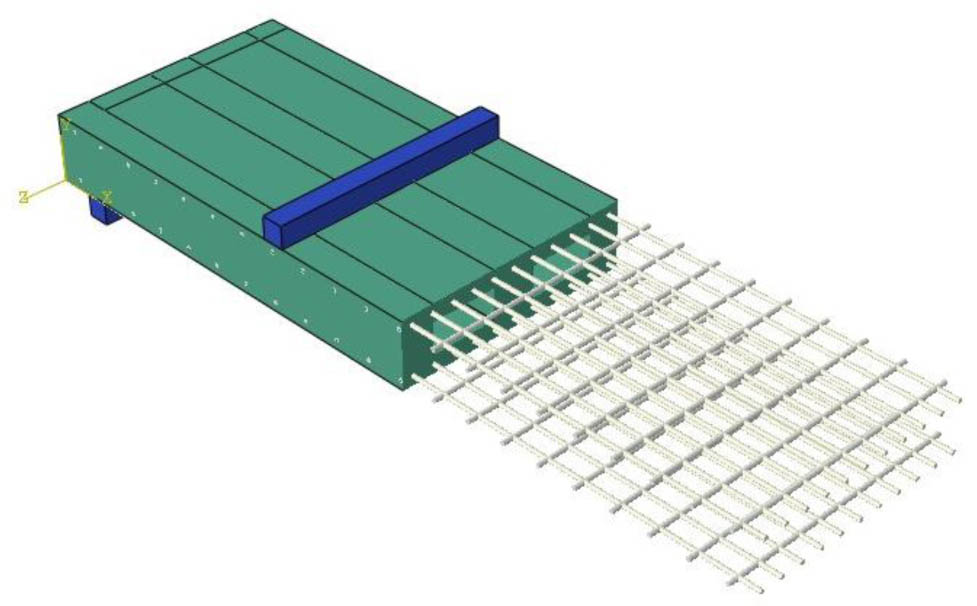
Figure 14:
The simulation of Slab constituents via Abaqus
A concrete-to-rebar interaction characterized by an embedded constraint; the rebar is embedded in the host concrete. The steel rods are constrained as a rigid body to prevent distortion upon loading. The lower steel rods are identified as fixed support by preventing their translation and rotation in all directions. The load is applied at the upper supports as experimentally implemented. The finite elements of all parts are seeded by a 20 mm mesh in the three directions, as shown in Figure 15. The interaction between the steel rods and concrete slab is a surface-to-surface contact with normal behaviour, with hard contact to prevent penetration, and tangential behaviour with a friction coefficient of 0.35 between concrete and steel. The analysis is performed via a static general step.
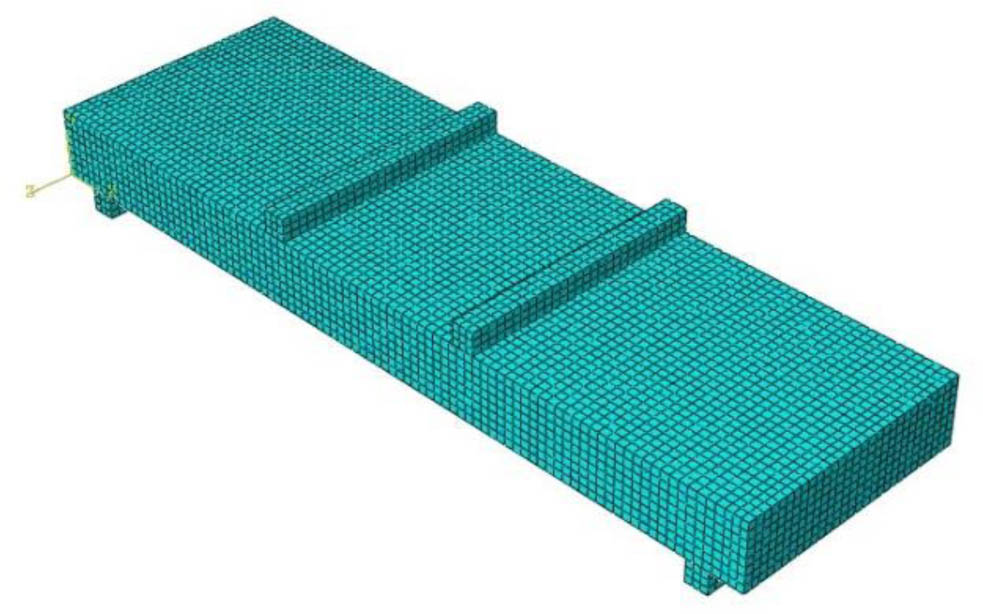
Figure 15:
Meshing of the slab's constituents
4.2. Material Modelling
Elastic modulus and Poisson's ratio describe concrete's elastic behaviour. The concrete damage plasticity (CDP) model is used to describe the concrete plastic behaviour (Simulia 2012; Solhmirzaei and Kodur 2017). The stress-inelastic strain in compression and tension is used to represent the CDP model. Hognestad and EN-1992-1-1: Eurocode 2 formulas are adopted to simulate the compressive stresses and the accompanying strains using the following equations (EN 1992-1-1. Eurocode 2, 2004; Technical Committee CEN/TC250, 2011);
Where:fc – compressive stress at accompanying strain,
ϵci - MPa,
ϵi – elastic strain at 40% of compressive strength,
Ecc – modulus of elasticity, MPa,
ϵplast – plastic strain,
dc = concrete damage parameter.
The steel rebar yield stress is 590 MPa, as experimentally examined.
The five parameters that define the surface failure of the finite element in Abaqus are determined by the dilation angle (ψ), eccentricity (ϵ), the biaxial to uniaxial stress ratio (fbo/fco), the shape factor (K), and the viscosity parameter (μ). The applied values are illustrated in Table 3.
Table 3:
The material properties and parameters applied for simulating the hollow core slabs via Abaqus
| Substance | Properties | |||||||
|---|---|---|---|---|---|---|---|---|
| Concrete | Modulus of elasticity, Ecc | Poisson's ratio | ||||||
| Variable, according to the compressive strength | 0.18 | |||||||
| Dilation angle | eccentricity | fbo/fco | Shape factor | Viscosity parameter | ||||
| 32 | 0.1 | 1.16 | 0.67 | 1E-8 | ||||
| 10 mm steel rebars | Yielding stress | Elastic modulus | Poisson's ratio | |||||
| 590 MPa | 200000 MPa | 0.3 | ||||||
4.3. Model Validation and Analysis Results
The accuracy of the simulated slab specimens using finite element analysis was verified by comparing numerical results with experimental test results.
The compared results included the ultimate load and its accompanying deflection, as well as the cracking load and deflection at cracking, as listed in Table 4. At the peak state, the numerical analysis results awarded remarkably close results to the experimental loads; the ratio between them ranged from 0.95 to 1.01, but concerning the maximum deflection, the percentage differed greatly, reaching from 0.61 to 1.55. At the cracking state, the FE loads underestimate the experimental loads. This discrepancy between experimental results and numerical modelling is quite common in Abaqus, especially when dealing with cracking load in concrete. The reason is due to a combination of factors related to numerical simulation versus actual behaviour. The CDP model assumes concrete is homogeneous and relies on tensile strength that may differ between experimental and numerically represented results due to internal cohesion and the confinement effect of the rebars. Table 4 illustrates the FE and experimental results for solid slab and hollow core slab specimens.
Table 4:
FEA and experimental results of slab specimens at cracking and peak state
| Slab ID | FEA results | Experimental Results | ||||||||
|---|---|---|---|---|---|---|---|---|---|---|
| 1st cracking | Peak state | Yield state | 1st cracking | Peak state | ||||||
| Pcr, kN | Δcr, mm | Pp, kN | Δp, mm | Py, kN | Δy, mm | Pcr, kN | Δcr, mm | Pp, kN | Δp, mm | |
| SSR | 30.17 | 0.73 | 170.42 | 20.66 | 160.16 | 9.20 | 41.25 | 1.704 | 170.846 | 18.492 |
| HS-R0 | 27.07 | 0.73 | 155.88 | 25.92 | 139.66 | 9.70 | 31.573 | 1.987 | 148.686 | 18.864 |
| HS-R25 | 25.72 | 0.73 | 148.18 | 12.36 | 135.53 | 10.03 | 37.837 | 1.04 | 148.182 | 12.17 |
| HS-R50 | 22.76 | 0.64 | 134.50 | 11.04 | 132.79 | 10.58 | 35.04 | 0.94 | 135.762 | 10.723 |
| HS-R75 | 19.69 | 0.59 | 116.03 | 9.64 | Not reached | 27.34 | 1.304 | 111.078 | 15.779 | |
4.4. Load-deflection Behaviour
Figures 16 – 20 illustrate the load-deflection behaviour of all slab specimens. For solid slab, SSR, and hollow HSR0, the slabs show stiff behaviour up to approximately peak load because, in Abaqus, it is assumed that the concrete is homogeneous and free of cracks and voids before loading. Both slabs showed high ductility in numerical analysis, which is due to the high reinforcement ratio that carried the loads beyond the maximum load. The appearance of deflection hardening for a relatively long interval before failure, as analysed via Abaqus, indicates greater energy absorption than is actually observed. This contradicts the practical observation that concrete gradually loses strength after cracking, thus reducing the stiffness of the element due to the decreased stiffness of the constituent concrete. This discrepancy may be attributed to the high reinforcement ratio, which Abaqus numerically assumes a perfect bond between the steel and concrete. This implies that the steel shares 100% of the load-bearing capacity alongside the concrete, resulting in a uniform stress distribution. However, practical experiments have shown slip and bond degradation between the steel rebar and concrete, meaning that the full reinforcement is not utilized in bearing stresses, leading to localized failure. In addition to the effect of the viscosity parameter, which produces artificial continuity and numerical damping, it delays failure and prolongs the hardening interval.
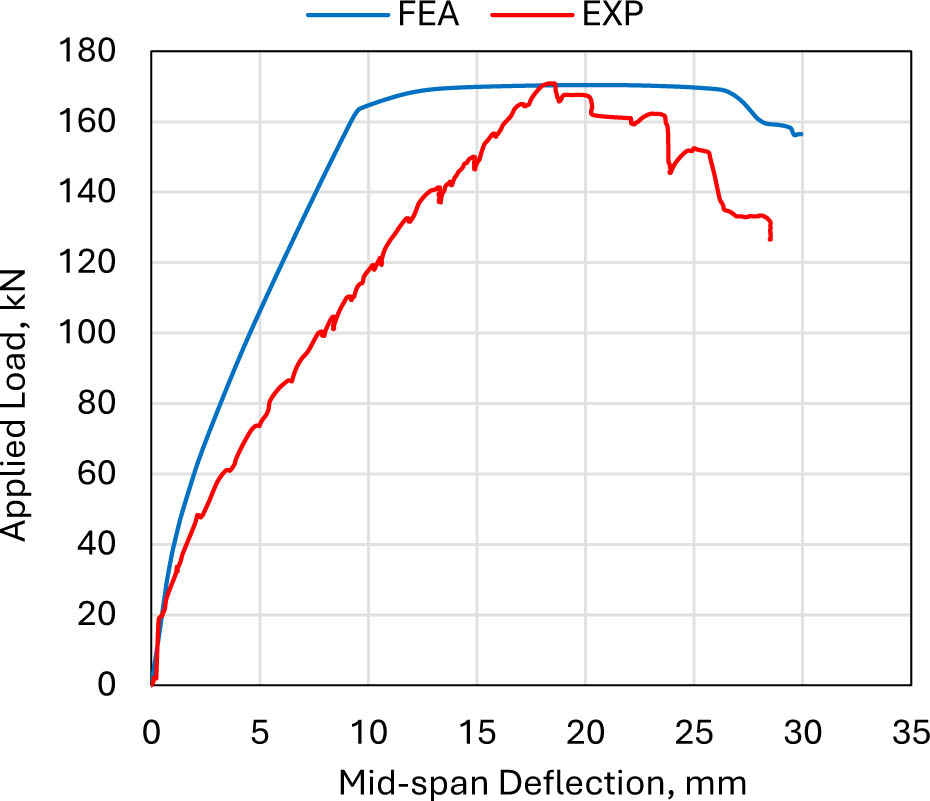
Figure 16:
Load-deflection behaviour of SSR
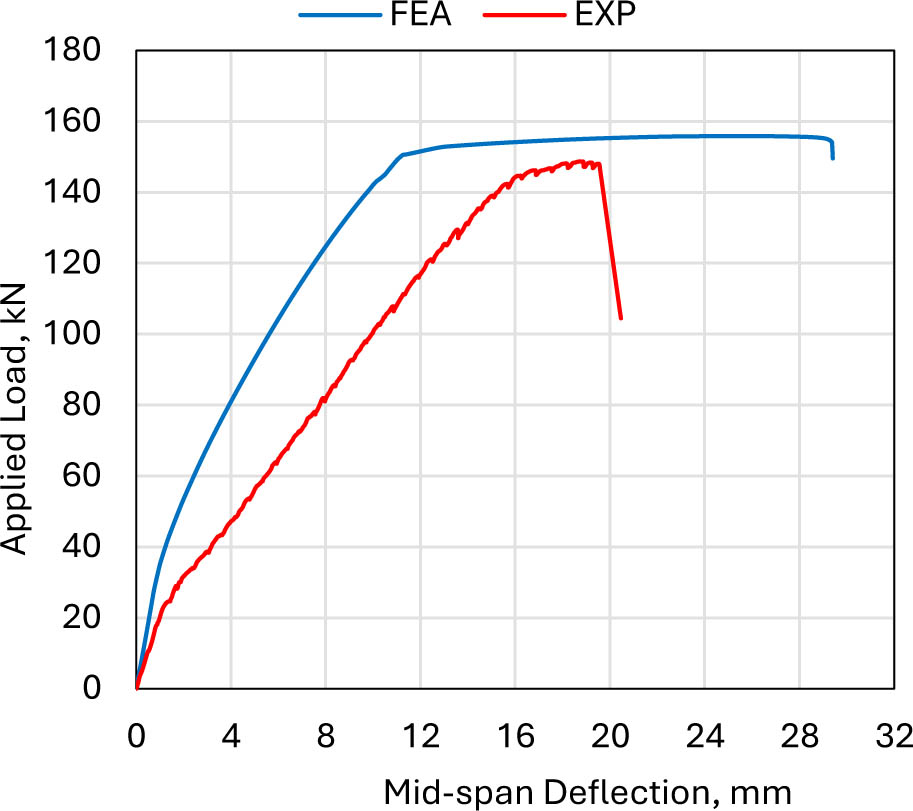
Figure 17:
Load-deflection behaviour of HS-R0
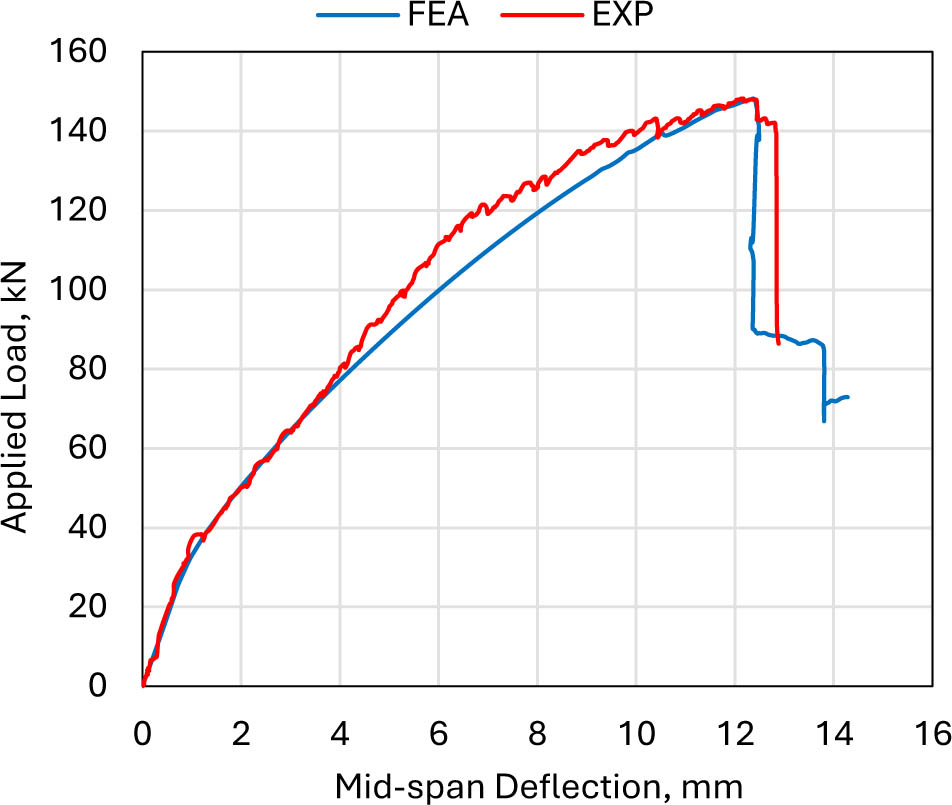
Figure 18:
Load-deflection behaviour of HS-R25
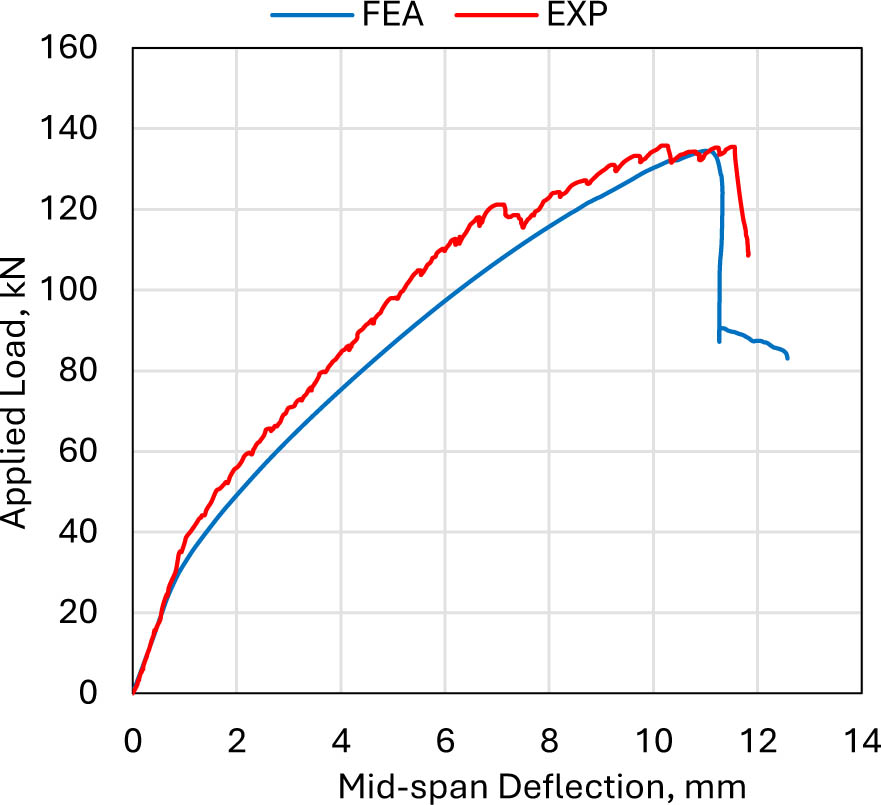
Figure 19:
Load-deflection behaviour of HS-R50
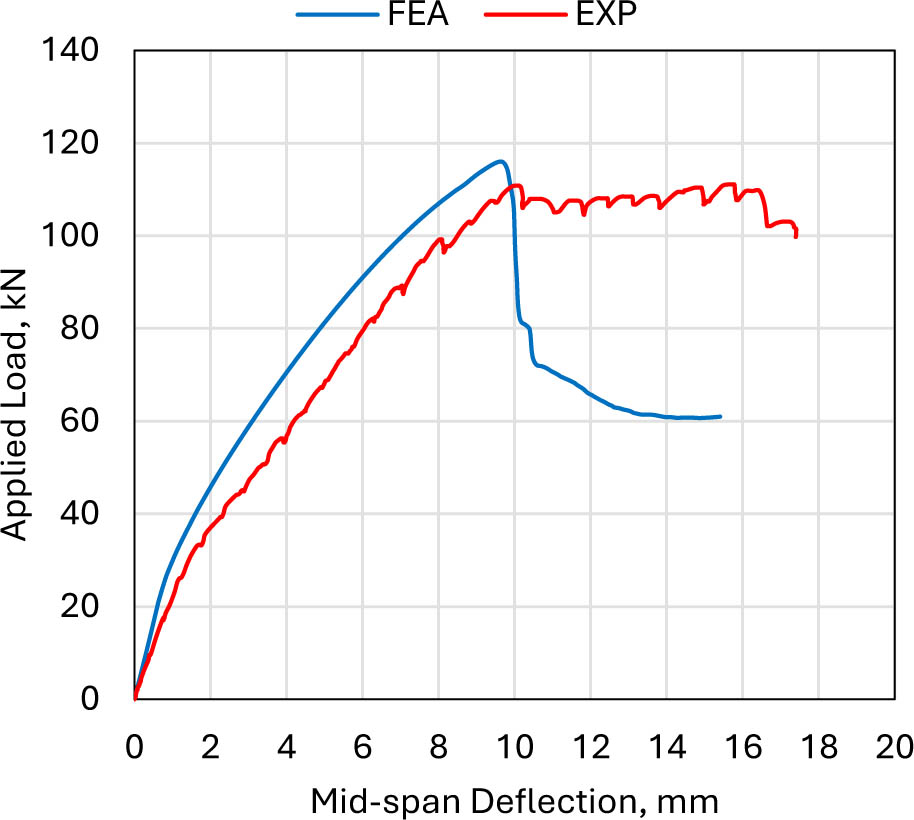
Figure 20:
Load-deflection behaviour of HS-R75
The two hollow core slabs, HS-R25 and HS-R50, show almost identical behaviour in experimental and numerical analysis, as shown in Figures 18 and 19. The hollow-core slab, HS-R75, showed a loss of ductility in numerical analysis after the peak state, whereas the experimental result showed greater ductility and energy absorption. Losing the ductility in the Abaqus analysis may be due to the viscosity parameter value. It is worth noting that all parameter values representing the CDP model in Abaqus were identical for all samples.
According to the numerical analysis results, the ratio of the load recorded when the steel rebar reached the yield stress to the ultimate load ranged between 90–99%; in contrast, the steel rebars in the HS-R75 slab did not reach yield stress. The percentage of yield rebars' load to the peak load was 94%, 90%, 91%, and 99%, for SSR, HS-R0, HS-R25, and HS-R50, respectively. It is observed that the load causing the rebars to yield approaches the maximum load as the percentage of RCA replacement increases or as the concrete compressive and tensile strength decreases.
4.5. Crack Pattern
The failure pattern of the solid slab, SSR, was flexural failure, whereas all other hollow core slabs failed due to shear. The failure pattern was consistent in both numerical analysis and experimental results. In the solid slab, the first cracks appeared in the middle of the lower surface of the slab, and their number increased to represent flexural cracks, which propagated upwards to concentrate in one or more of the middle cracks, causing flexural failure. A few diagonal cracks also appeared in the mid-depth of the slab section in the shear span, but they did not extend further, as shown in Figure 21. In the other four hollow core slabs, the first cracks were due to flexure in the middle span of the slab, but they did not extend upwards. The cracks then initiated into the shear span between the load line and the support line, forming diagonal tension cracks. These diagonal cracks then extended to connect the load line and the support line, causing shear failure, as shown in Figures 22–25.
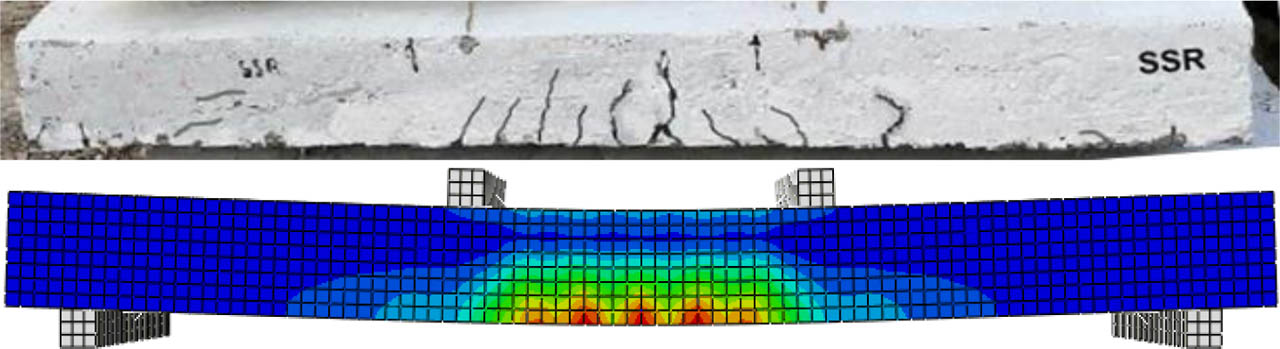
Figure 21:
The failure cracks of the solid slab, SSR
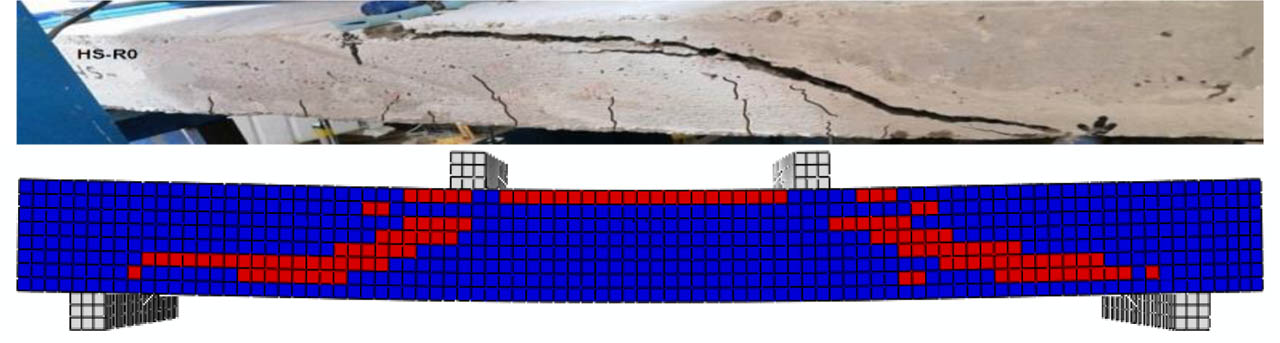
Figure 22:
Shear failure of the hollow-core slab specimen, HS-R0
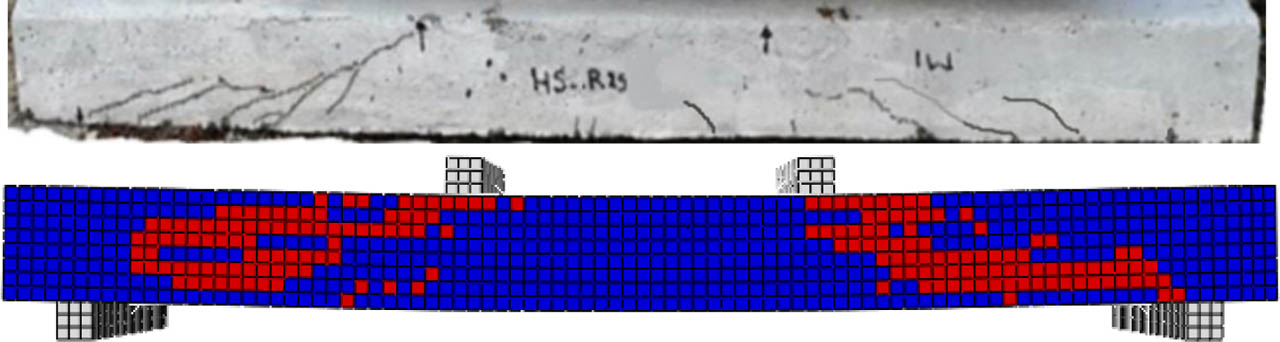
Figure 23:
Shear failure of the hollow-core slab specimen, HS-R25
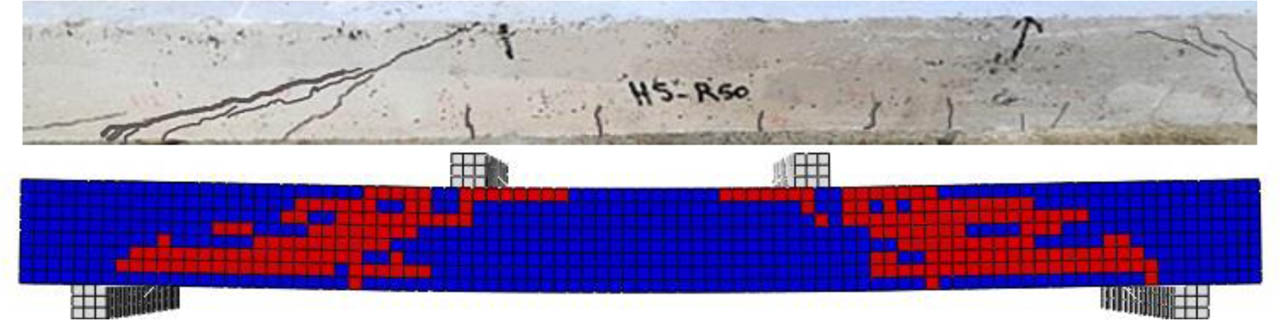
Figure 24:
Shear failure of the hollow-core slab specimen, HS-R50
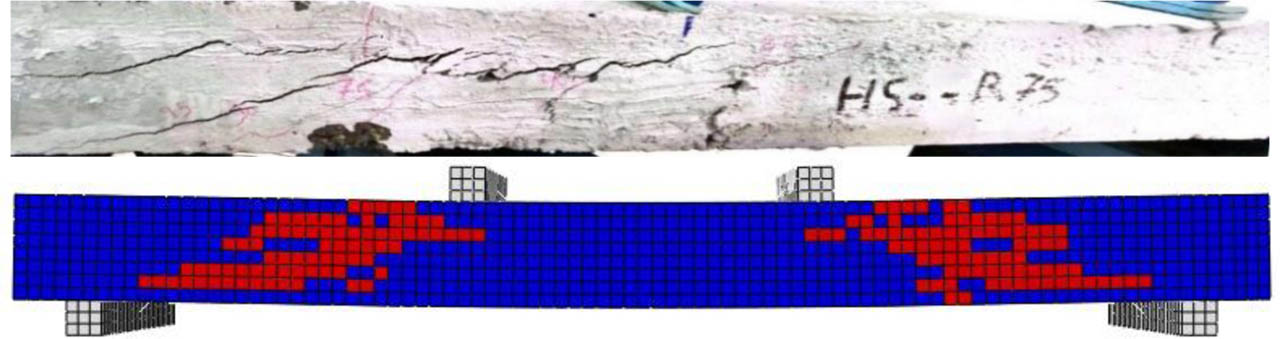
Figure 25:
Shear failure of the hollow-core slab specimen, HS-R75
4.6. Parametric Study
A high reinforcement ratio of 1.248 was adopted in the experimental slab specimens to minimize the effect of voids. To explain the impact of changing the reinforcement ratio on the slabs' behaviour and load-bearing capacity, a numerical analysis was performed to provide an additional parameter.
On the other hand, hollow-core slabs failed due to diagonal-tension cracking and shear failure caused by longitudinal voids that impeded continuous stress transfer. Changing the void size may affect slab behaviour and alter the type of failure. Therefore, changing the void size was investigated as another parameter.
4.6.1. Changing Reinforcement Ratio
The reinforcement ratio used in the experiment, which was previously applied in numerical analysis, was 1.248%. A new ratio of 0.499% was adopted as a parameter to study the impact of reducing the reinforcement ratio, as shown in Figure 26. The grid of perpendicular rebars consists of 5-long bars spaced 125 mm apart and 11-short bars spaced at 170 mm.
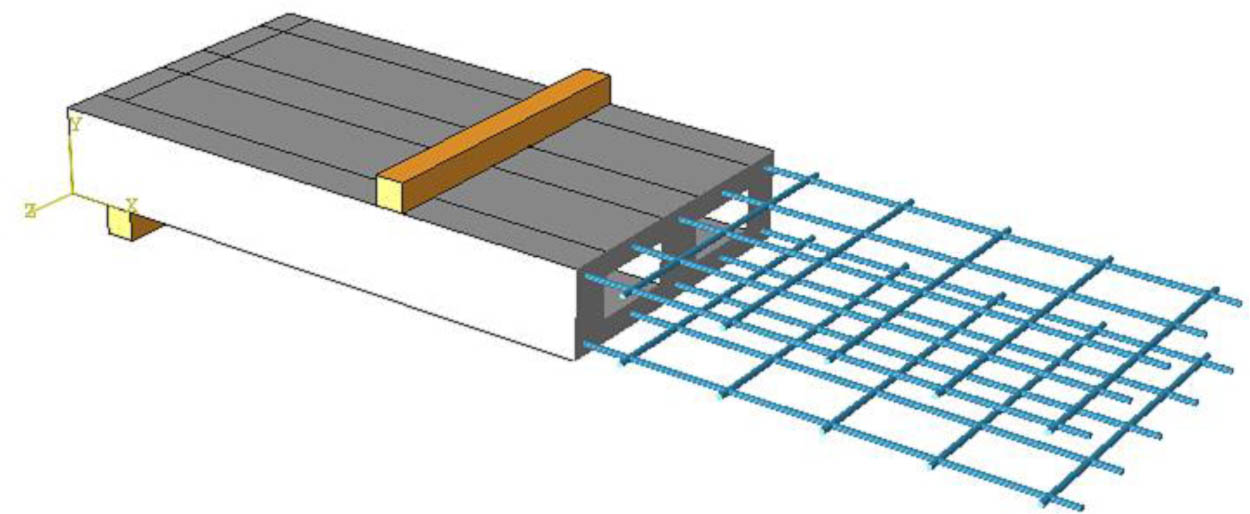
Figure 26:
Changing the reinforcement ratio
The FE analysis results showed that when the reinforcement ratio was reduced by 60%, the cracking load of hollow core slabs decreased by approximately 10%–16% compared to slabs with a reinforcement ratio of 1.248%. In contrast, the deflection associated with the cracking load remained unaffected. This result is consistent with what Al-Bayati et al. stated (Al-Bayati, Mohsin Abuzaid, and Mohammed 2024). Regarding the ultimate load of the slabs, it decreased by a greater percentage than the cracking load, ranging from 61% to 72% of the peak load of slabs with a reinforcement ratio of 1.248%. However, the deflection accompanying the ultimate load decreased when the ultimate load dropped, as illustrated in Table 5.
Table 5:
FEA results of slab specimens upon changing the reinforcement ratio
| Slab ID | ρ= 0.499 | ρ=1.248 | ||||||||||
|---|---|---|---|---|---|---|---|---|---|---|---|---|
| Pcr | Δcr | Py | Δy | Pp | Δp | Pcr | Δcr | Py | Δy | Pp | Δp | |
| SSR | 27.02 | 0.732 | 101.51 | 8.21 | 109.22 | 25.08 | 30.17 | 0.73 | 160.16 | 9.20 | 170.42 | 20.66 |
| HS-R0 | 23.95 | 0.718 | 87.41 | 8.18 | 95.29 | 21.74 | 27.07 | 0.73 | 139.66 | 9.70 | 155.88 | 25.92 |
| HS-R25 | 21.58 | 0.684 | 83.33 | 8.29 | 90.45 | 20.70 | 25.72 | 0.73 | 135.53 | 10.03 | 148.18 | 12.36 |
| HS-R50 | 20.35 | 0.638 | 81.76 | 8.35 | 88.73 | 20.97 | 22.76 | 0.64 | 132.79 | 10.58 | 134.50 | 11.04 |
| HS-R75 | 17.46 | 0.594 | 77.63 | 8.56 | 83.75 | 21.54 | 19.69 | 0.59 | not yield | 116.03 | 9.64 | |
The ultimate load of the HS-R0 hollow core slab was 12.75% less than that of the solid core slab, SSR. The results also showed a decrease in both cracking load and ultimate load as the proportion of RCA replacing NCA increased, along with a corresponding decrease in deflection, as illustrated in Table 5.
Regarding the yield load of the rebars, the results showed a decrease of approximately 62%, while the accompanying deflection reduction ranged from 79% to 89%. Overall, the yield load decreased with increasing proportions of recycled aggregate used as replacement.
It is worth noting that the failure of all the slabs changed from shear failure to flexural failure as a result of the appearance of cracks in the mid span of the slab between the loading lines.
The load-deflection relationships show that all slabs exhibited similar behaviour up to the cracking load for both reinforcement ratios. Afterward, the behaviour varied depending on the slab's load-bearing capacity. The SSR and HS-R0 slabs exhibited deflection hardening before reaching the ultimate load for a specific interval for both reinforcement ratios (1.248 and 0.449) %, as shown in Figures 27 and 28. This indicates a relatively high energy absorption before failure.
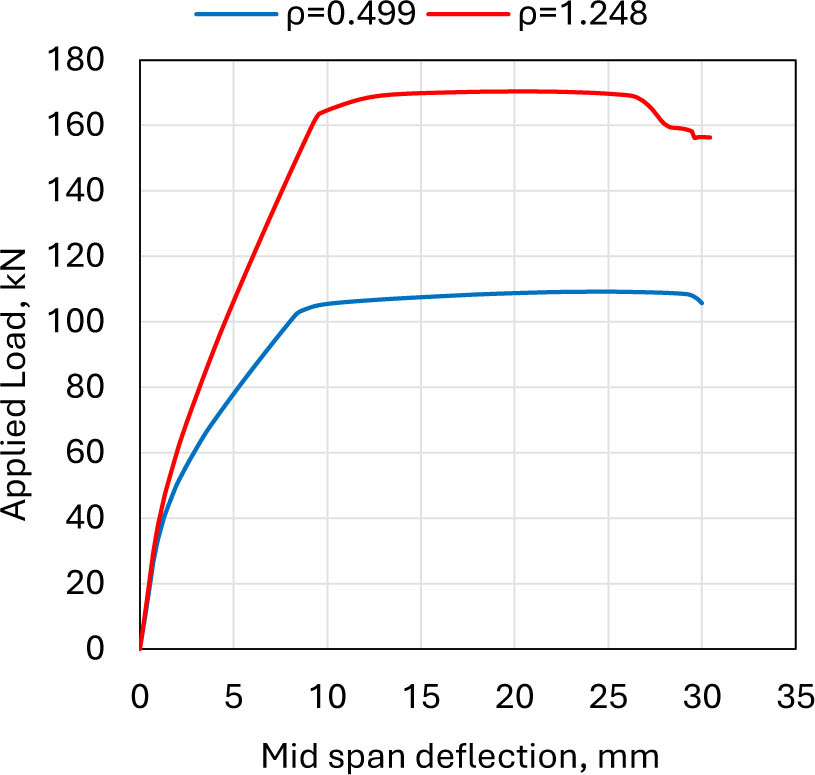
Figure 27:
Load-deflection of solid slab, SSR for the two reinforcement ratios
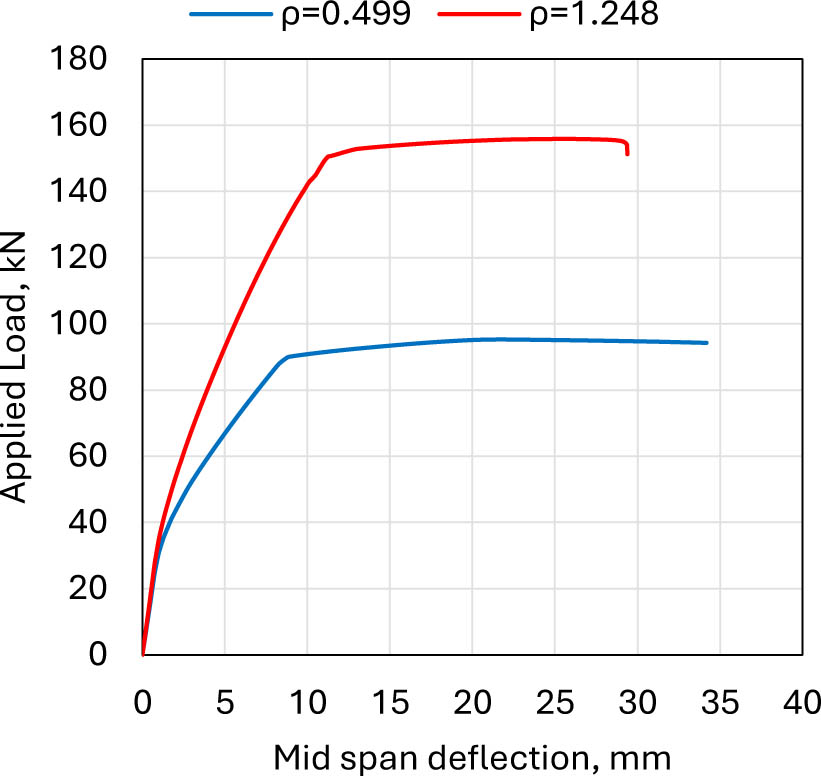
Figure 28:
Load-deflection of hollow core slab, HS-R0, for the two reinforcement ratios
Regarding the other slabs where NCA was replaced with RCA (HS-R25, HS-R50, HS-R75), they exhibited different behaviours after the peak load. Slabs with a higher reinforcement ratio showed brittle behaviour immediately after the ultimate load, with the load decreasing vertically in a straight line after reaching the maximum load. In contrast, slabs with a lower reinforcement ratio (0.499) exhibited greater ductility and energy absorption before and after the ultimate load, and continued to display better ductility after peak state, as shown in Figures 29–31.
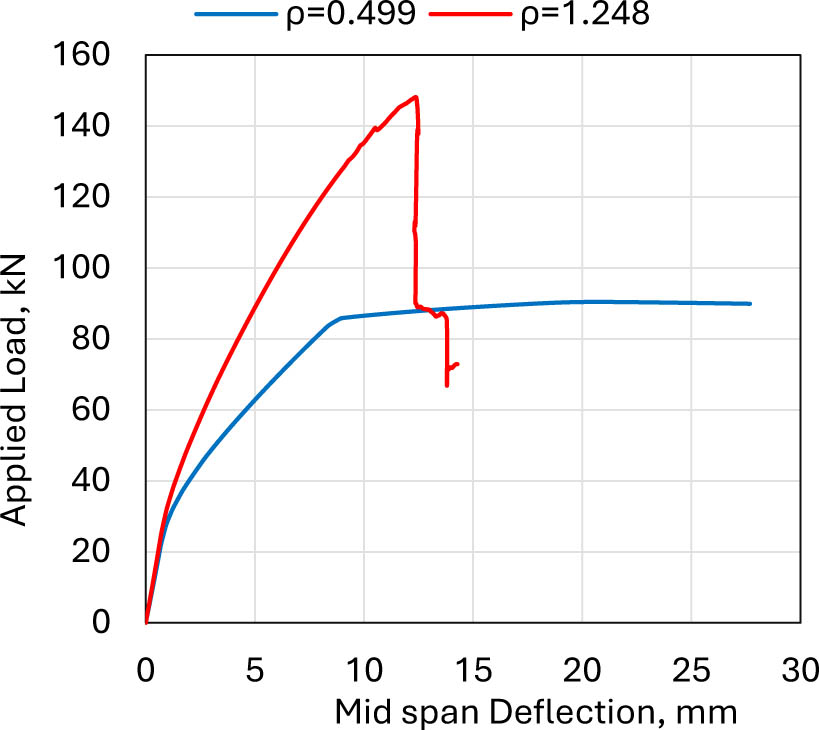
Figure 29:
Load-deflection of hollow core slab, HSR25, for the two reinforcement ratios
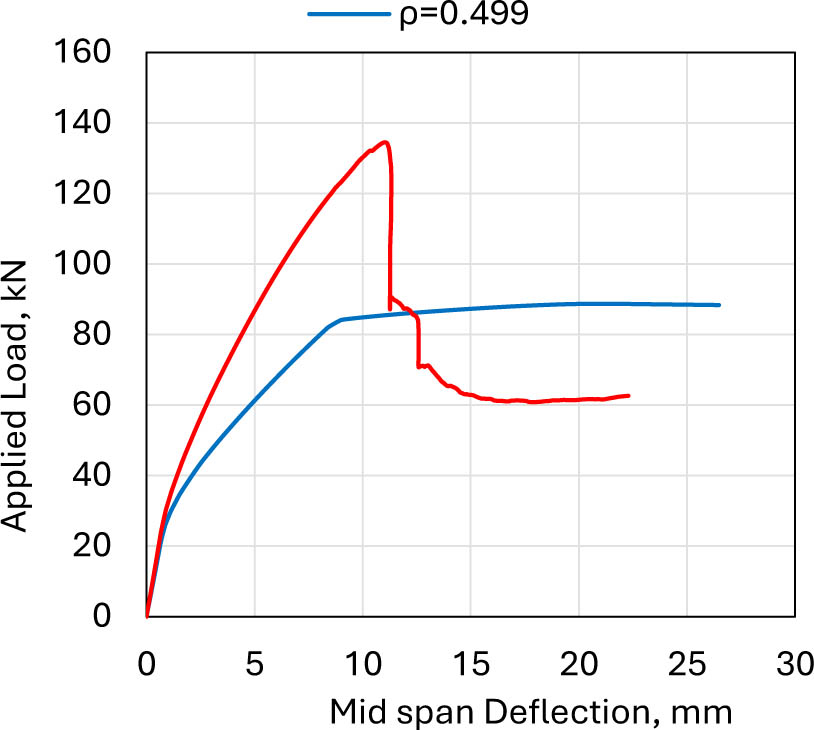
Figure 30:
Load-deflection of hollow core slab, HS-R50, for the two reinforcement ratios
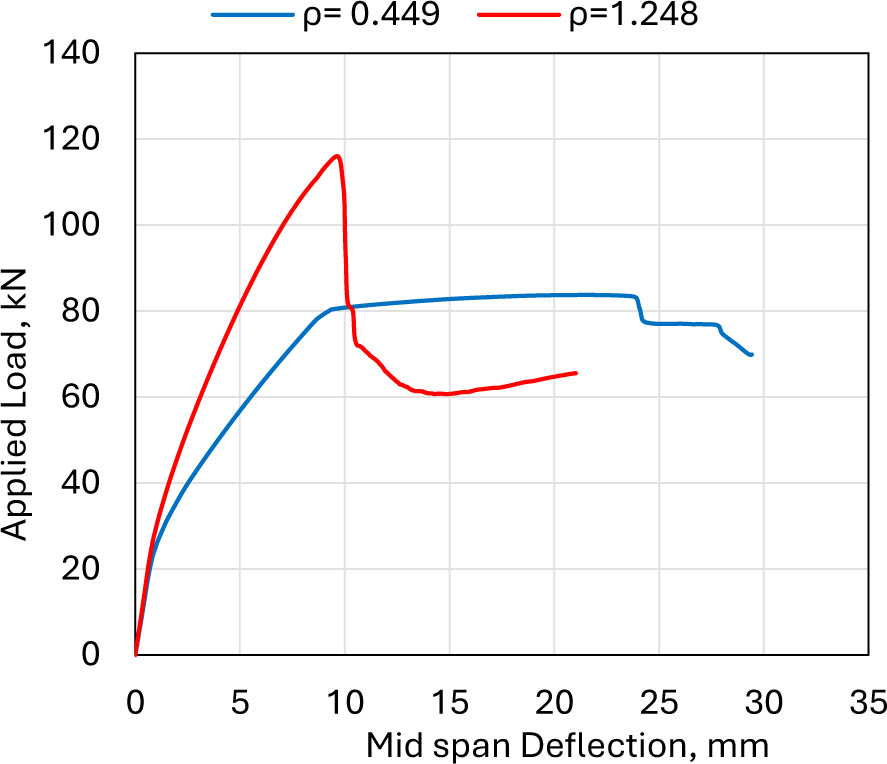
Figure 31:
Load-deflection of hollow core slab, HS-R75, for the two reinforcement ratios
4.6.2. Changing the void size by minimizing the length of the voids
The failure pattern in all hollow core slabs was a shear failure due to the presence of longitudinal voids that extended almost the entire length of the slab (1700 mm). To determine whether reducing the length of these voids to approximately one-third would change the type of failure, an additional parameter was adopted: reducing the void length to only 500 mm so that the void edges lay at the load lines, as shown in Figure 32. However, the other dimensions of the voids remain the same (150 mm wide by 70 mm deep).
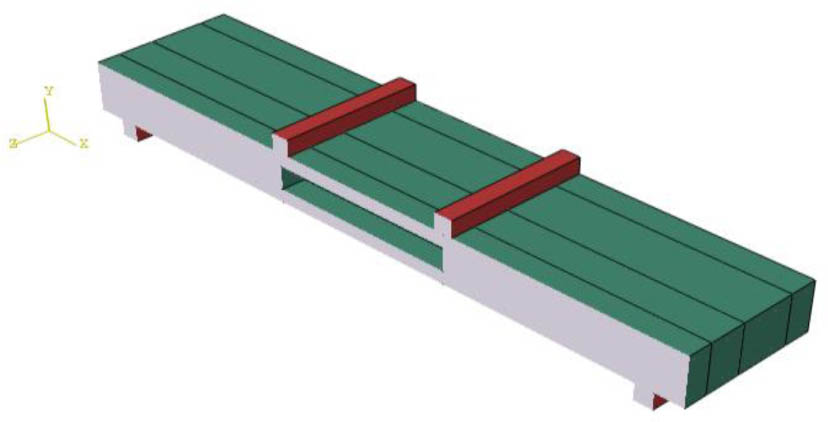
Figure 32:
The second adopted parameter: change the void size by minimizing the length of the voids
Table 6 shows the numerical analysis results of the four hollow-core slabs. The analysis reveals an increase in the ultimate load as the void length decreases. This result is consistent with what Mahdi and Ismael stated (Mahdi and Ismael 2021). This increase was ascending with increasing coarse aggregate replacement ratio; in other words, the percentage increase in the ultimate load was greater for lower loads than for higher loads. The ratio of the maximum load for hollow slabs with a 500 mm void to those with a 1700 mm void was 1.26%, 3.97%, 12.36%, and 23.34%, respectively. Regarding the load-bearing capacity of hollow-core slabs with a 500 mm centre void, the ultimate load decreased slightly as the coarse aggregate replacement ratio increased. The percentage decreases in ultimate load were 2.4%, 4.26%, and 9.34% for slabs HS-R25, HS-R50, and HS-R75, relative to the ultimate load of slab HS-R0. Regarding cracking loads, reducing the void length did not have a significant effect. Analysis results showed that the cracking loads were almost identical for both void lengths.
Table 6:
FEA results of slab specimens upon changing the void size
| Slab ID | Length of void = 500 mm | Length of void = 1700 mm | ||||||||||
|---|---|---|---|---|---|---|---|---|---|---|---|---|
| Pcr | Δcr | Py | Δy | Pp | Δp | Pcr | Δcr | Py | Δy | Pp | Δp | |
| HS-R0 | 27.63 | 0.72 | 147.09 | 9.10 | 157.85 | 22.47 | 27.07 | 0.73 | 139.66 | 9.70 | 155.88 | 25.92 |
| HS-R25 | 25.27 | 0.69 | 143.26 | 9.19 | 154.07 | 22.44 | 25.72 | 0.73 | 135.53 | 10.03 | 148.18 | 12.36 |
| HS-R50 | 23.74 | 0.64 | 140.85 | 9.22 | 151.13 | 21.08 | 22.76 | 0.64 | 132.79 | 10.58 | 134.50 | 11.04 |
| HS-R75 | 20.61 | 0.60 | 137.53 | 9.62 | 143.11 | 19.37 | 19.69 | 0.59 | not yield | 116.03 | 9.64 | |
On the other hand, the yield loads of the tensile rebars in hollow core slabs with 500 mm voids were greater than those of hollow core slabs with 1700 mm voids. The increase was approximately 13–14%. Furthermore, the yield loads decreased with increasing coarse aggregate replacement ratio. It is noteworthy that the failure of the hollow core slabs has shifted from shear failure to flexural failure when reducing the void length to 500 mm.
The behaviour of hollow-core slabs changes from brittle to ductile, with increased energy absorption, when the void length is shortened to approximately one-third in the middle of the slab span. The HS-R0 slab exhibited almost identical behaviour for both the 500 mm and 1700 mm void lengths, as shown in Figure 33. The other slabs also showed similar stiffness behaviour up to approximately half of the maximum load, as shown in Figures 34–36. The results indicate that shortening the void length in the hollow-core slab changes the failure from shear to flexural, resulting in higher ductility and energy absorption. This is attributed to stress redistribution. When the stresses are transferred to the shear span, and because the concrete is contained within the entire slab cross-section, it bears these stresses. The stresses are then redistributed, concentrating at the tension zone in the lower portion of the middle span of the slab, causing flexural cracking and ultimately flexural failure.
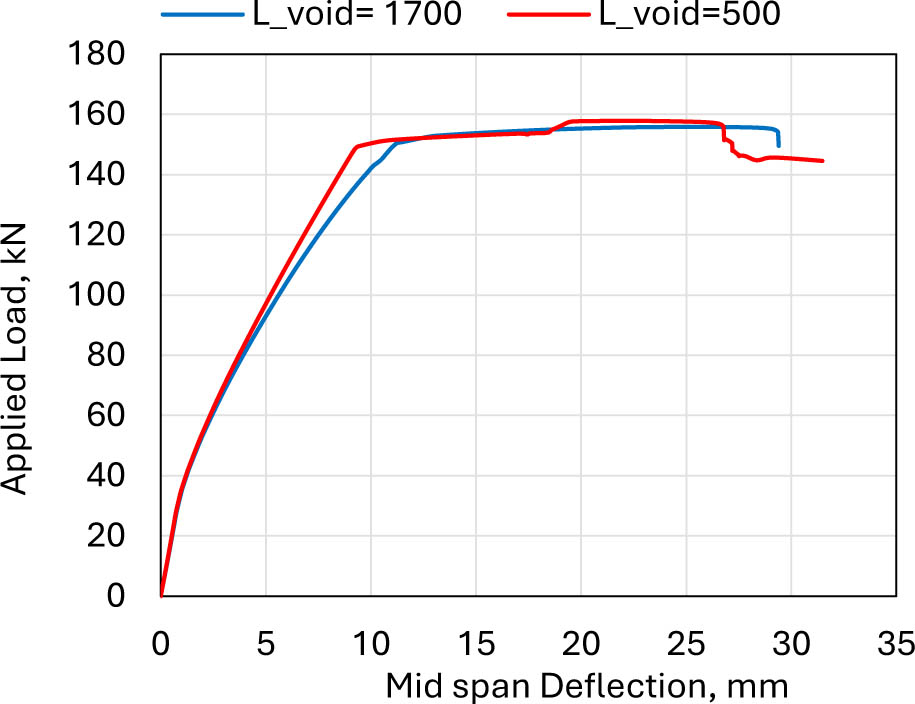
Figure 33:
Load-deflection of hollow core slab, HS-R0, upon changing the voids' size
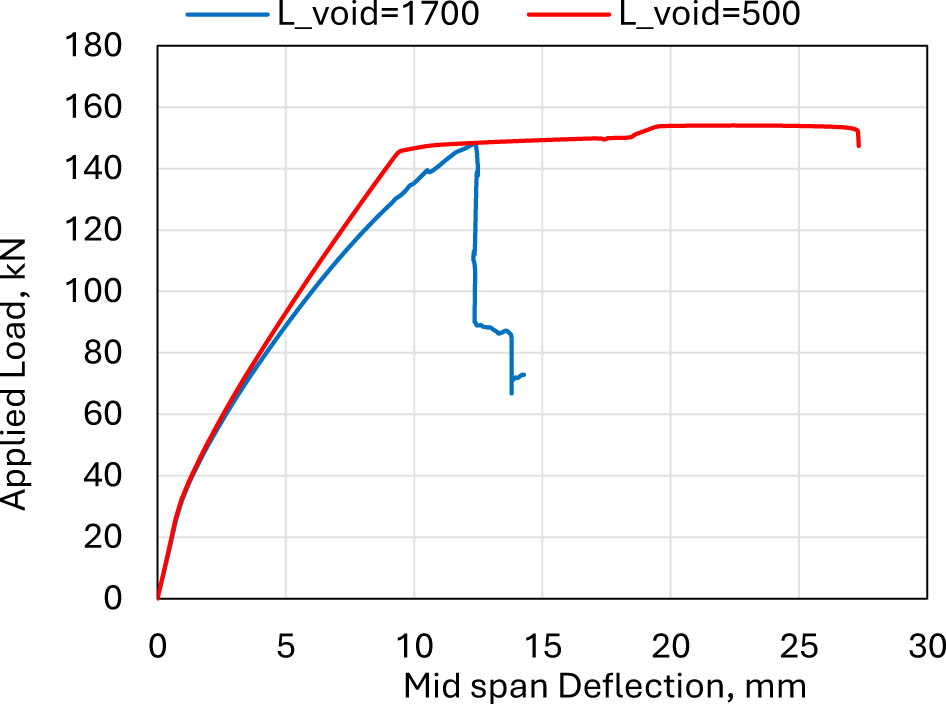
Figure 34:
Load-deflection of hollow core slab, HS-R25, upon changing the voids' size
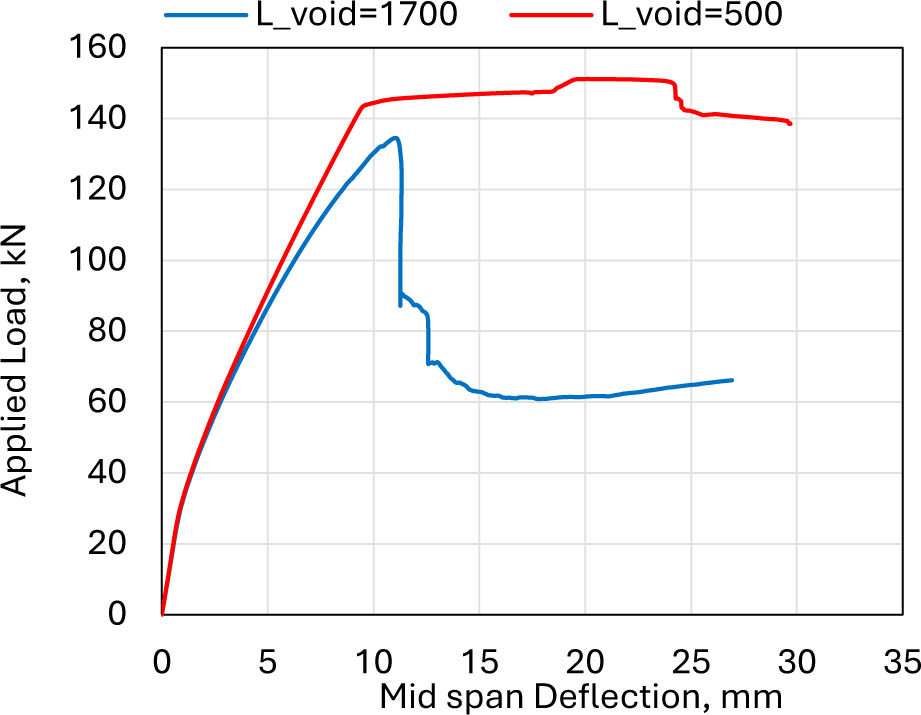
Figure 35:
Load-deflection of hollow core slab, HS-R50, upon changing the voids' size
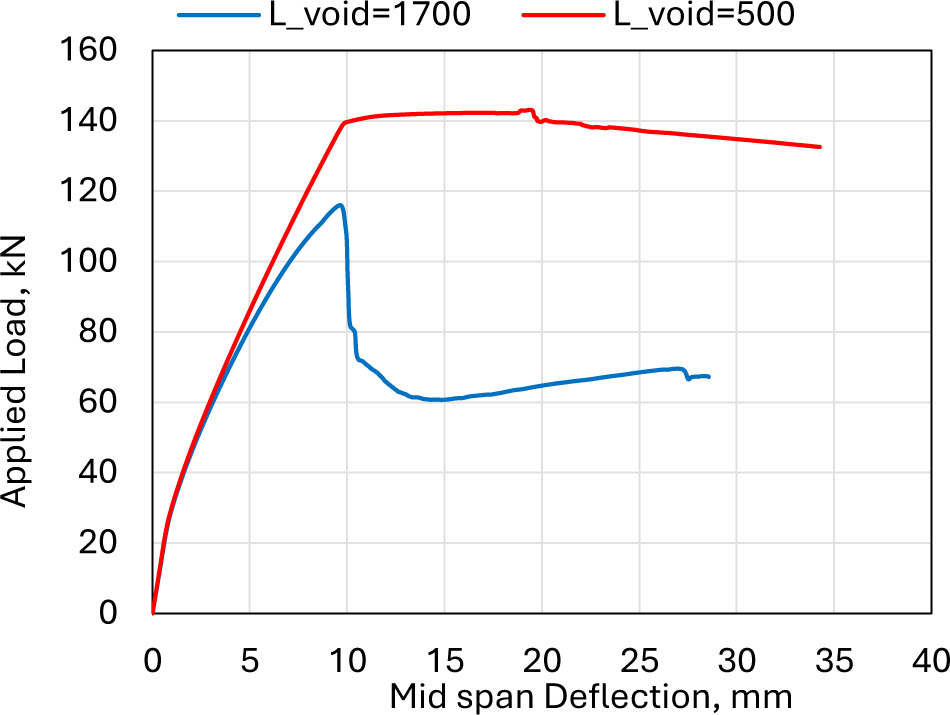
Figure 36:
Load-deflection of hollow core slab, HS-R75, upon changing the voids' size
5. Conclusions
Experimental and numerical investigations were performed on four hollow-core one-way slabs, besides one solid slab for comparison, to evaluate their structural behaviour under four-line loading and to determine their loading capacity and deflection. Furthermore, two additional parameters were numerically evaluated to assess the impact of reducing the reinforcement ratio and void size on the behaviour of hollow-core slabs. The following conclusions can be drawn.
The solid slab failed in flexure, while the hollow-core slabs failed in shear. The high reinforcement ratio of the hollow-core slab increased its load-bearing capacity. Conversely, deflection decreases, and failure was more likely to be of the sudden and brittle shear type.
The cracking and peak loads of the hollow-core slab without RCA were approximately 13% and 23.5% lower than those of the solid slab; both slabs exhibited almost identical deflection. HS-R0 recorded the highest peak load of 148.69 kN and the highest accompanying deflection of 18.86 mm. Replacing 25% and 50% of the NCA with RCA does not significantly affect the hollow-core slab's peak load, but it has a more pronounced effect on deflection. The 50% RCA replacement ratio resulted in only an 8.7% decrease in peak load relative to a hollow-core slab with no RCA. A 75% RCA content had a more significant impact on load-bearing capacity, resulting in a 25% decrease. Therefore, the reduction in weight compared to the reduction in load-bearing capacity is economical and more sustainable.
The numerical analysis results exhibited remarkably close results to the experimental loads at the peak state; the ratio between them ranged from 0.95 to 1.01. The failure pattern was consistent in both numerical analysis and experimental results. The yielding rebar load approaches the maximum load as the RCA replacement percentage increases or as the concrete compressive and tensile strength decreases.
The failure of all the hollow-core slabs changed from shear to flexural failure when the reinforcement ratio was reduced. The FE analysis results showed that when the reinforcement ratio was reduced by 60%, the cracking load of hollow-core slabs decreased by approximately 10%–16% compared to slabs with a high reinforcement ratio of 1.248%. In contrast, the deflection associated with the cracking load remained unaffected. The ultimate load of the slabs decreased by a greater percentage than the cracking load, ranging from 61% to 72% of the peak load of slabs with a reinforcement ratio of 1.248%. However, the deflection accompanying the ultimate load decreased when the ultimate load dropped.
Hollow-core slabs with a higher reinforcement ratio showed brittle behaviour immediately after the ultimate load.
In contrast, slabs with a lower reinforcement ratio exhibited greater ductility and energy absorption before and after the ultimate load and continued to display better ductility after the peak state.
The FE analysis reveals an increase in the ultimate load as the void length decreases. The percentage increase in the ultimate load was greater for lower loads than for higher loads. Also, the failure shifted from shear to flexure upon reducing the void length to 500 mm, with higher ductility and energy absorption. Hollow-core slabs with a 500 mm centre void exhibited a slight reduction in ultimate load as the coarse aggregate replacement ratio increased. Reducing the void length did not significantly affect the cracking load.