

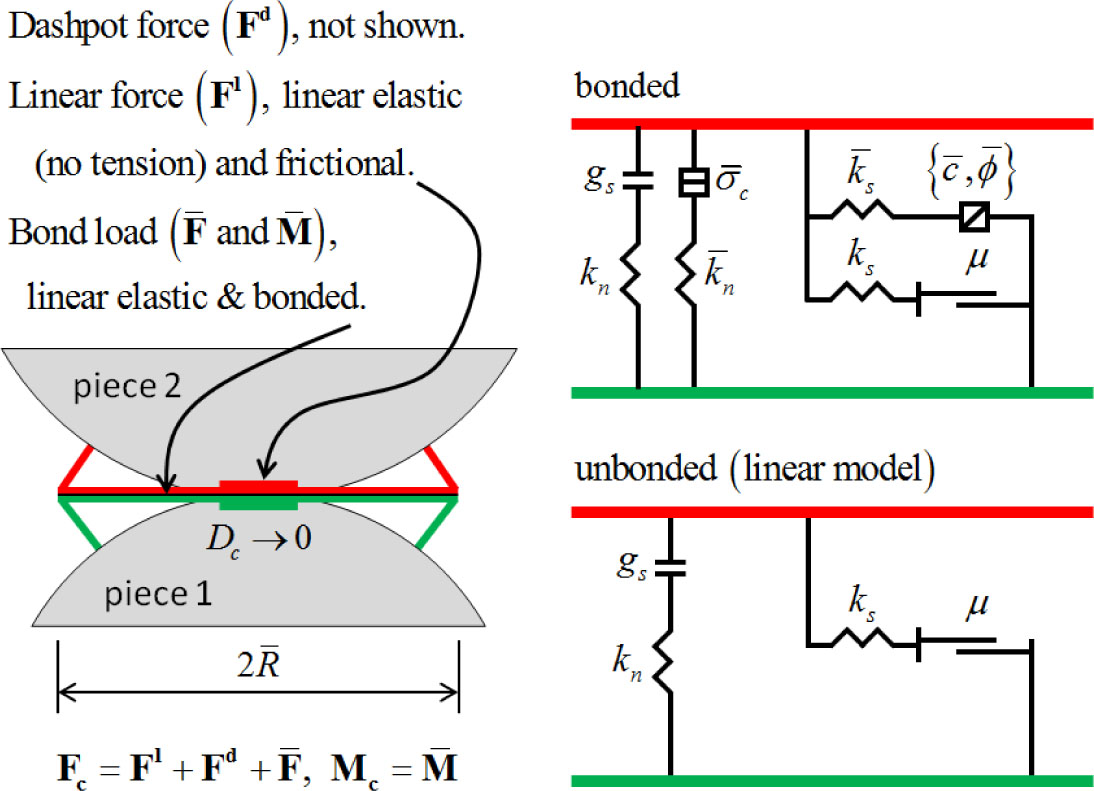
Figure 1:
Schematic diagram of the 2D linear parallel bonding model (Ni et al. 2025a, 2025b)
Table 1:
Ranges of each input micro-parameters (Ni et al. 2025a, 2025b)
| Input | Symbol | Unit | Lower bounds | Upper bounds |
|---|---|---|---|---|
| Tensile strength | σmi | [MPa] | 10 | 90 |
| Cohesion force | cmi | [MPa] | 10 | 90 |
| Radius multiplier | λmi | - | 0.5 | 1 |
| Effective modulus | [GPa] | 10 | 90 | |
| Friction angle | ϕmi | [°] | 40 | 60 |
| Friction coefficient | μmi | - | 0.1 | 0.9 |
| Porosity | pmi | - | 0.1 | 0.15 |
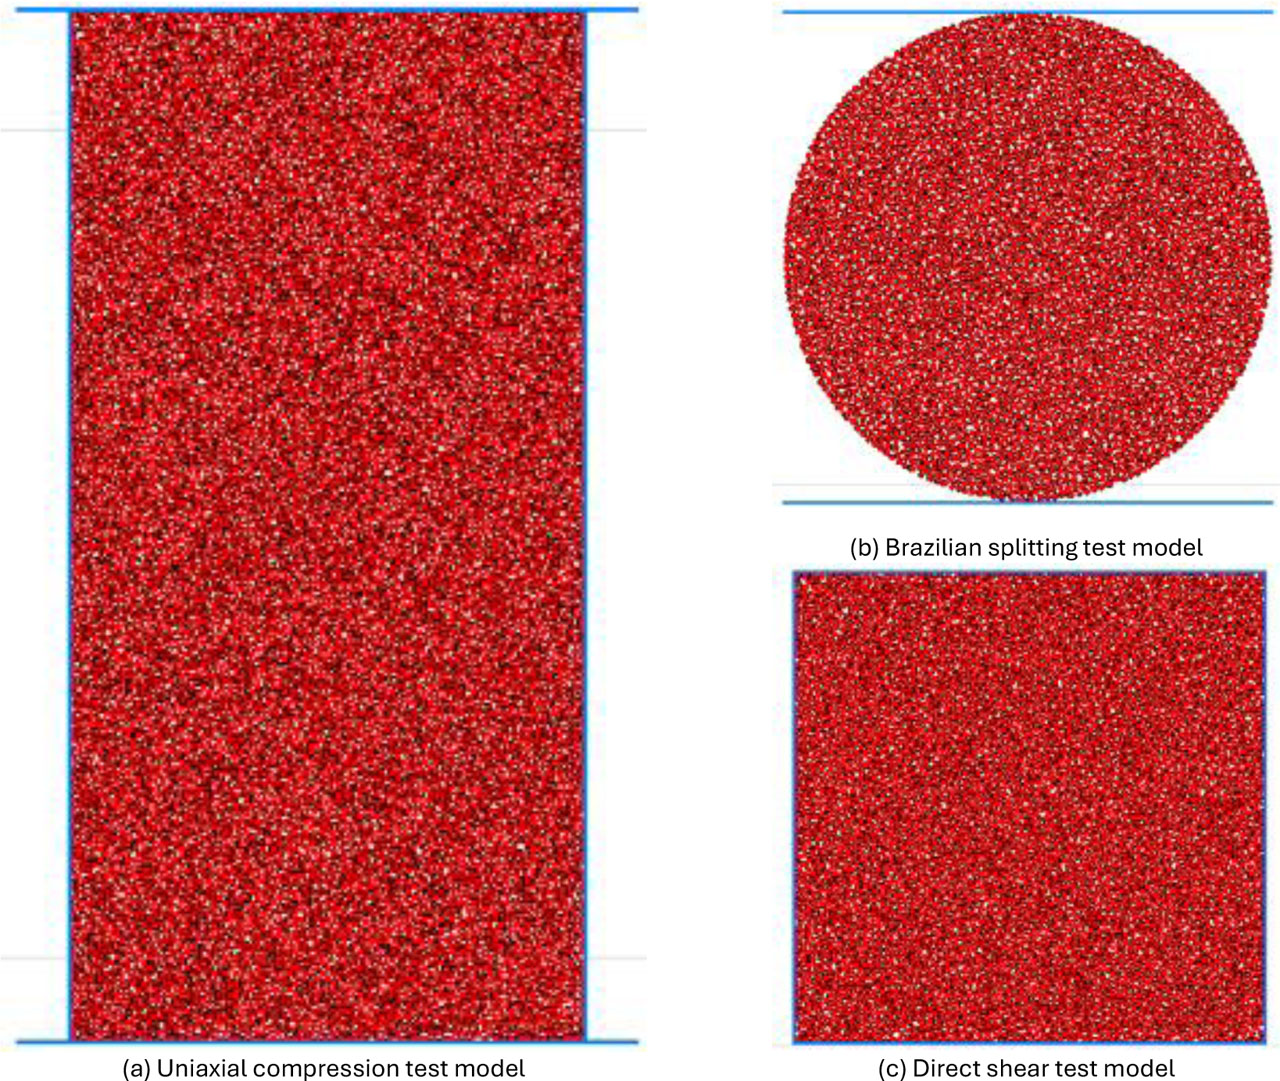
Figure 2:
Numerical models for data collection (Ni et al. 2025a, 2025b)
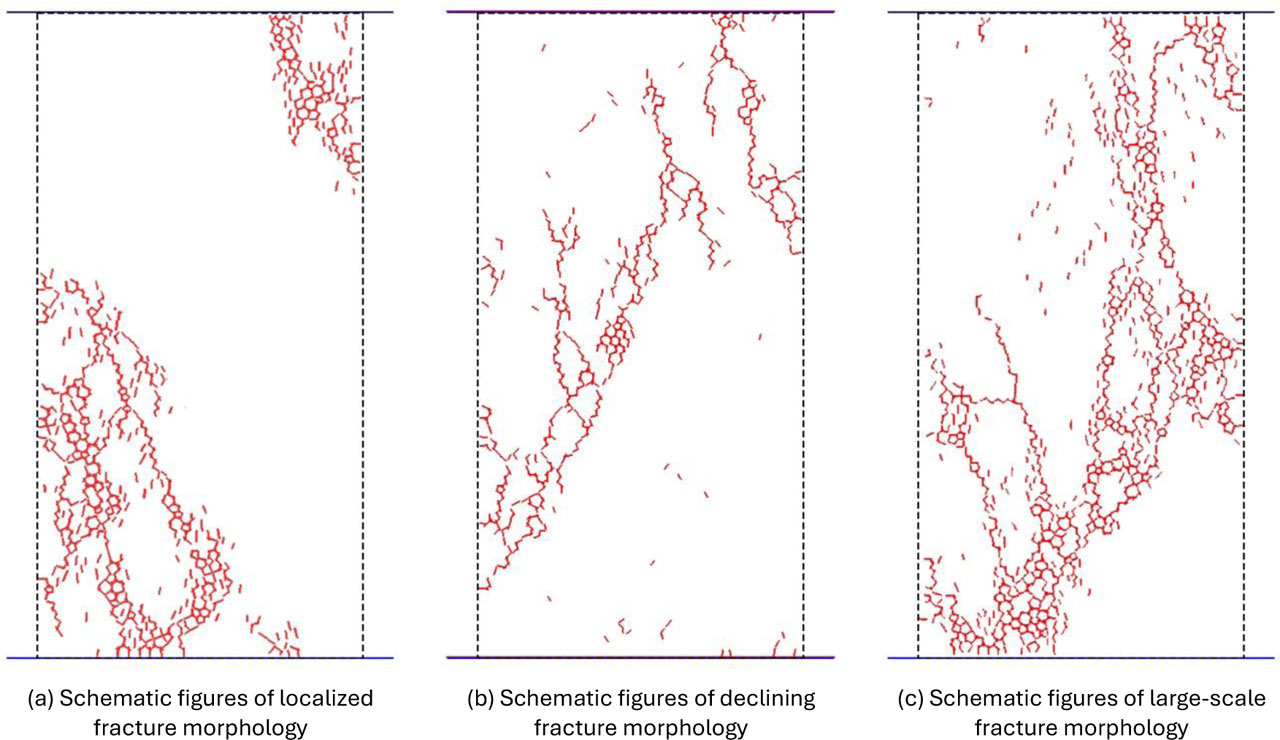
Figure 3:
Schematic figures of different fracture morphology generated in the uniaxial compression test
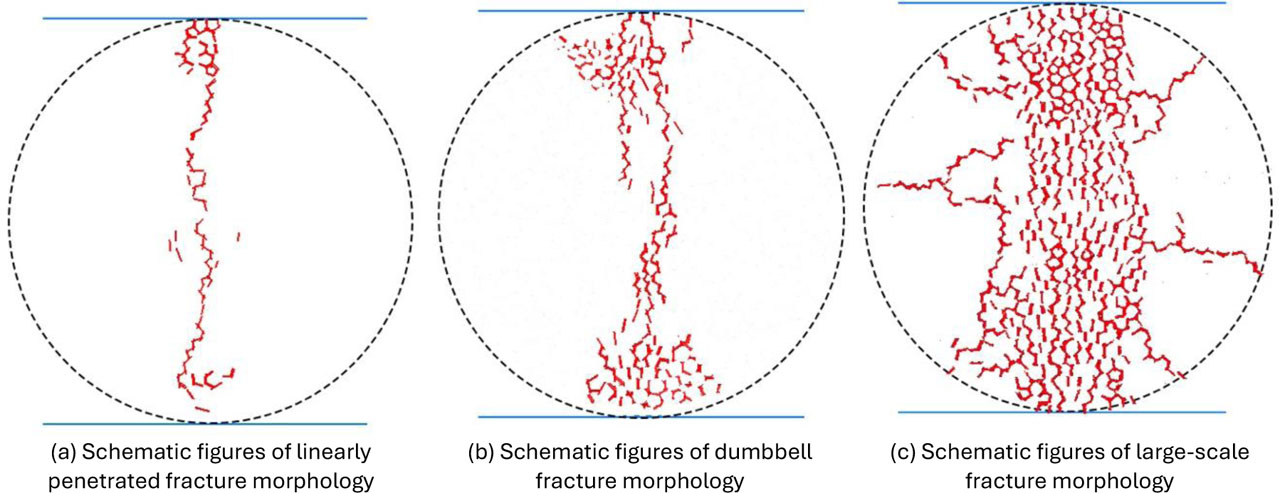
Figure 4:
Schematic figures of different fracture morphology generated in the Brazilian splitting test
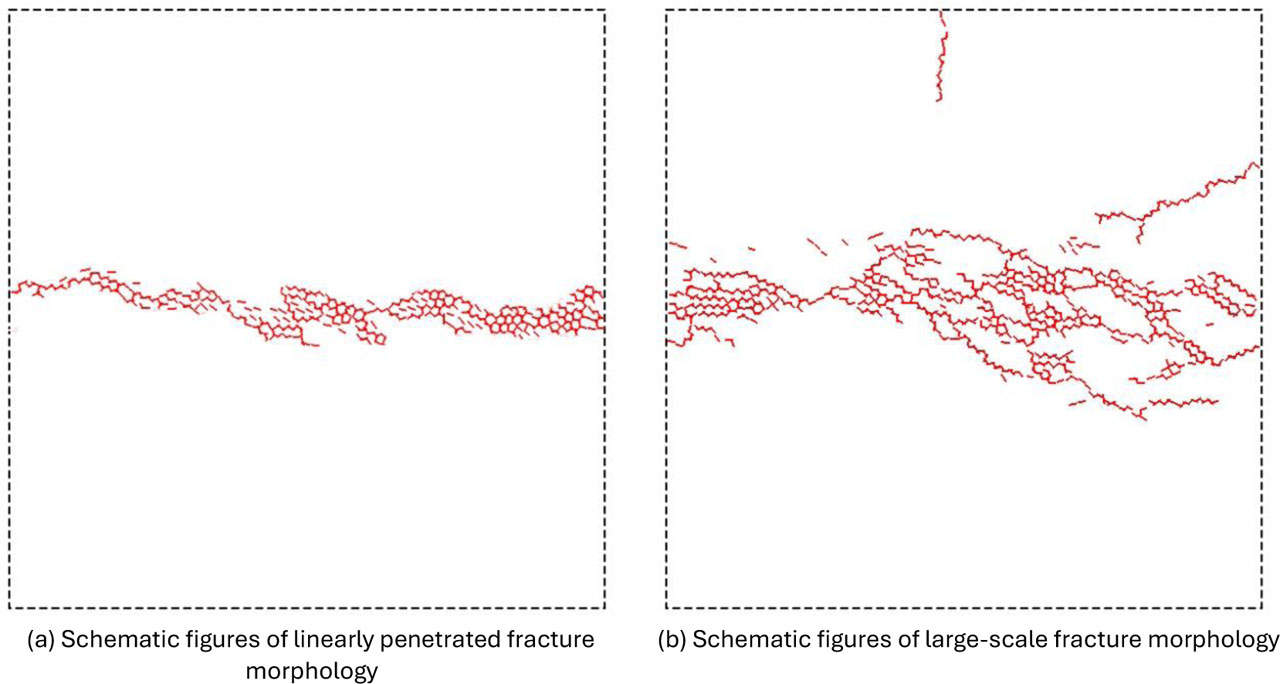
Figure 5:
Schematic figures of different fracture morphology generated in the direct shear test
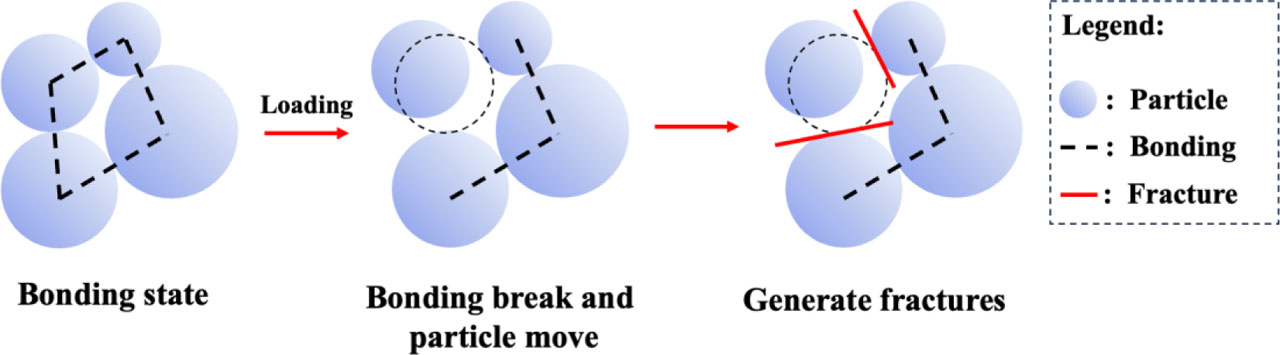
Figure 6:
Generation of fractures in PFC2D
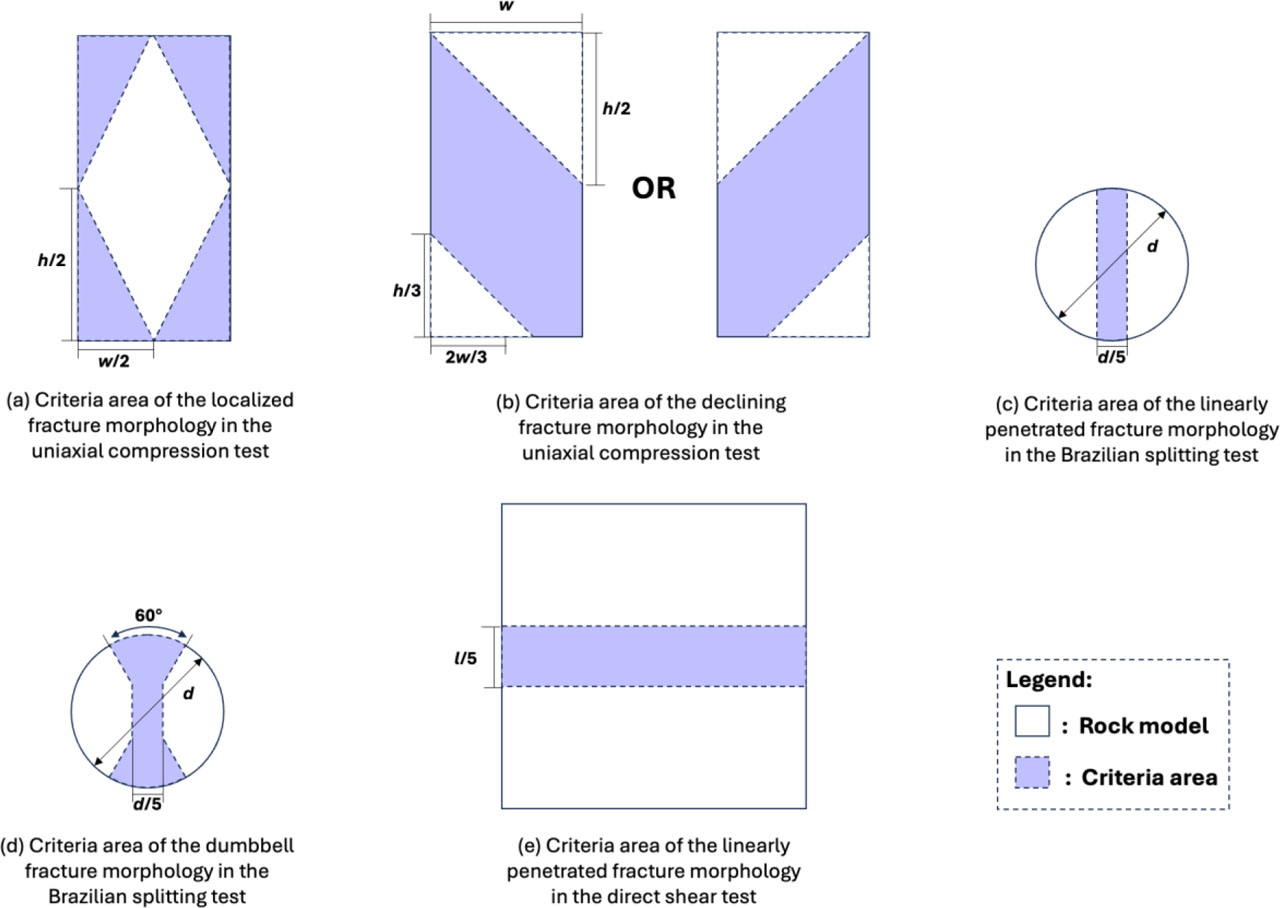
Figure 7:
The criteria areas of different fracture morphology
Table 2
Micro-parameter of the example numerical rock model
| σmi [MPa] | cmi [MPa] | λmi | ϕmi[°] | μmi | pmi | |
|---|---|---|---|---|---|---|
| 49.62 | 58.10 | 0.86 | 65.3 | 48.50 | 0.48 | 0.13 |
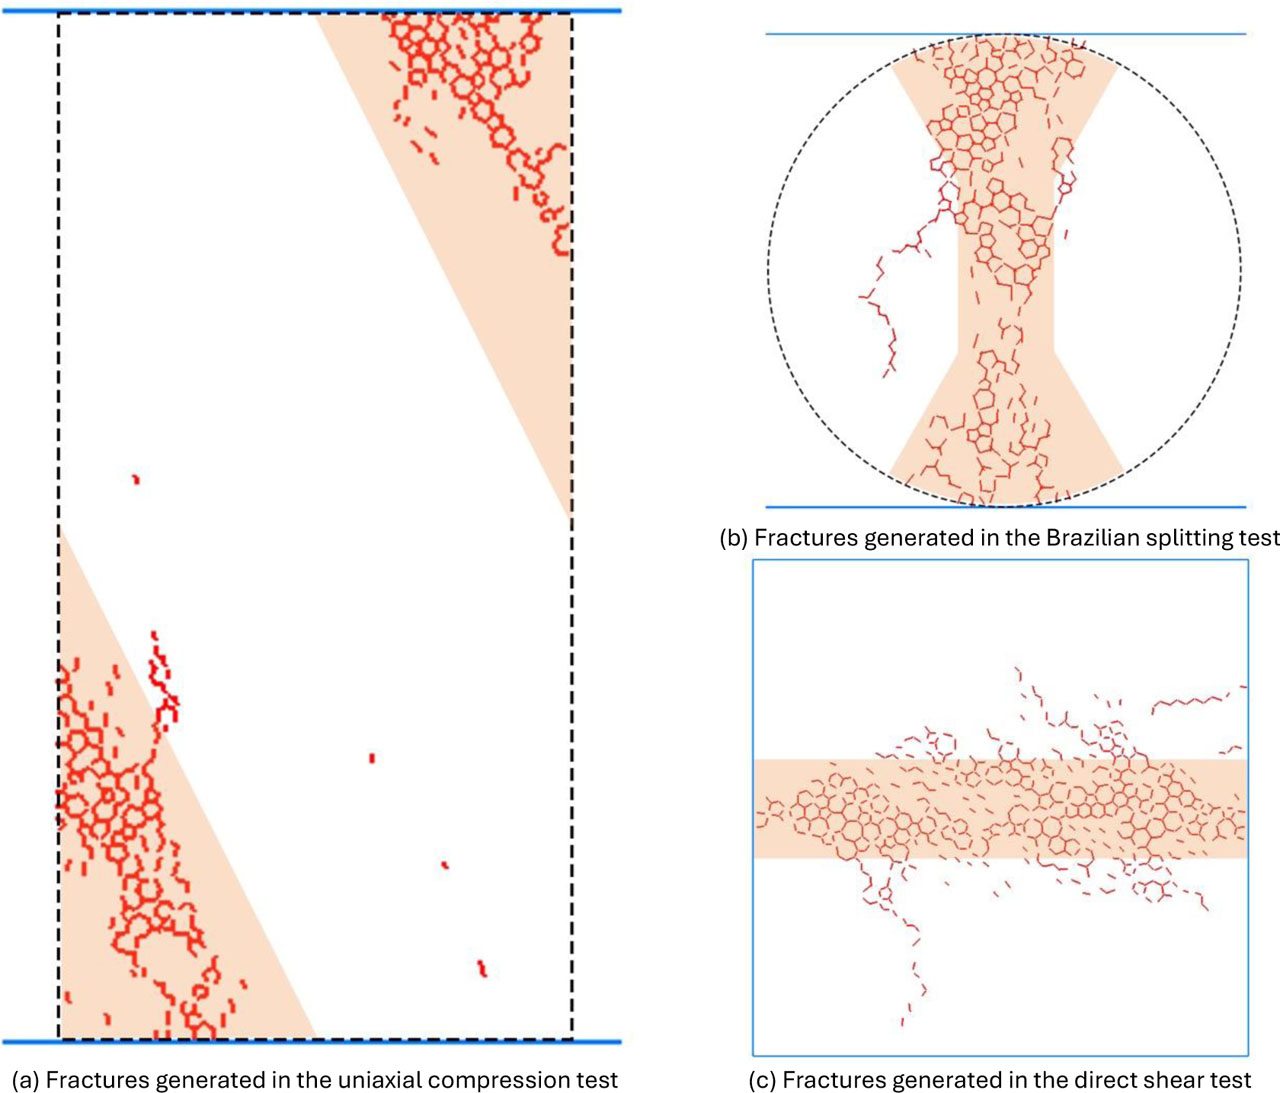
Figure 8:
Classification of the generated fractures morphology of the example model
Table 3:
The proportion of each morphology
| Uniaxial compression test | Brazilian splitting test | Direct shear test | ||||||
|---|---|---|---|---|---|---|---|---|
| Morphology | Number | Proportion [%] | Morphology | Number | Proportion [%] | Morphology | Number | Proportion [%] |
| Localized | 163 | 10.7 | Linearly penetrated | 1122 | 74.0 | Linearly penetrated | 1287 | 84.8 |
| Declining | 914 | 60.3 | Dumbbell | 346 | 22.8 | Large-scale | 230 | 15.2 |
| Large-scale | 440 | 29.0 | Large-scale | 49 | 3.2 | |||
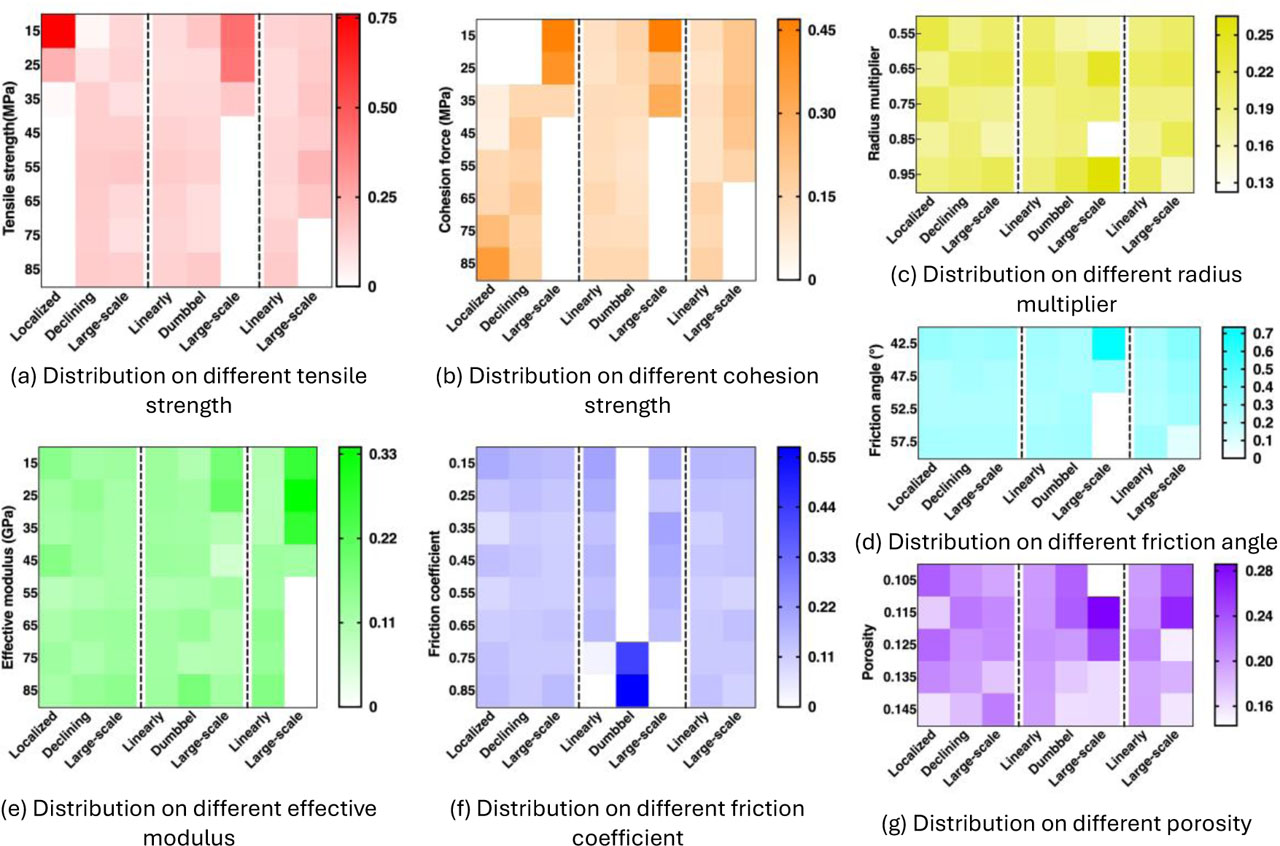
Figure 9:
Fracture morphology distribution on different micro-parameters
Table 4:
Primary influencing factors on each fracture morphology
| Rock test | Fracture morphology | Influencing factors |
|---|---|---|
| Uniaxial compression test | Localized | σmi, cmi |
| Declining | σmi, cmi | |
| Large-scale | cmi | |
| Brazilian splitting test | Linearly | μmi |
| Dumbbell | μmi | |
| Large-scale | σmi, cmi, ϕmi, μmi, pmi | |
| Direct shear test | Linearly | σmi, cmi |
| Large scale | σmi, cmi, , pmi |
Table 5:
Micro-parameters of the example numerical model
| Model name | σmi [MPa] | cmi [MPa] | λmi | ϕmi [°] | μmi | pmi | |
|---|---|---|---|---|---|---|---|
| Example | 82.73 | 88.38 | 0.95 | 16.83 | 50.91 | 0.88 | 0.13 |
| The closest | 82.42 | 73.59 | 0.90 | 30.08 | 46.08 | 0.90 | 0.13 |
| The 2nd closest | 83.16 | 81.47 | 0.99 | 16.60 | 50.46 | 0.89 | 0.15 |
| The 3rd closest | 73.12 | 64.72 | 0.94 | 38.77 | 50.39 | 0.72 | 0.13 |
| The 4th closest | 87.64 | 85.28 | 0.85 | 29.84 | 58.44 | 0.81 | 0.12 |
| The 5th closest | 86.95 | 58.35 | 0.95 | 15.28 | 53.51 | 0.67 | 0.14 |
| The 6th closest | 75.01 | 88.69 | 0.81 | 12.68 | 56.02 | 0.80 | 0.11 |
| …… |
Table 6:
Simulated fracture morphologies of the 5 closest models
| Uniaxial compression test | Brazilian splitting test | Direct shear test | |
|---|---|---|---|
| The closest | Declining | Dumbbell | Linearly penetration |
| The 2nd closest | Large-scale | Dumbbell | Linearly penetration |
| The 3rd closest | Declining | Linearly penetration | Linearly penetration |
| The 4th closest | Declining | Dumbbell | Linearly penetration |
| The 5th closest | Declining | Dumbbell | Large-scale |
| The 6th closest | Declining | Dumbbell | Linearly penetration |
| …… | |||
| Evaluating results | Declining | Dumbbell | Linearly penetration |
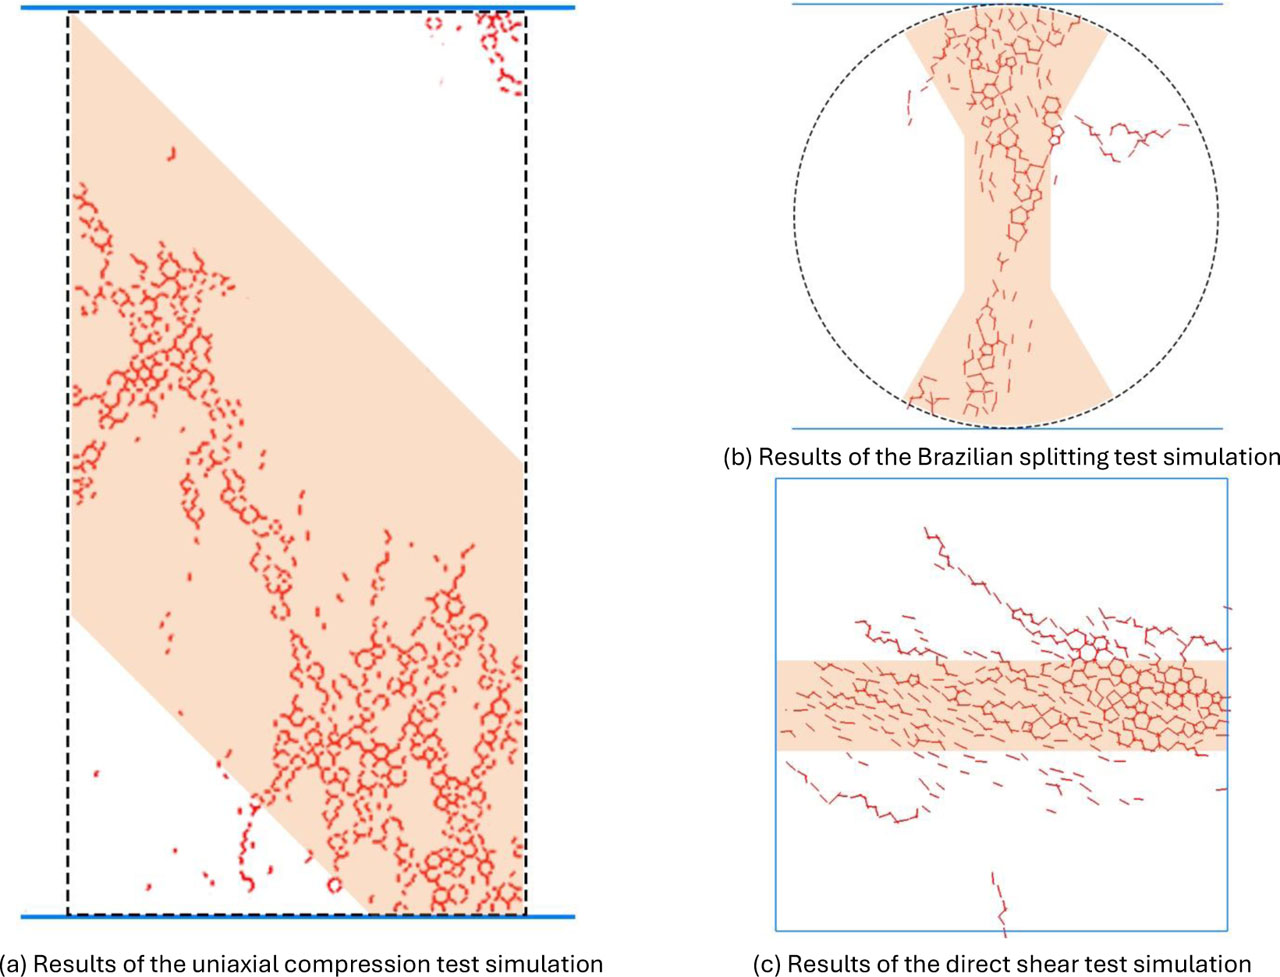
Figure 10:
Simulation results of the example rock model
Table 7:
Micro-parameters of the partial of 40 randomly generated models used for verification
| σmi [MPa] | cmi [MPa] | λmi | ϕmi [°] | μmi | pmi | ||
|---|---|---|---|---|---|---|---|
| 1 | 72.54 | 79.27 | 0.81 | 34.29 | 57.15 | 0.75 | 0.14 |
| 2 | 23.17 | 33.43 | 0.93 | 87.36 | 40.08 | 0.29 | 0.12 |
| 3 | 27.46 | 82.32 | 0.68 | 39.38 | 53.93 | 0.89 | 0.12 |
| 4 | 68.40 | 80.92 | 0.81 | 44.96 | 44.54 | 0.19 | 0.12 |
| 5 | 13.54 | 10.54 | 0.93 | 12.98 | 41.54 | 0.24 | 0.13 |
| 6 | 89.82 | 46.19 | 0.56 | 66.44 | 48.51 | 0.31 | 0.10 |
| 7 | 51.20 | 39.16 | 0.62 | 73.92 | 49.74 | 0.76 | 0.11 |
| 8 | 40.58 | 50.71 | 0.73 | 48.10 | 47.27 | 0.56 | 0.14 |
| 9 | 17.39 | 31.60 | 0.62 | 27.31 | 50.19 | 0.51 | 0.13 |
| 10 | 22.46 | 33.27 | 0.63 | 29.81 | 47.42 | 0.34 | 0.15 |
| …… |
Table 8:
Partial Evaluating fracture morphology of the 40 verification models
| Uniaxial compression test | Brazilian splitting test | Direct shear test | |
|---|---|---|---|
| 1 | Declining | Dumbbell | Linearly penetrated |
| 2 | Declining | Large-scale | Linearly penetrated |
| 3 | Localized | Dumbbell | Linearly penetrated |
| 4 | Declining | Linearly penetrated | Linearly penetrated |
| 5 | Large-scale | Large-scale | Large-scale |
| 6 | Declining | Linearly penetrated | Linearly penetrated |
| 7 | Declining | Dumbbell | Linearly penetrated |
| 8 | Declining | Linearly penetrated | Linearly penetrated |
| 9 | Large-scale | Linearly penetrated | Large-scale |
| 10 | Declining | Large-scale | Large-scale |
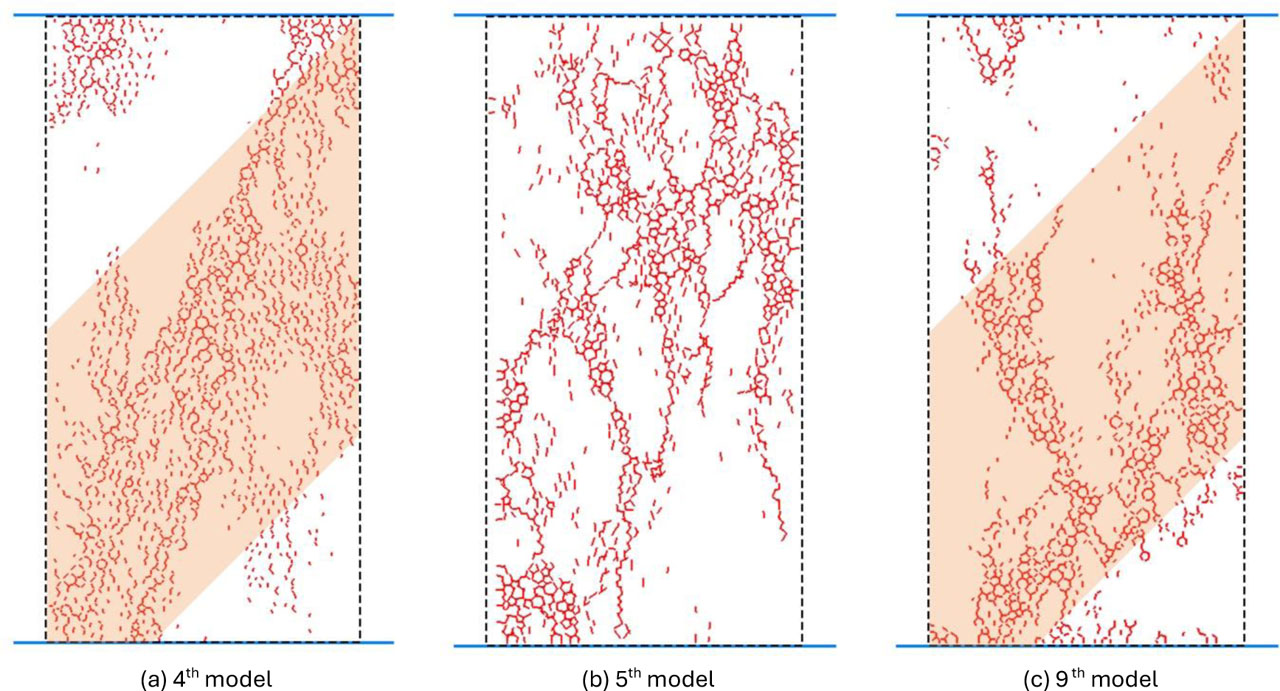
Figure 11:
The uniaxial compression test simulation results of partial verification models
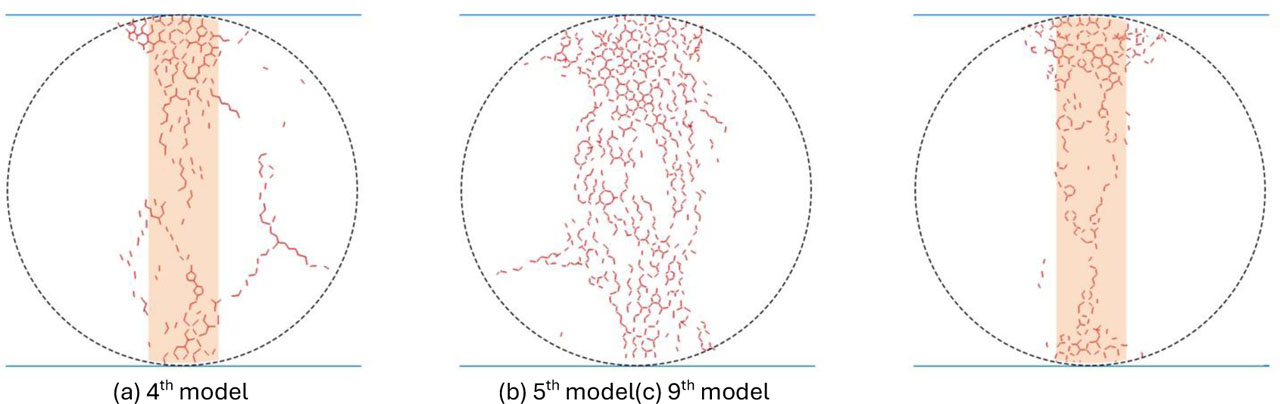
Figure 12:
The Brazilian splitting test simulation results of partial verification models
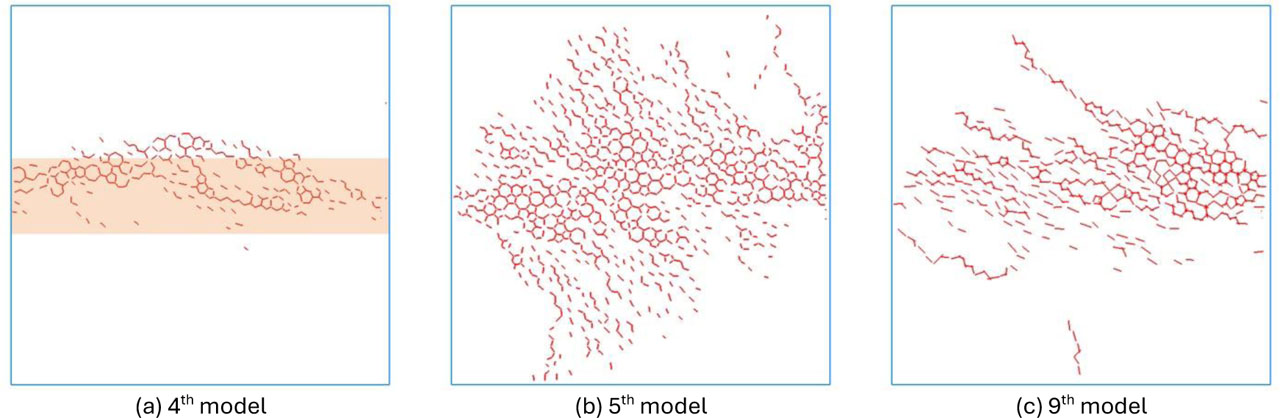
Figure 13:
The direct shear test simulation results of partial verification models
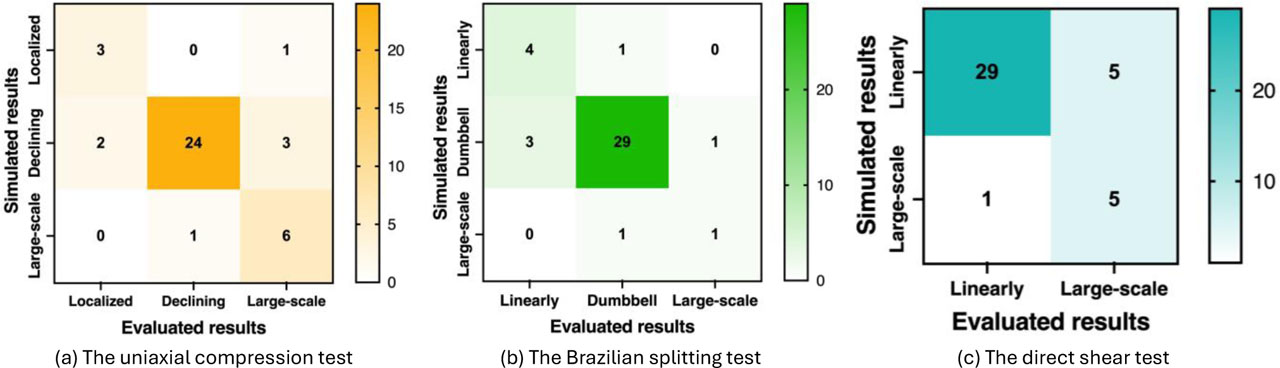
Figure 14:
Frequency of the comparison results between simulated and evaluated morphology
Table 9:
Statistic results of the evaluation method applied on the 40 added simulation
| Uniaxial compression test | Brazilian splitting test | Direct shear test | ||||||
|---|---|---|---|---|---|---|---|---|
| Localized | Declining | Large-scale | Linearly | Dumbbell | Large-scale | Linearly | Large-scale | |
| Precision [%] | 60.0 | 96.0 | 60.0 | 57.1 | 93.5 | 50.0 | 96.70 | 50.0 |
| Recall [%] | 75.0 | 82.8 | 85.7 | 80.0 | 87.9 | 50.0 | 85.30 | 83.3 |
| F1-score | 0.67 | 0.89 | 0.71 | 0.67 | 0.91 | 0.5 | 0.91 | 0.62 |
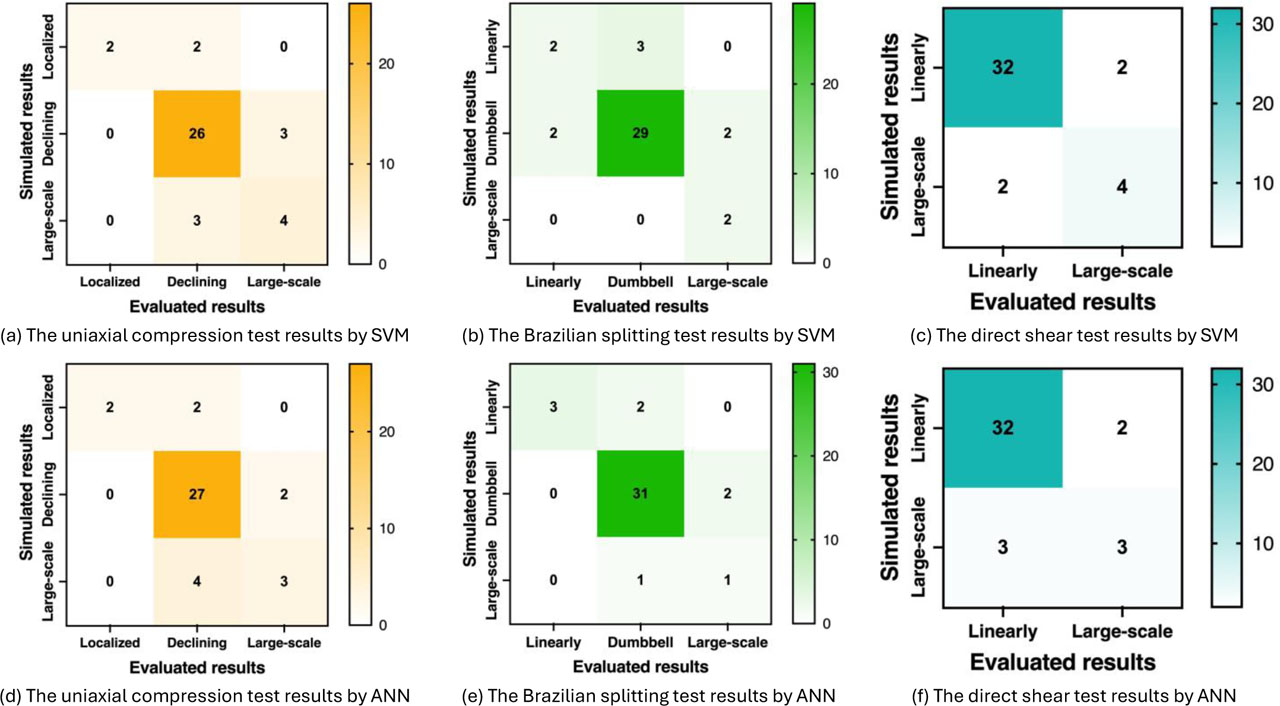
Figure 15:
Evaluating results of SVM and ANN
Table 10:
Statistic of the evaluated results by SVM and ANN
| Uniaxial compression test | Brazilian splitting test | Direct shear test | |||||||
|---|---|---|---|---|---|---|---|---|---|
| Localized | Declining | Large-scale | Linearly | Dumbbell | Large-scale | Linearly | Large-scale | ||
| SVM | Precision [%] | 100.0 | 83.4 | 57.1 | 50.0 | 90.6 | 50.0 | 94.1 | 67.0 |
| Recall [%] | 50.0 | 89.7 | 57.1 | 40.0 | 87.9 | 100.0 | 94.1 | 66.7 | |
| F1-score | 0.67 | 0.86 | 0.57 | 0.44 | 0.89 | 0.67 | 0.94 | 0.67 | |
| ANN | Precision [%] | 100.0 | 81.8 | 60.0 | 100.0 | 91.2 | 33.0 | 91.4 | 50.0 |
| Recall [%] | 50.0 | 93.10 | 42.9 | 60.0 | 93.9 | 50.0 | 94.1 | 60.0 | |
| F1-score | 0.67 | 0.87 | 0.50 | 0.75 | 0.93 | 0.40 | 0.93 | 0.55 | |
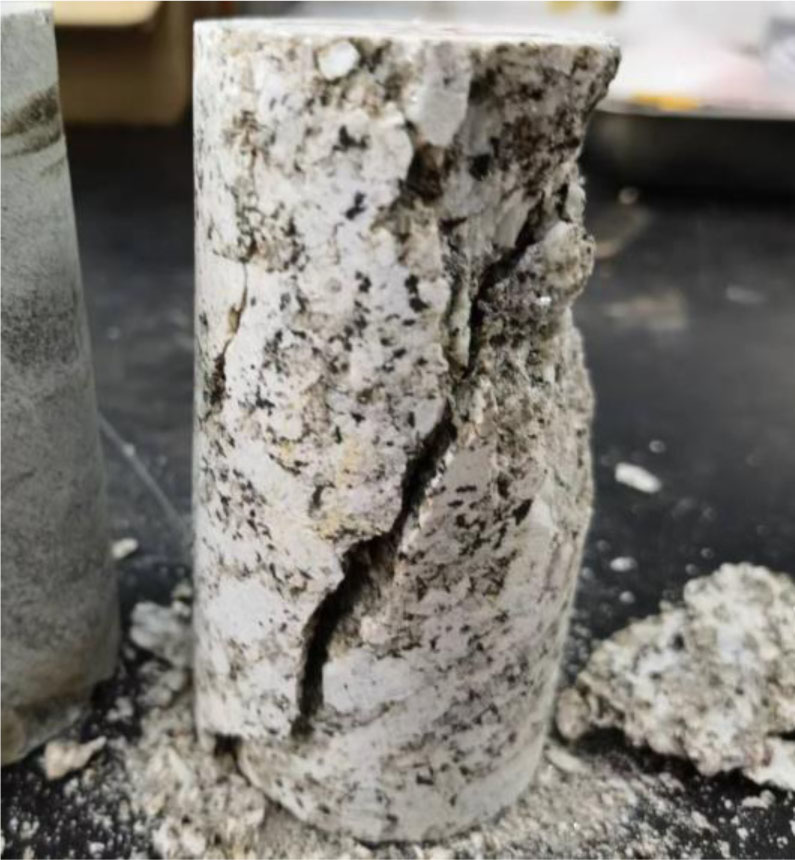
Figure 16:
Broken photo of the field rock sample
Table 11:
The micro-parameters of the selected samples
| σmi [MPa] | cmi [MPa] | λmi | ϕmi [°] | μmi | pmi | Morphology | ||
|---|---|---|---|---|---|---|---|---|
| 1 | 29.04 | 75.33 | 0.97 | 18.82 | 51.82 | 0.44 | 0.13 | Declining |
| 2 | 61.17 | 30.16 | 0.87 | 77.71 | 52.14 | 0.80 | 0.13 | Large-scale |
| 3 | 63.29 | 33.45 | 0.78 | 60.39 | 41.95 | 0.23 | 0.12 | Declining |
| 4 | 78.89 | 35.12 | 0.92 | 70.39 | 58.92 | 0.31 | 0.12 | Declining |
| 5 | 65.17 | 28.22 | 0.92 | 85.61 | 48.28 | 0.29 | 0.12 | Large-scale |
| 6 | 58.47 | 67.00 | 0.53 | 24.55 | 50.73 | 0.40 | 0.10 | Declining |
| 7 | 52.55 | 29.80 | 0.68 | 26.13 | 41.89 | 0.67 | 0.11 | Large-scale |
| 8 | 26.12 | 33.79 | 0.97 | 73.89 | 51.69 | 0.65 | 0.11 | Declining |
| 9 | 72.77 | 36.09 | 0.90 | 34.68 | 59.95 | 0.66 | 0.10 | Declining |
| 10 | 45.59 | 29.63 | 0.94 | 35.86 | 54.30 | 0.78 | 0.13 | Large-scale |
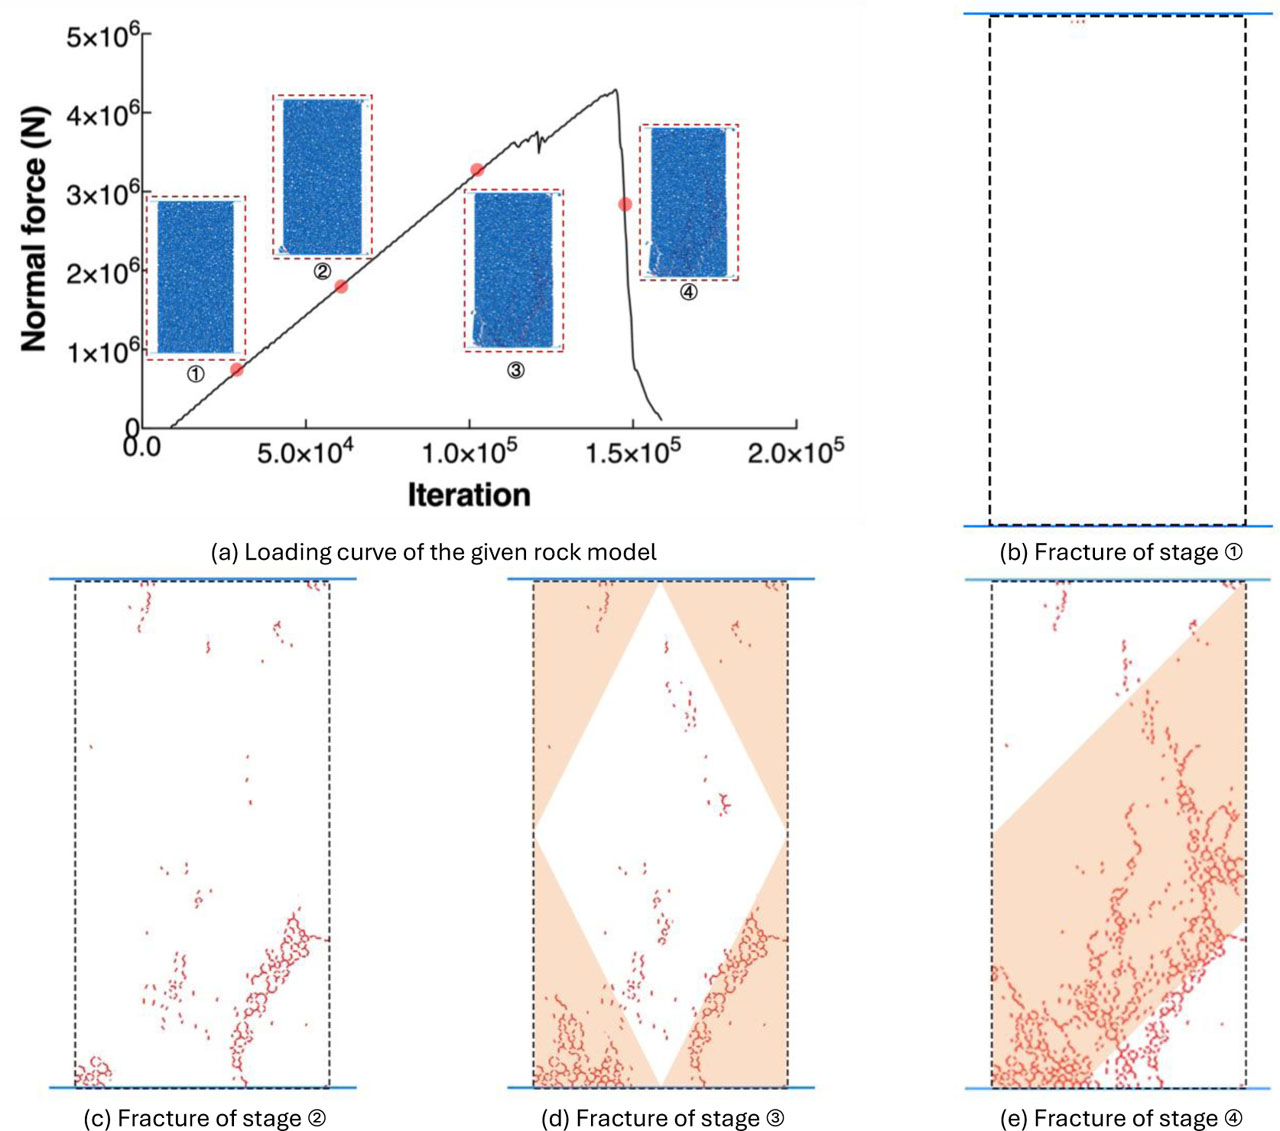
Figure 17:
The generating and extending process of the fractures in the uniaxial compression test