

Table 1:
Lists the details of specimens
| specimen | joint’s shape |
|---|---|
| T60-F0 | Flat (reference) |
| T60-P0 | trapezoidal |
| T60-T0 | triangular |
| T60-C0 | semi-circle Ø60mm |
| T60-R0 | composite rectangular (30*30) mm (key joint) |
| T60-FS | Flat separated |
| T60-FE | Flat epoxy bonding agent (Quick mast 108) |
| T60-HU | hole Ø60mm injection by ultra-high-performance concrete (UHPC) |
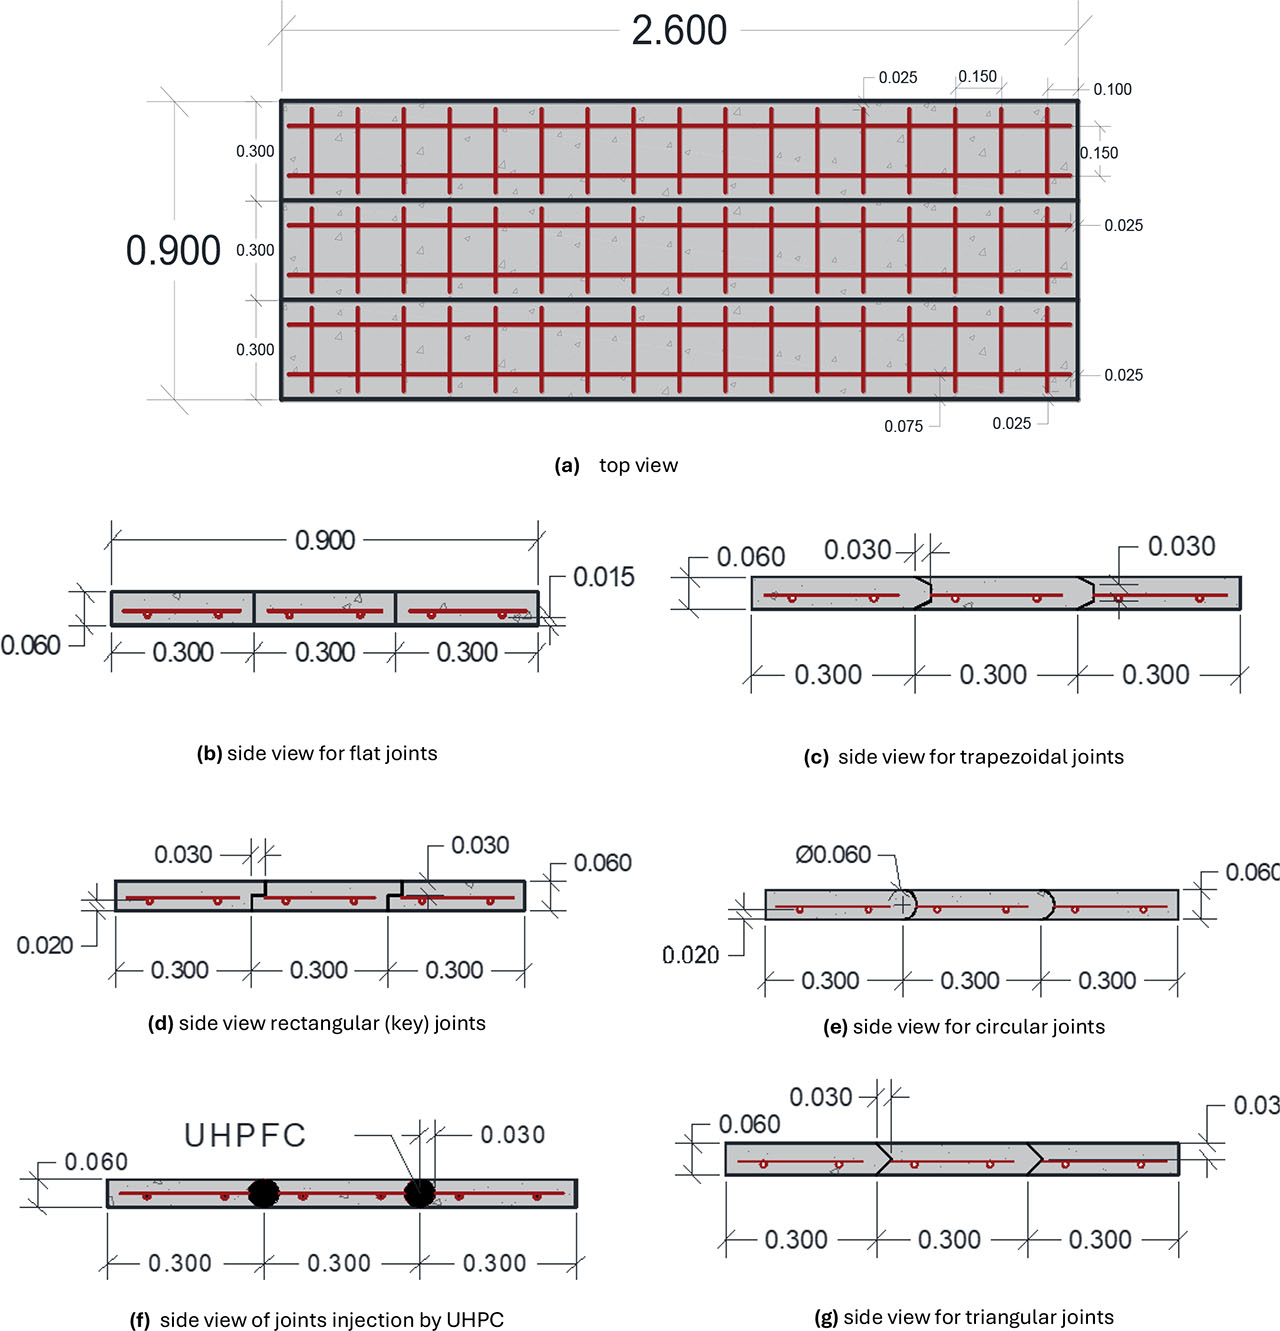
Figure 1:
Specimens details (unite in m)
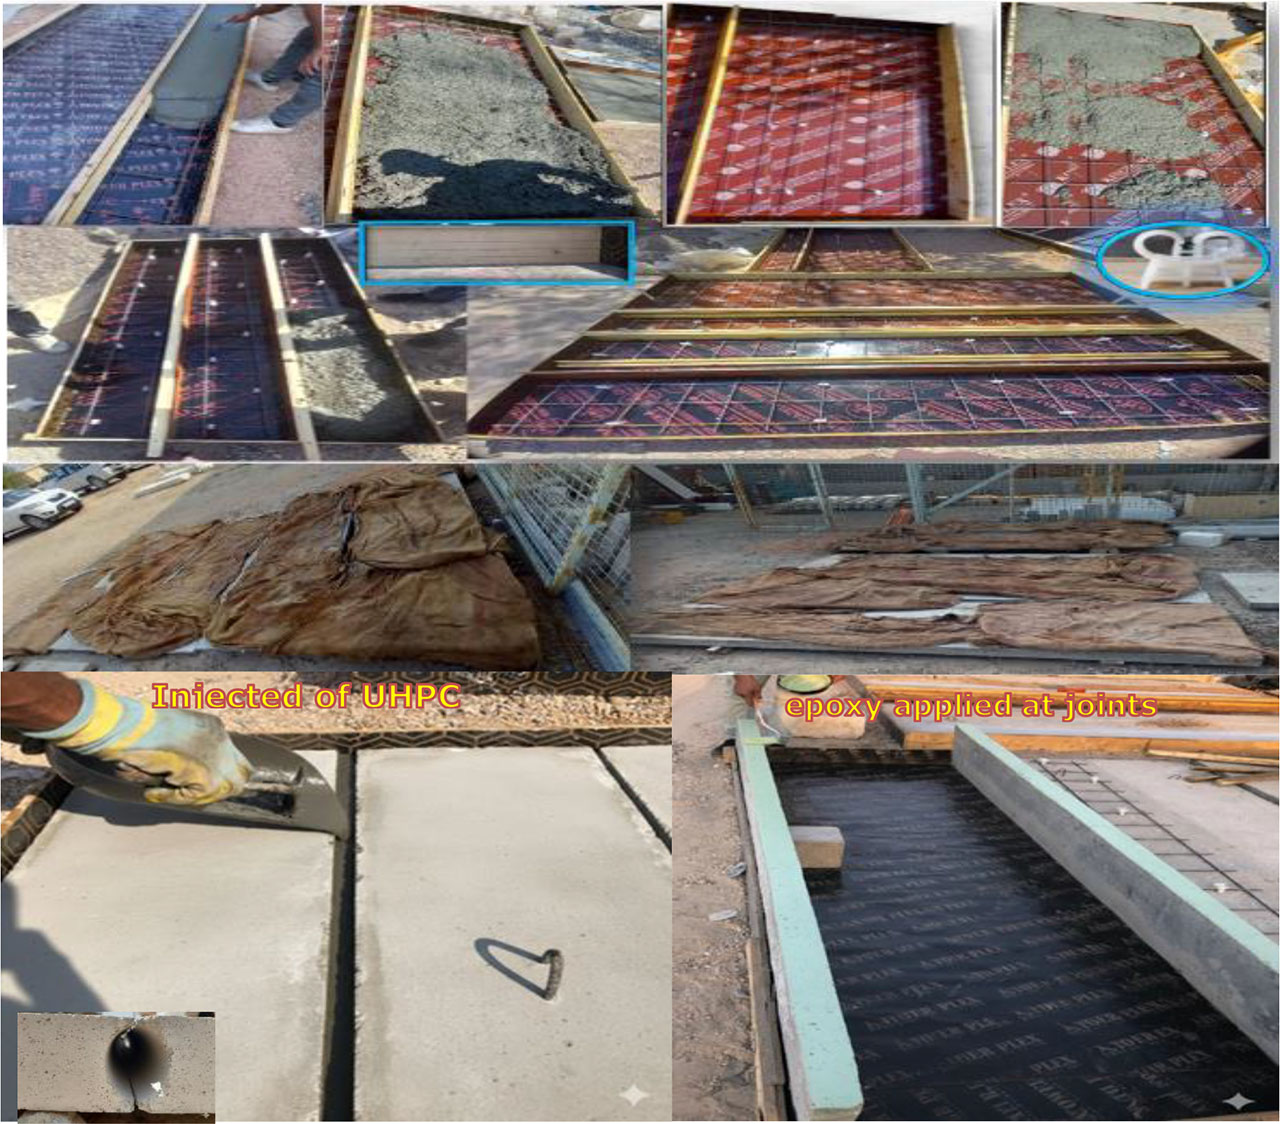
Figure 2:
Illustrate the reinforcement layout and specimen preparation
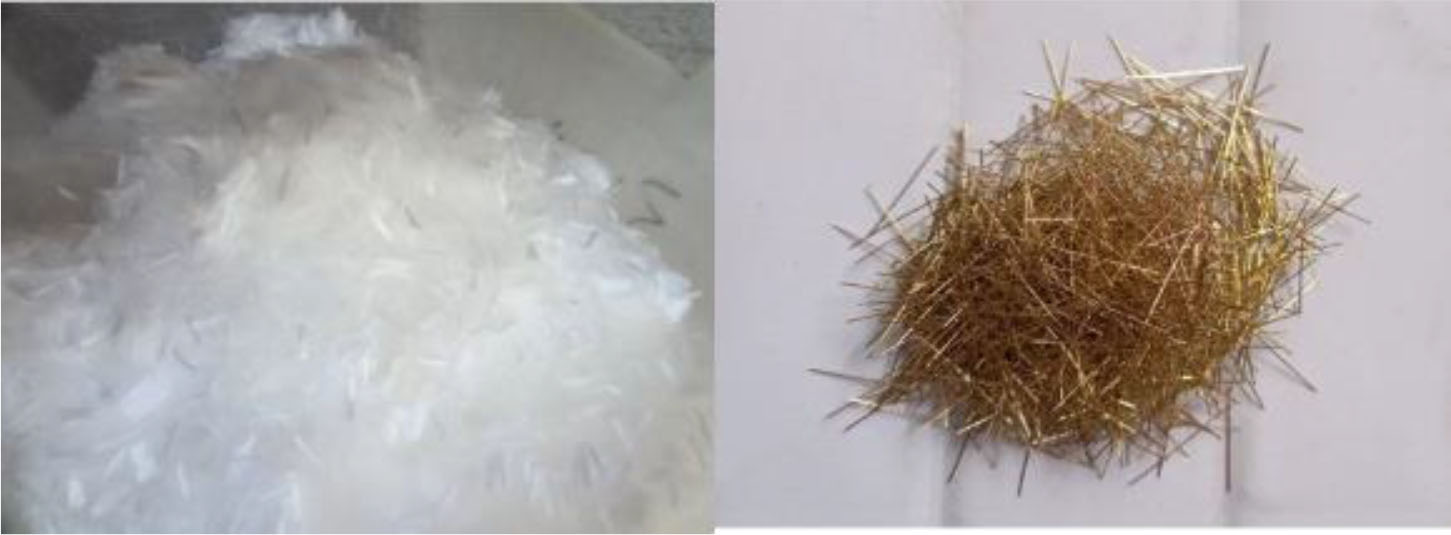
Figure 3:
Polypropylene and Micro steel fibres
Table 2:
Mix proportions of self-compact Polypropylene Fiber-Reinforced Concrete (SCPPFRC)
Table 3:
Mix proportions of ultra-high-performance concrete (UHPC)
Table 4:
Fresh properties result of SCC mix
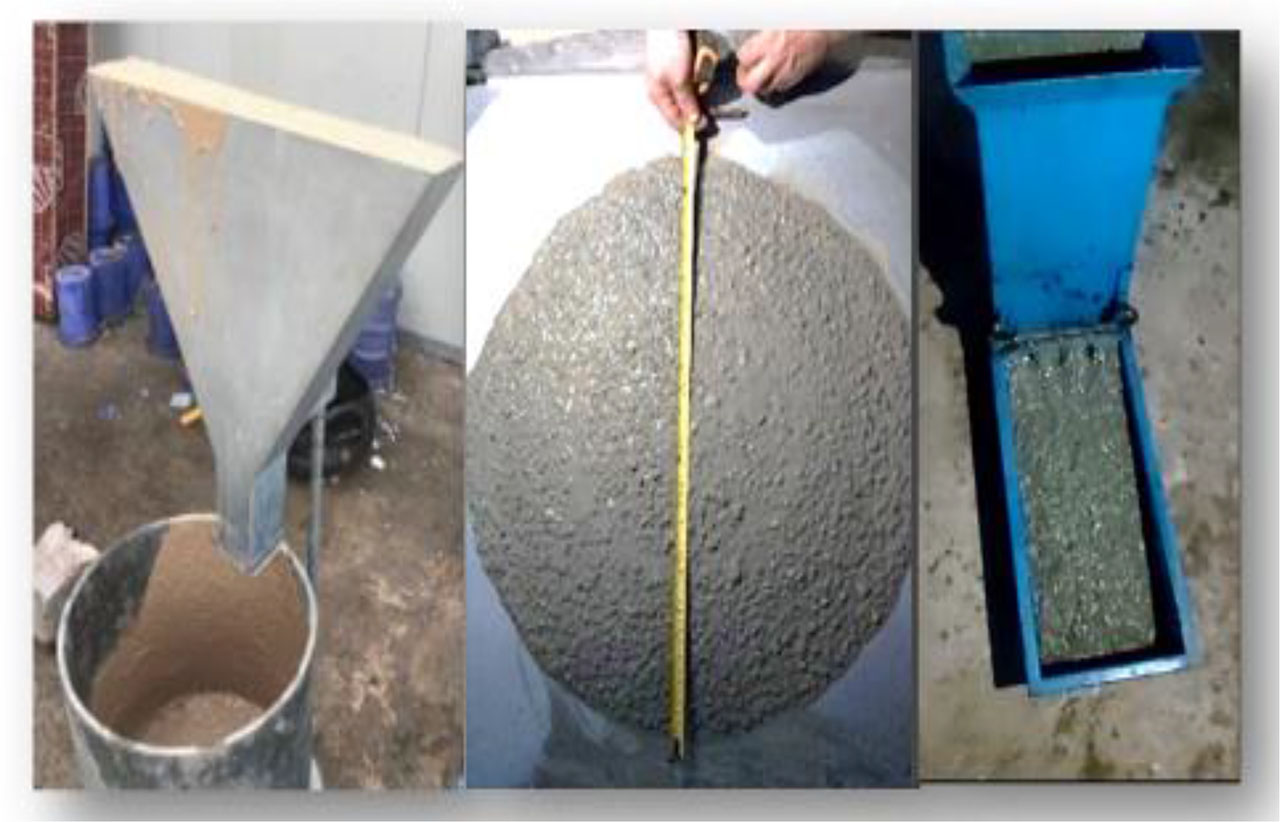
Figure 4:
V-funnel, slump flow and L-box tests of fresh concrete
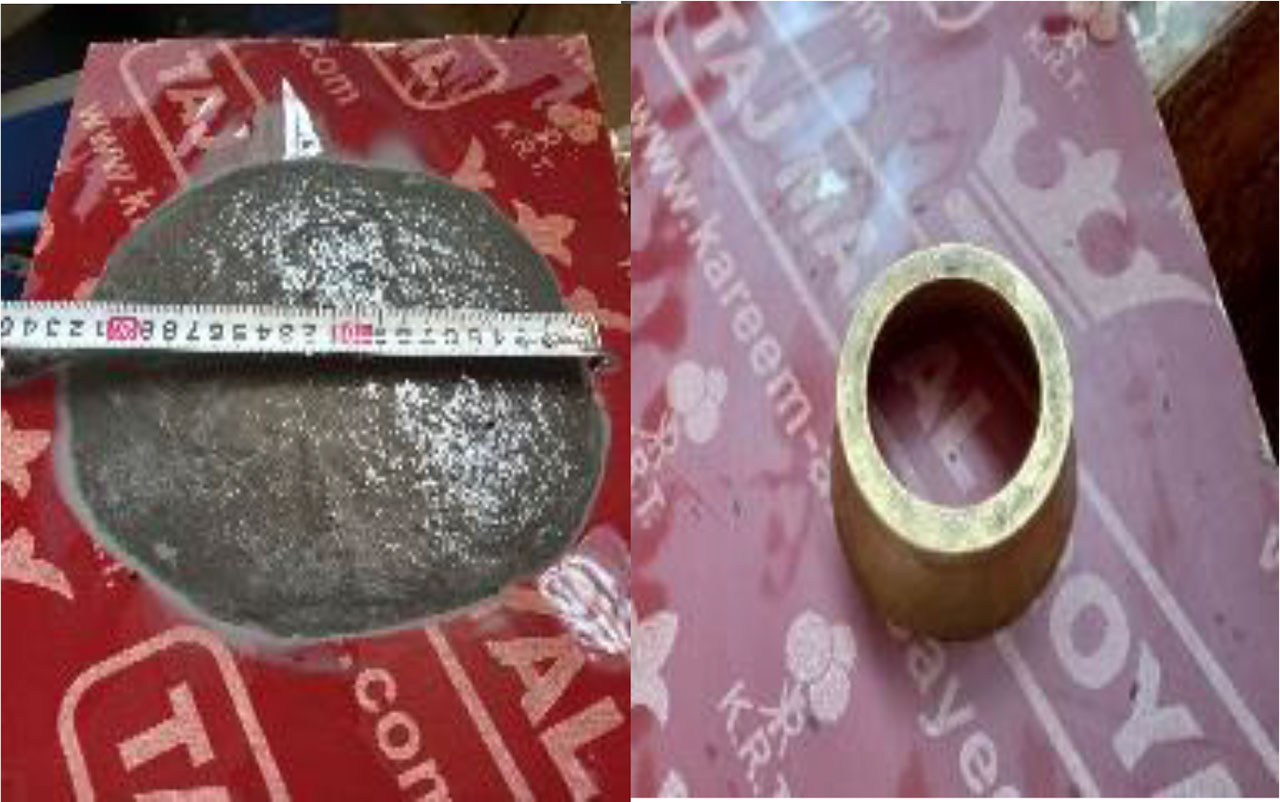
Figure 5:
Flow test procedure for UHPC
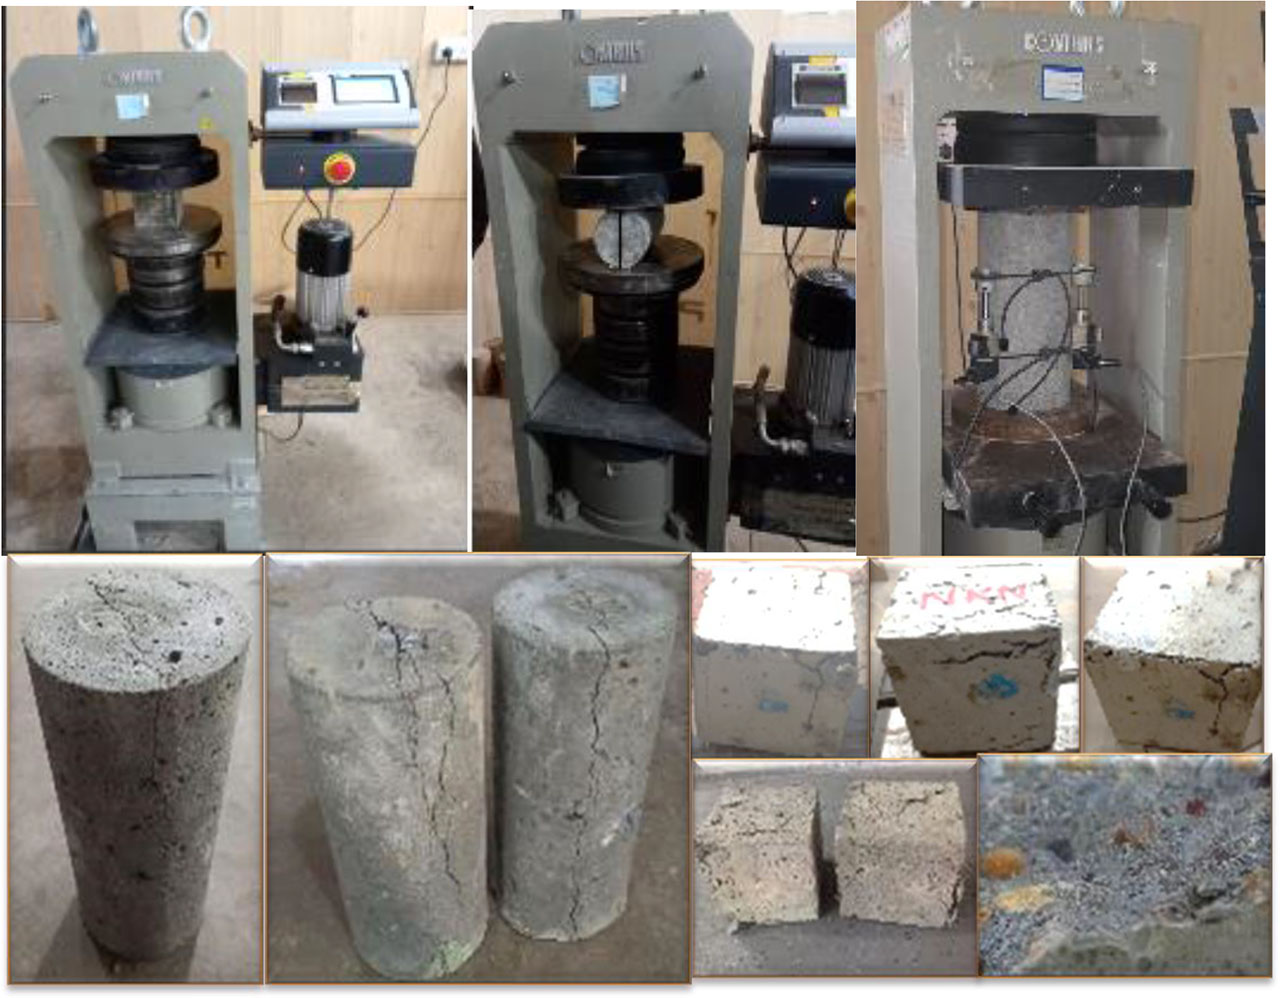
Figure 6:
Shows the testing process of the concrete material parameters
Table 5:
Mechanical properties of concrete
| The Mixing | Cubic Strength [MPa] | splitting tensile strength [MPa] | flexural strength [MPa] | Elastic Modulus [GPa] |
|---|---|---|---|---|
| Self-compact Polypropylene Fiber-Reinforced Concrete (SCPPFRC) | 38.71 | 4.86 | 4.62 | 33 |
| Ultra-high-performance concrete (UHPC) | 127.34 | 14.13 | 16.65 | 50 |
Table 6:
Mechanical properties of steel reinforcements
| Nominal diameter (mm) | Actual Diameter [mm] | Yield Stress [MPa] | Ultimate Stress [MPa] | Elastic Modulus [GPa] |
|---|---|---|---|---|
| 6 | 5.9 | 405 | 490 | 200 |
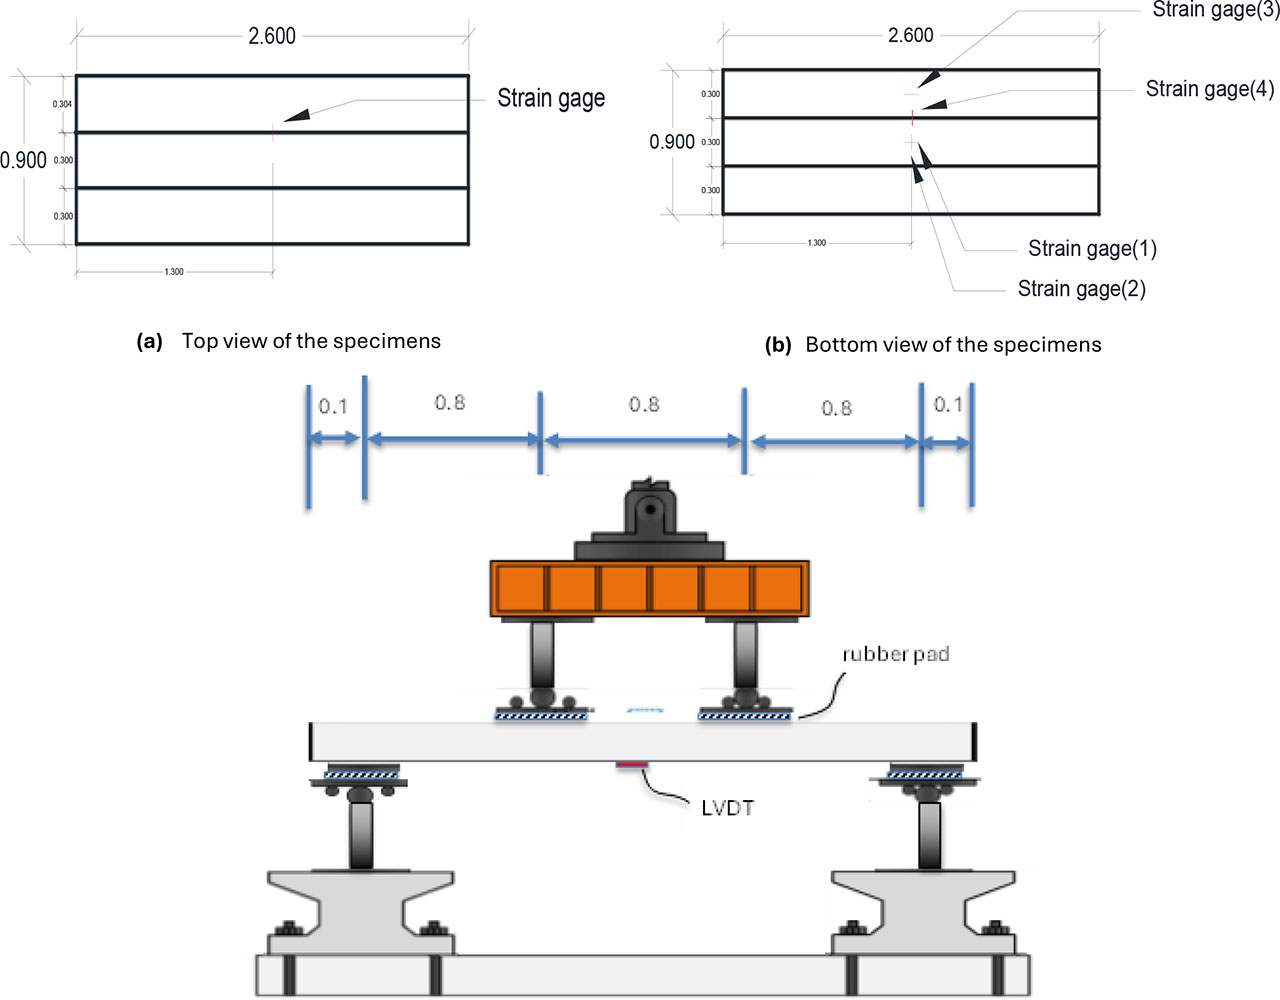
Figure 7:
Schematic diagram of the specimen monitoring system (unit:m)
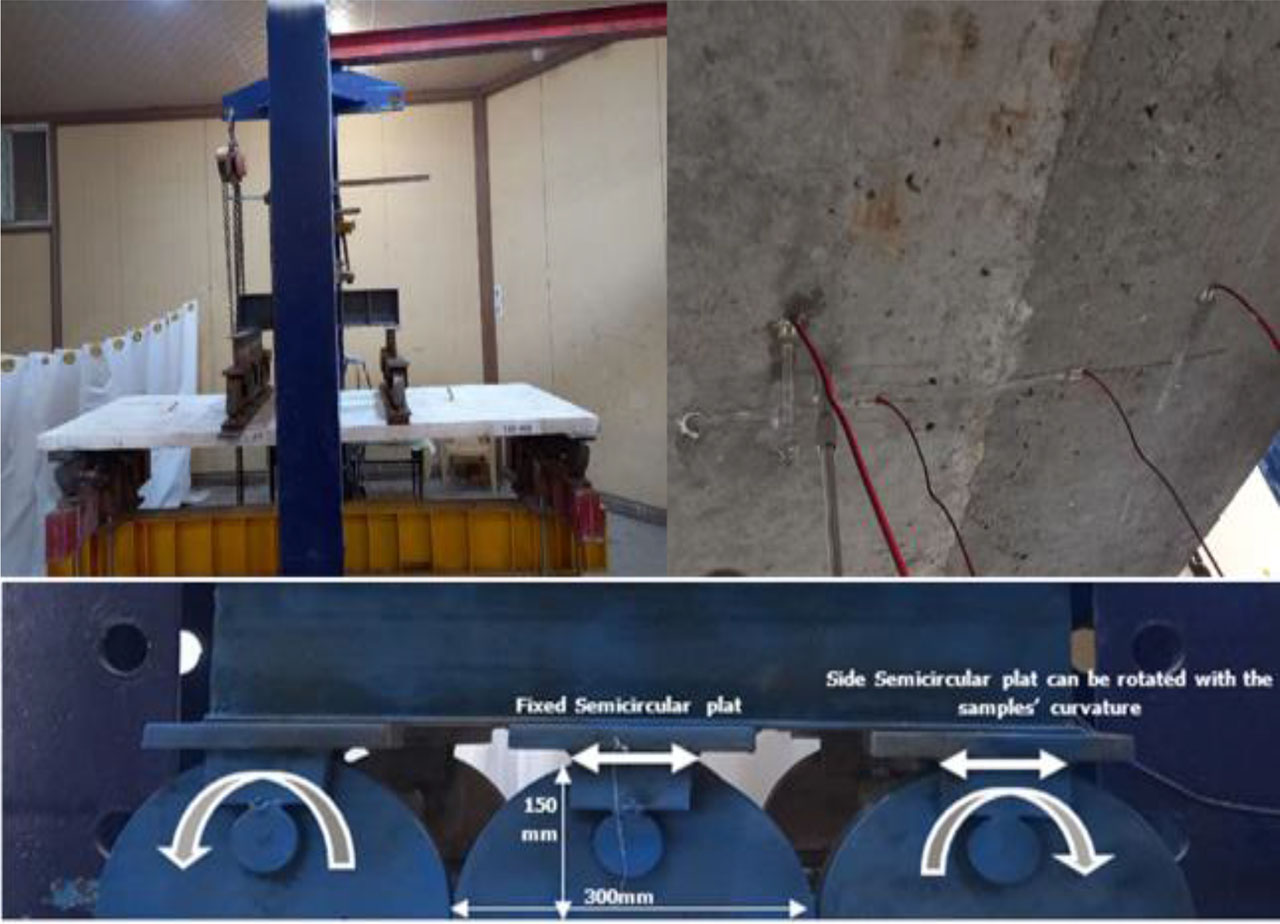
Figure 8:
Experimental Loading Setup System
Table 7:
Characteristic loads, midspan deflections and ductility coefficients of specimens with different joint shape
| specimen | Interaction area of joints | Pcr | Pyield | δyield | Pultimate | δultimate | Ductility |
|---|---|---|---|---|---|---|---|
| [mm2/m] | [kN] | [kN] | [mm] | [kN] | [mm] | ||
| T60-F0 | 6.00 | 2.74 | 2.72 | 5.04 | 5.14 | 52.92 | 10.50 |
| T60-R0 | 9.00 | 2.57(↓7%) * | 2.54 (↓7%) * | 4.4 (↓13%) * | 5.17(↑0.6%) * | 47.80(↓10%) * | 10.86 |
| T60-P0 | 9.70 | 2.65(↓3%) * | 2.60 (↓4%) * | 5.25 (↑4%) * | 5.59 (↑9%) * | 47.75 (↓10%) * | 9.10 |
| T60-T0 | 8.49 | 3.84(↑40%) * | 3.64 (↑34%) * | 4.25 (↓16%) * | 5.71 (↑11%) * | 41.14 (↓22%) * | 9.68 |
| T60-C0 | 9.42 | 2.91(↑6.2%) * | 2.71 (↓0.4%) * | 4.80 (↓5%) * | 6.01 (↑17%) * | 43.20 (↓18%) * | 9.00 |
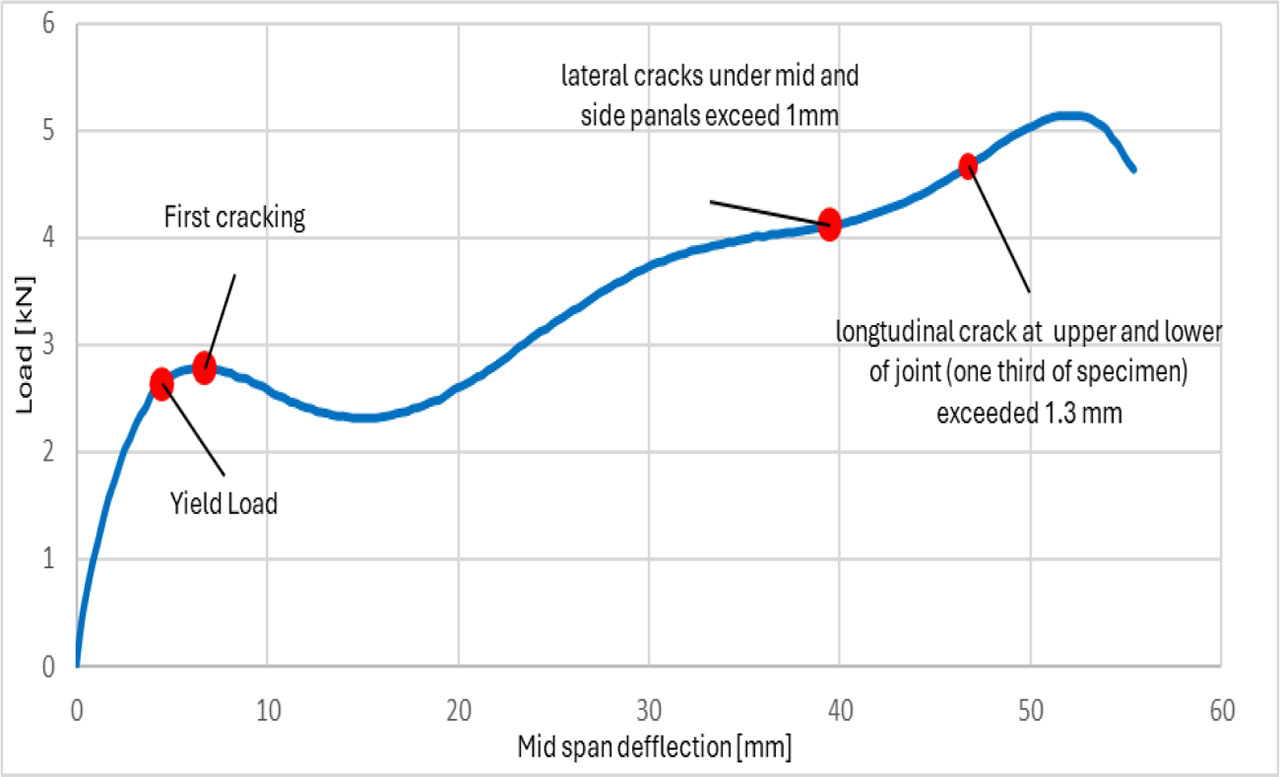
Figure 9:
Load-deflection curves of the tested specimens with flat joints (T60-F0)
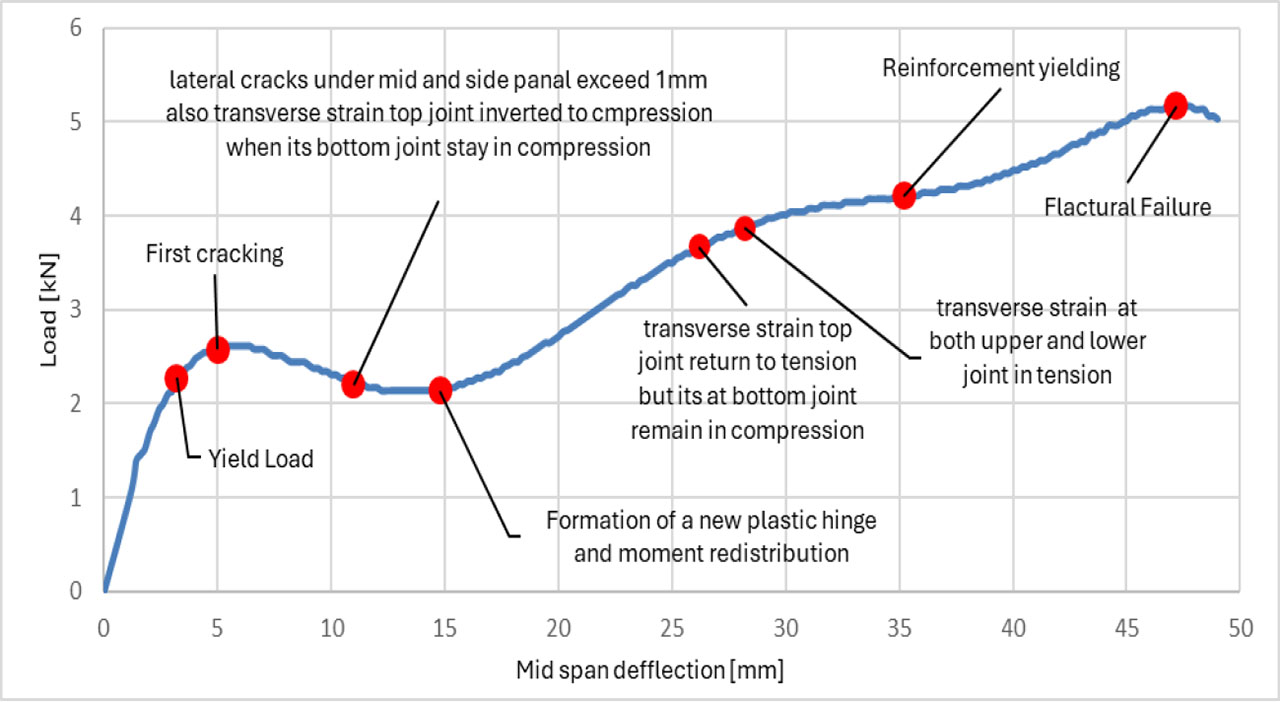
Figure 10:
Load-deflection curves of the tested specimens with key joints (T60-R0)
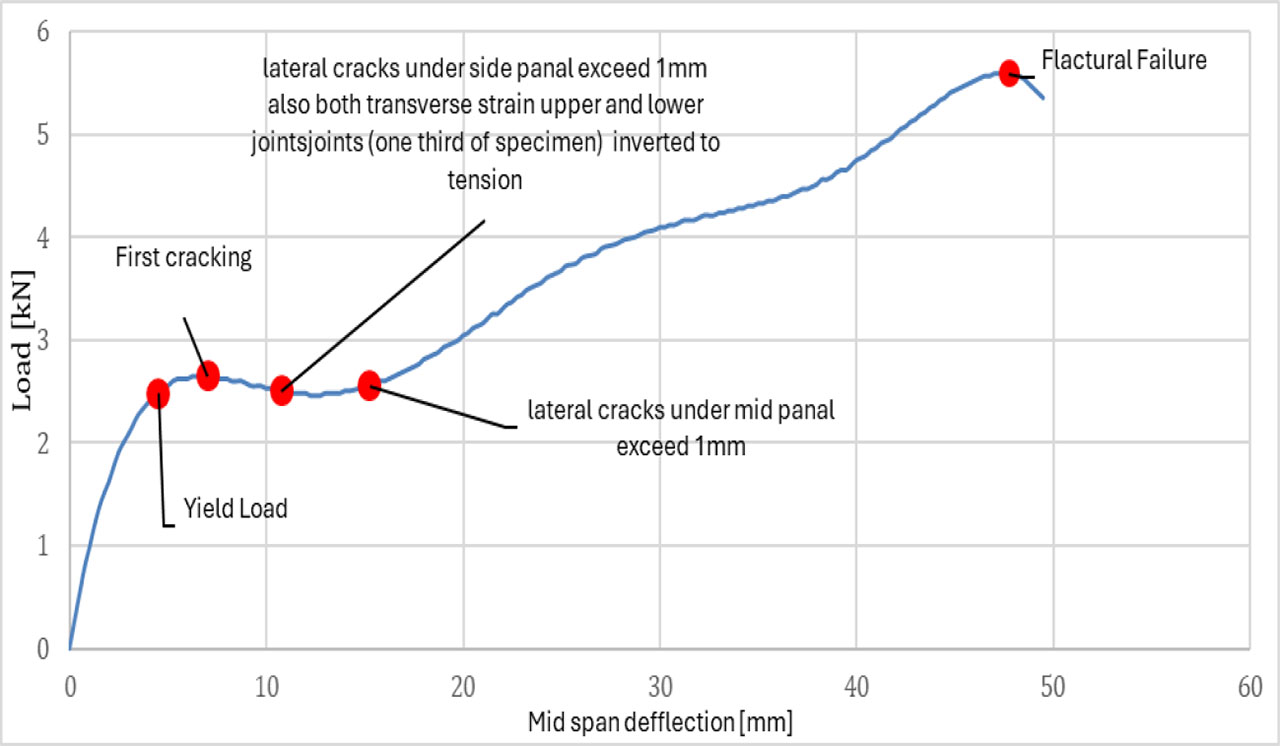
Figure 11:
Load-deflection curves of the tested specimens with trapezoidal joints (T60-P0)
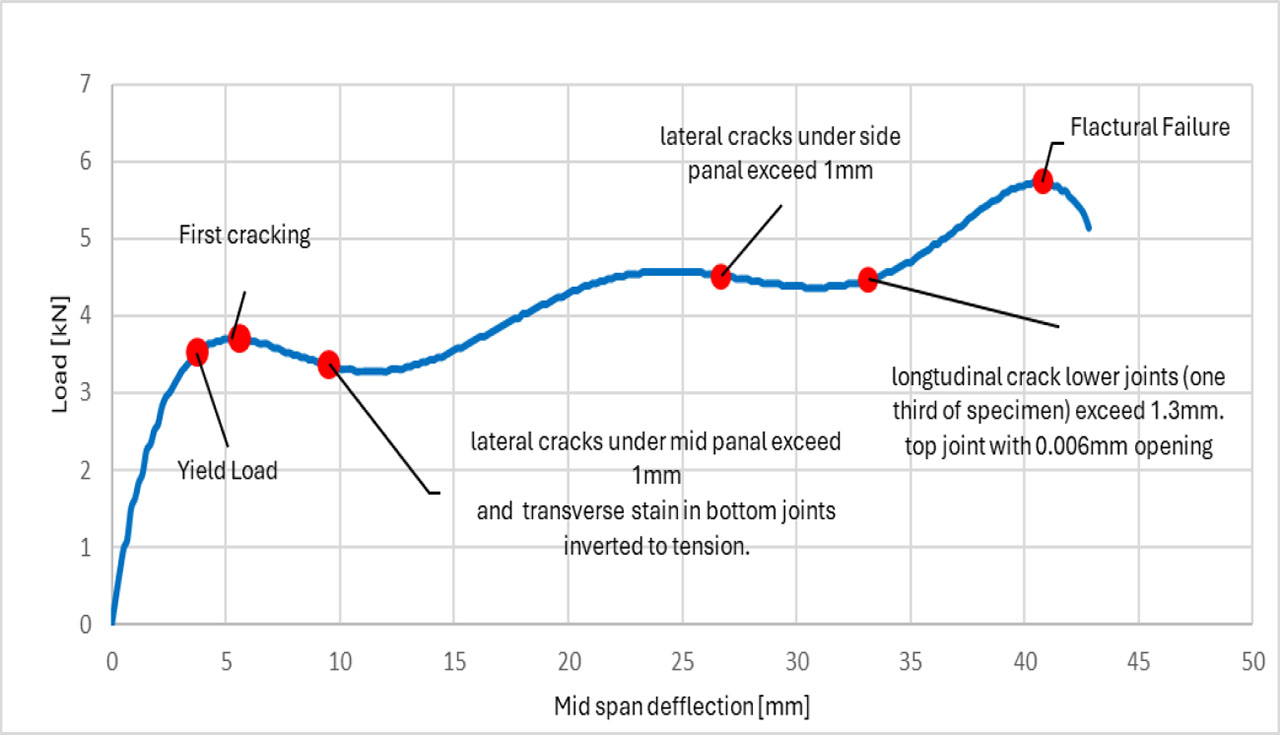
Figure 12:
Load-deflection curves of the tested specimens with triangle joints (T60-T0)
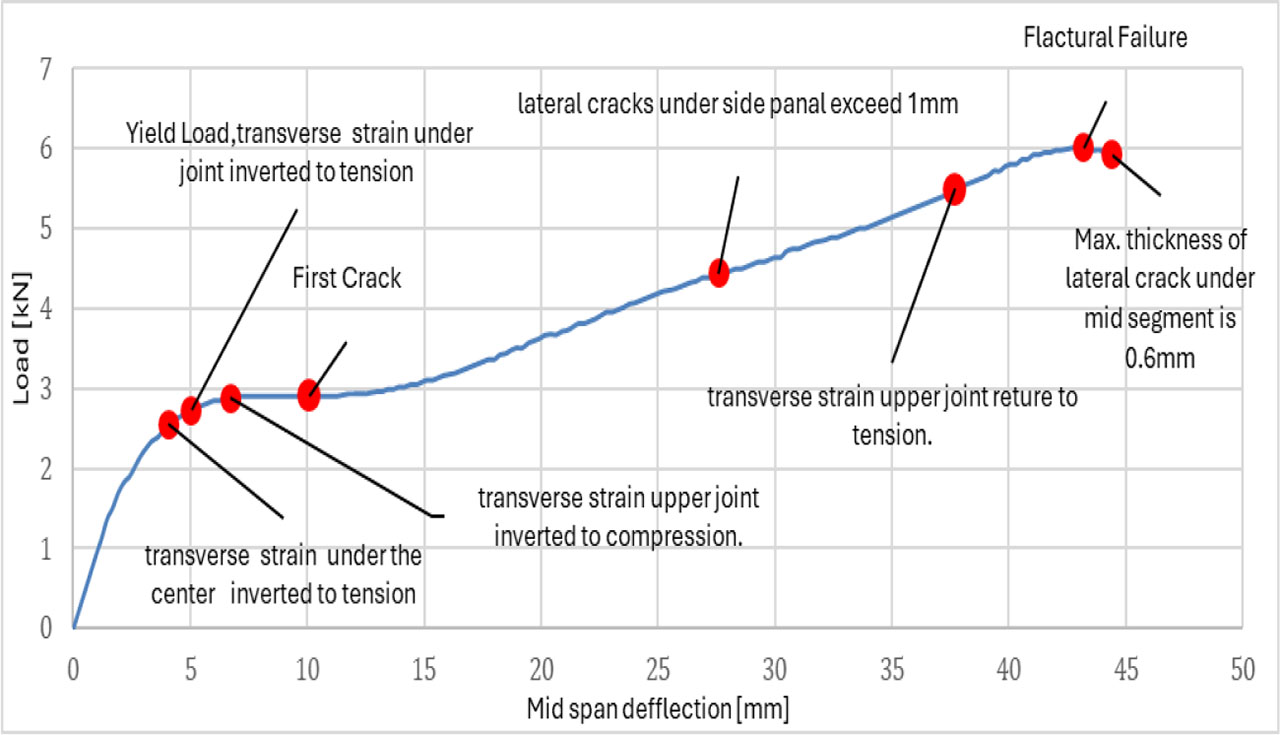
Figure 13:
Load-deflection curves of the tested specimens with triangle joints (T60-C0)
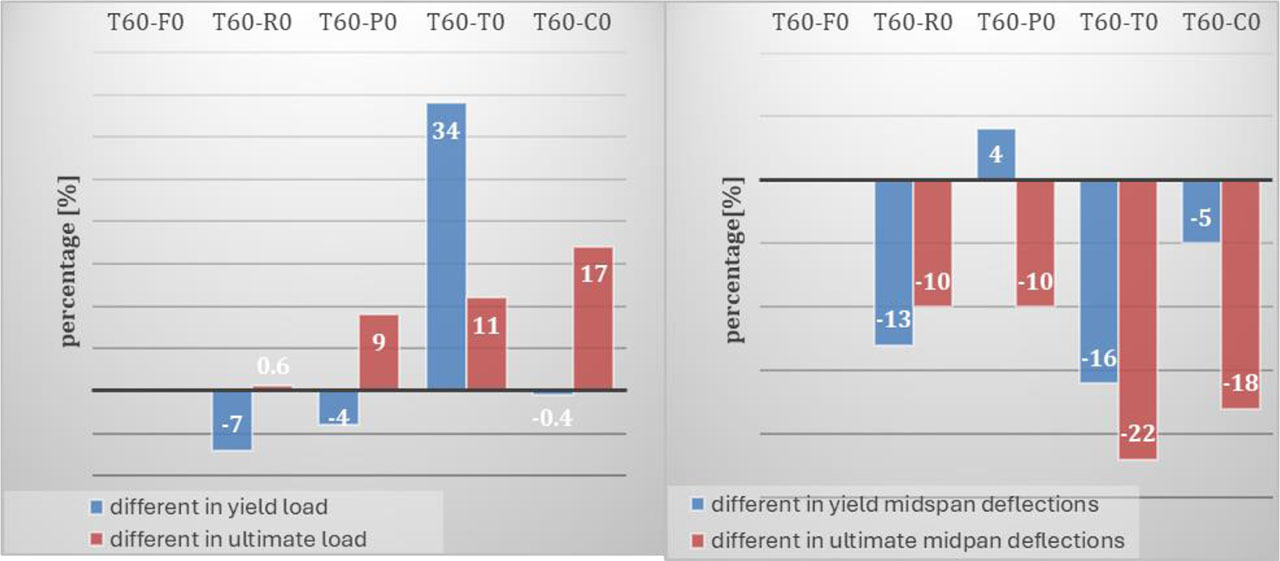
Figure 14:
Variation of load and midspan deflection of the tested specimens with different joints’ shapes
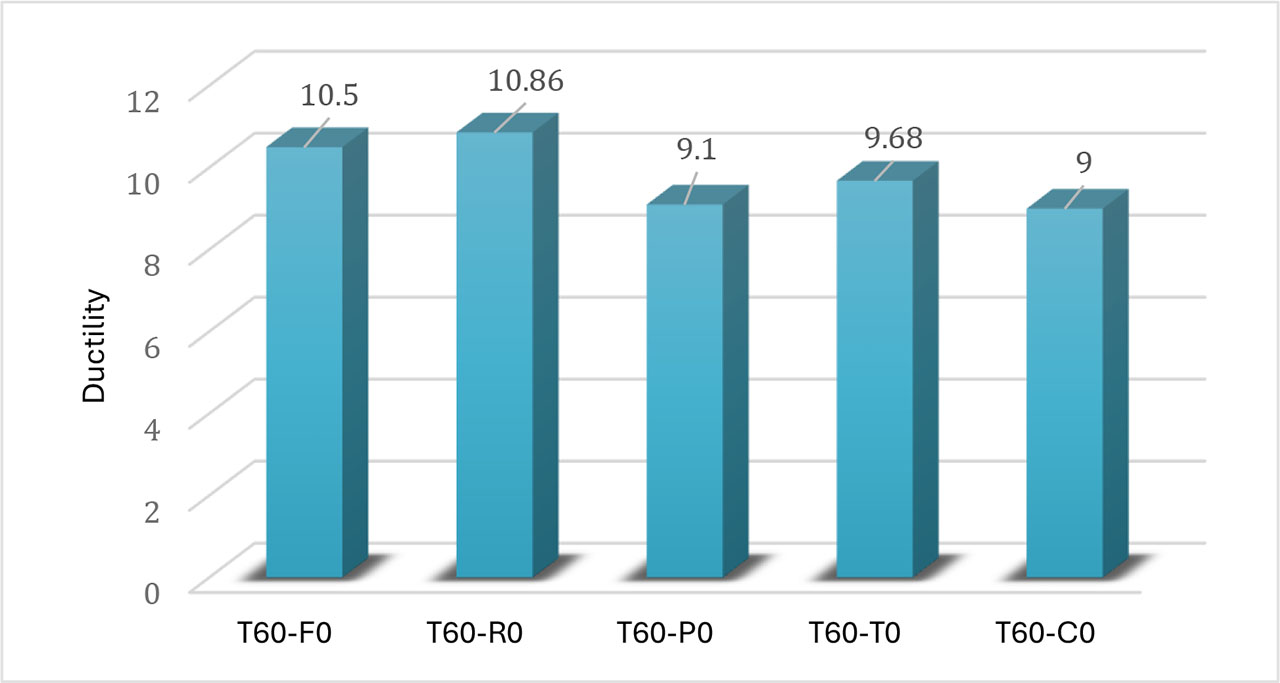
Figure 15:
Ductility of the tested specimens with different joint shapes
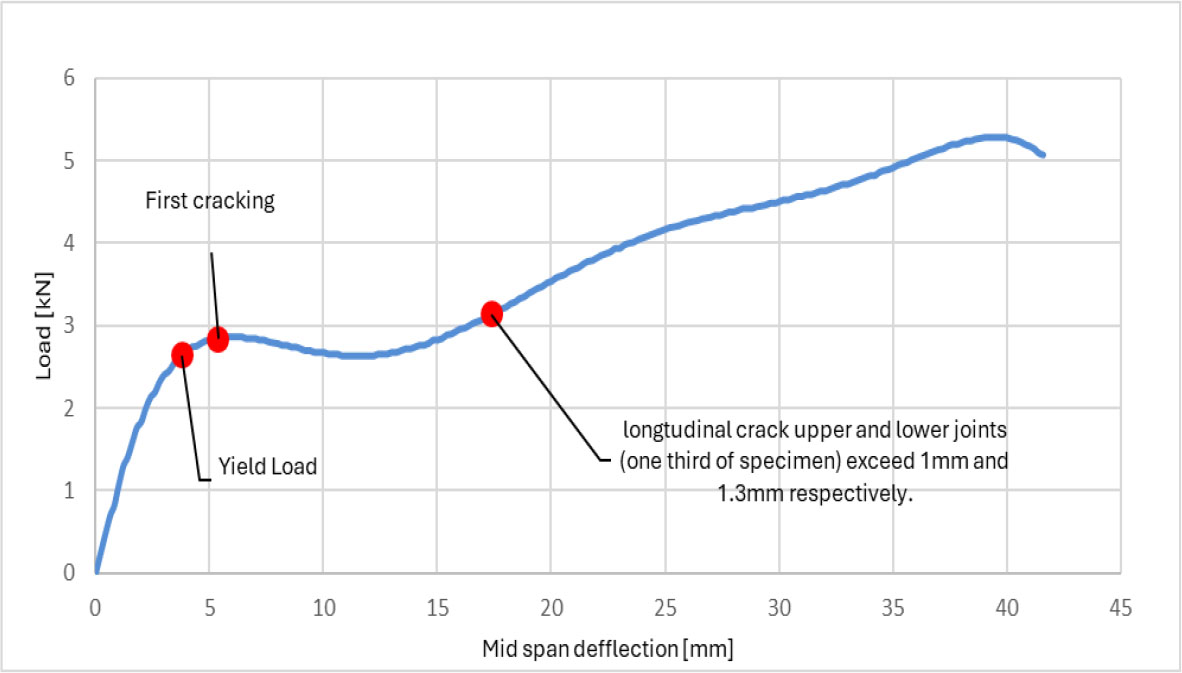
Figure 16:
Load-deflection curves of the tested specimen without any contact for flat joint (T60-F0)
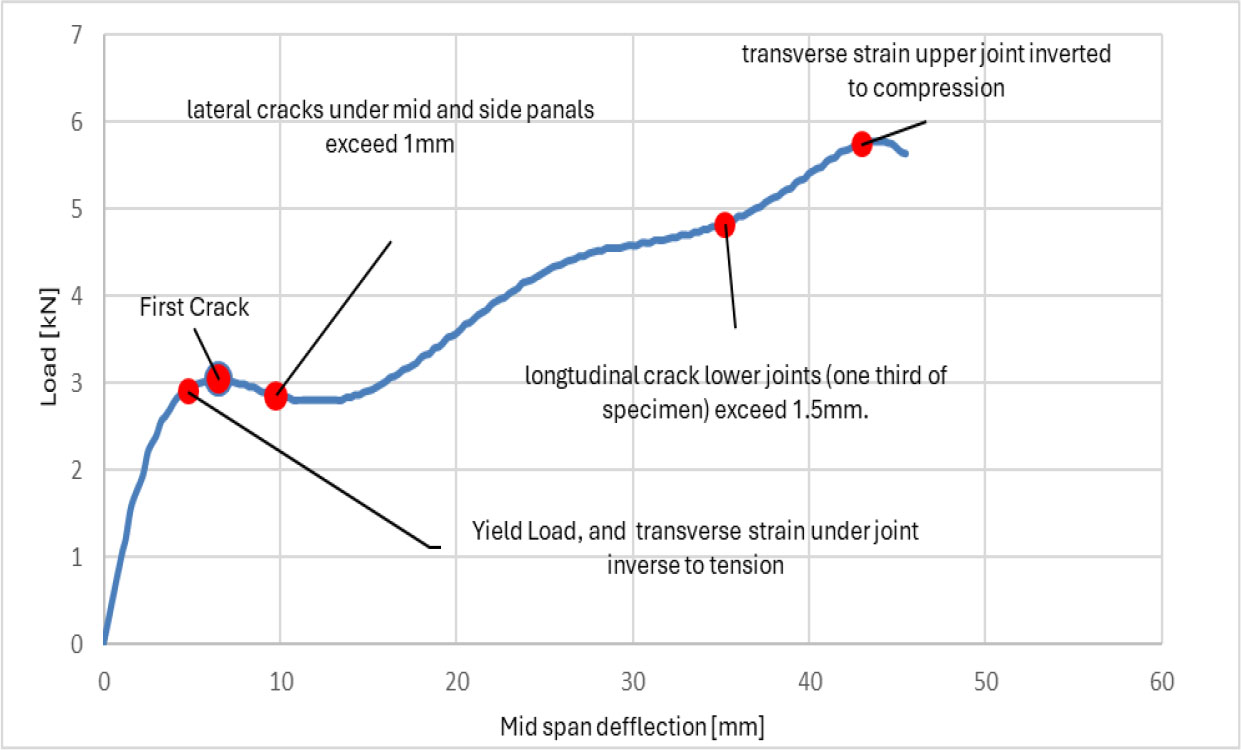
Figure 17:
Load-deflection curves of the tested specimen with epoxy-bonded flat joints (T60-FE)
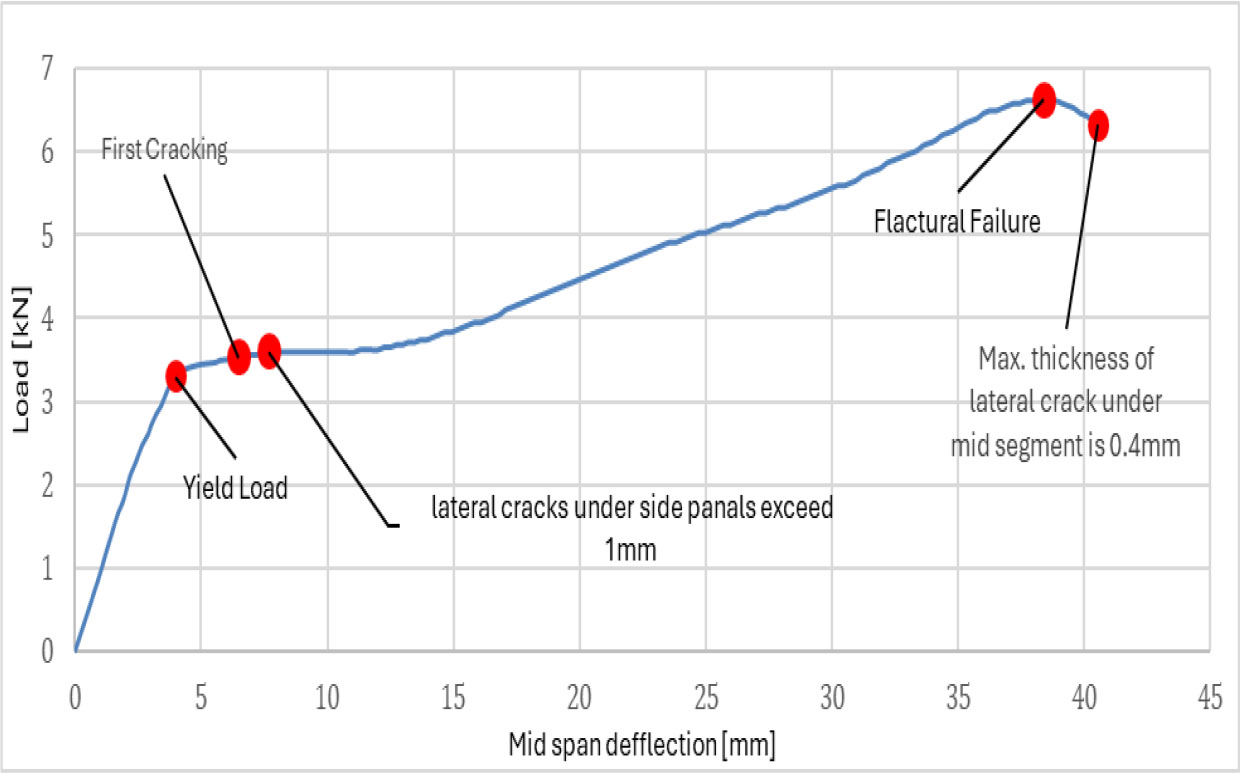
Figure 18:
Load-deflection curves of the tested specimens with UHPC-injected in hole joints (T60-HU)
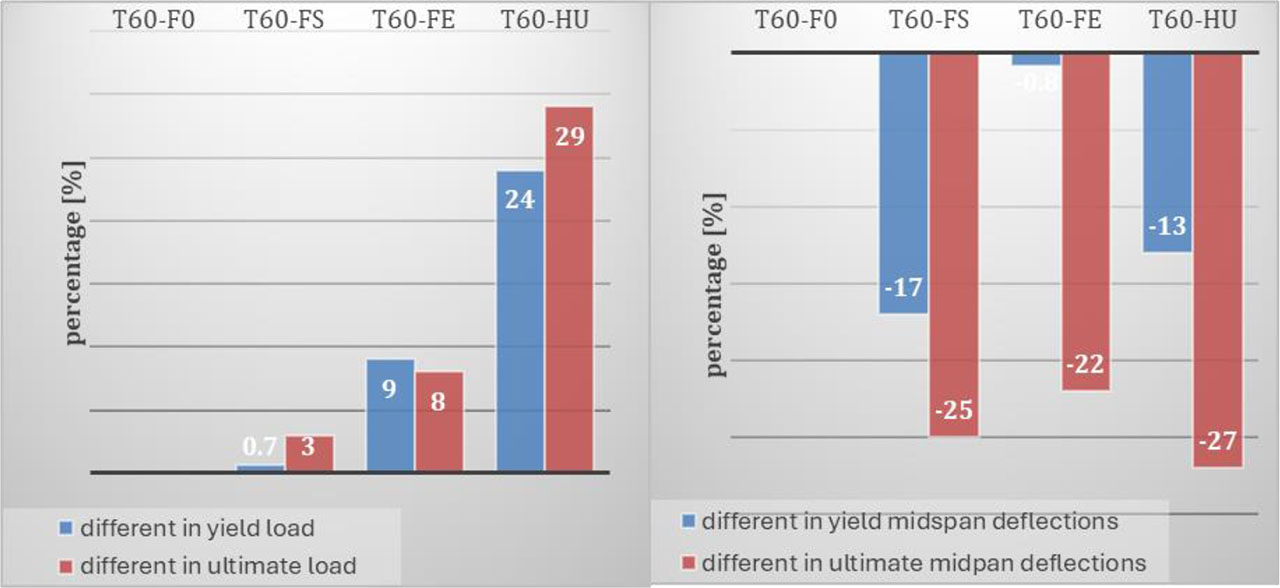
Figure 19:
Variation of load and midspan deflection of the tested specimens with different chemical treatments joints
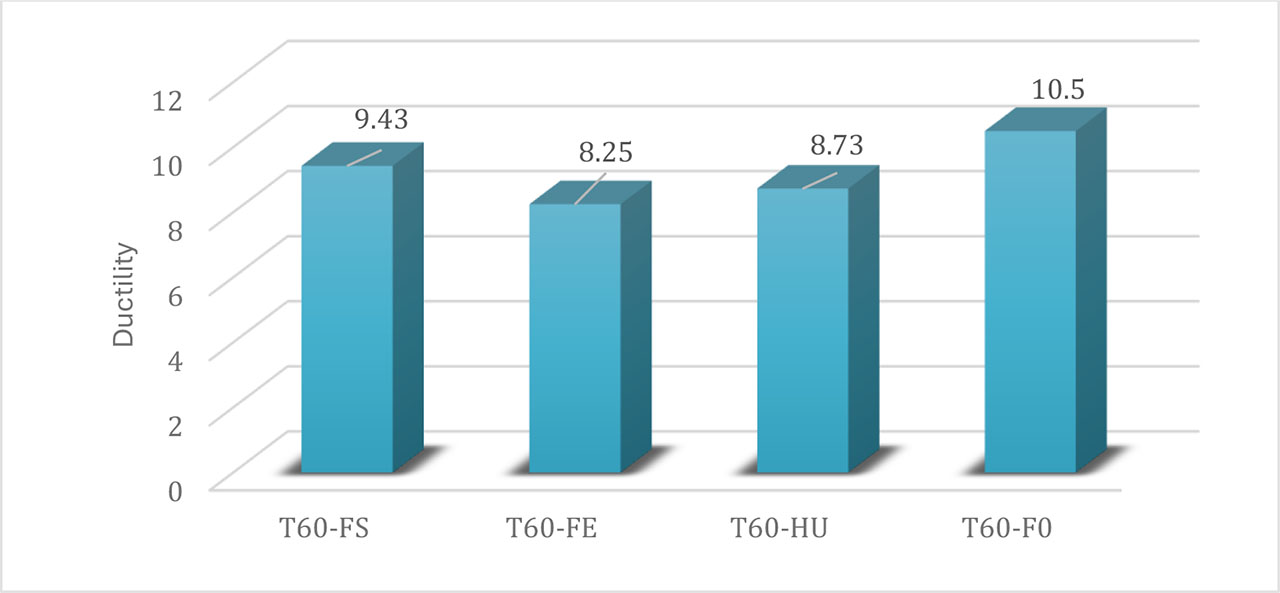
Figure 20:
Ductility of the tested specimens with different chemical treatments joint
Table 8:
Characteristic loads, midspan deflections and ductility of specimens with different chemical treatments joints
| specimen | Pcr | Pyield | δyield | Pultimate | δultimate | Ductility |
|---|---|---|---|---|---|---|
| [kN] | [kN] | [mm] | [kN] | [mm] | ||
| T60-F0 | 2.74 | 2.72 | 5.04 | 5.14 | 52.92 | 10.50 |
| T60-FS | 2.86(↑4.4%) * | 2.74 (↑0.7%) * | 4.20 (↓17%) * | 5.28(↑3%) * | 39.60 (↓25%) * | 9.43 |
| T60-FE | 3.00(↑9.5%) * | 2.96 (↑9%) * | 5.00 (↓0.8%) * | 5.57 (↑8%) * | 41.25 (↓22%) * | 8.25 |
| T60-HU | 3.53(↑29%) * | 3.45 (↑27%) * | 4.40 (↓13%) * | 6.62 (↑29%) * | 38.40 (↓27%) * | 8.73 |
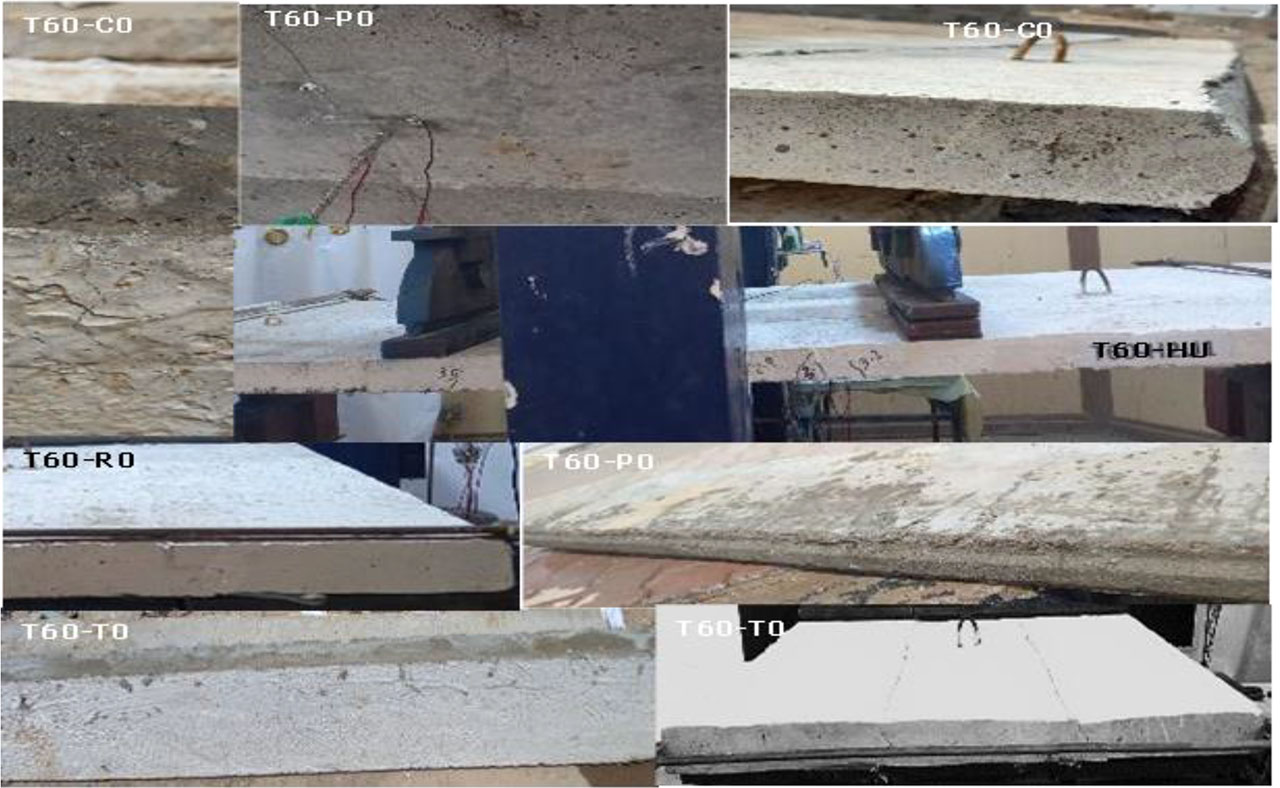
Figure 21:
Failure Mode of specimens
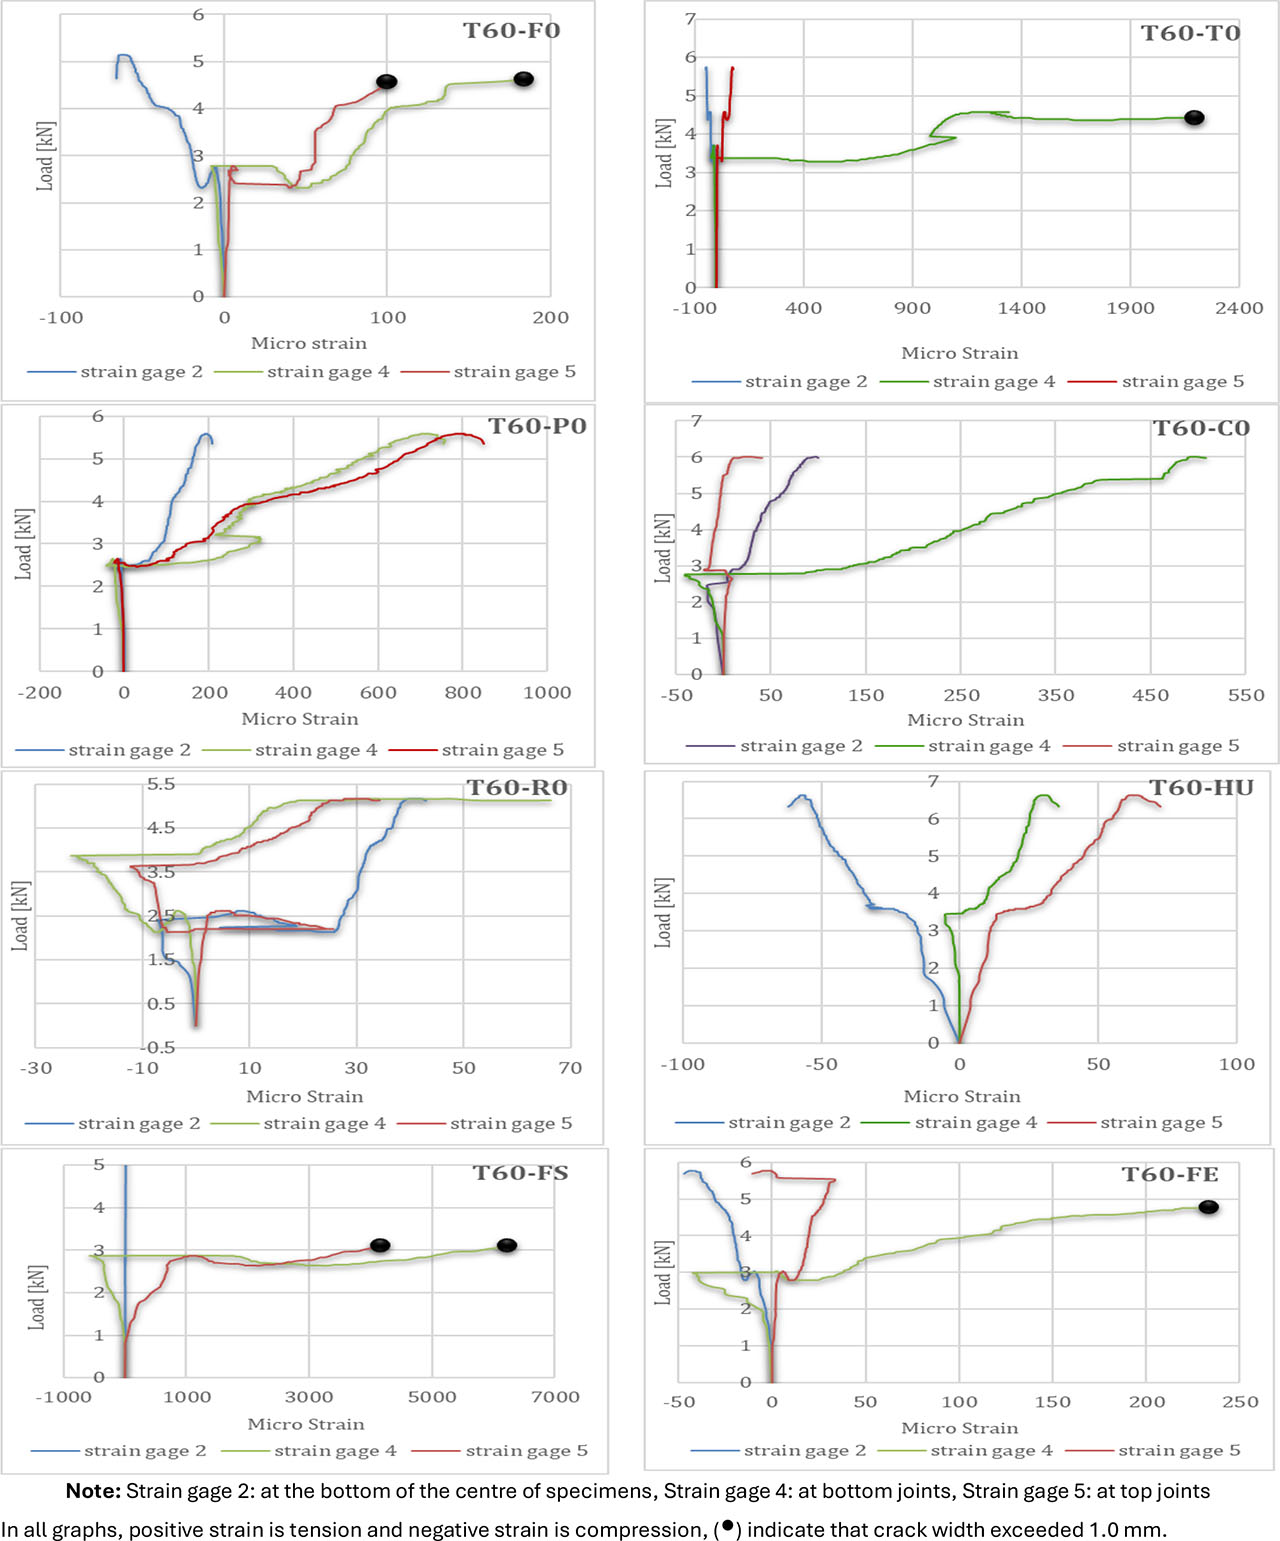
Figure 22:
Load-transverse strain curves at the midspan of the tested
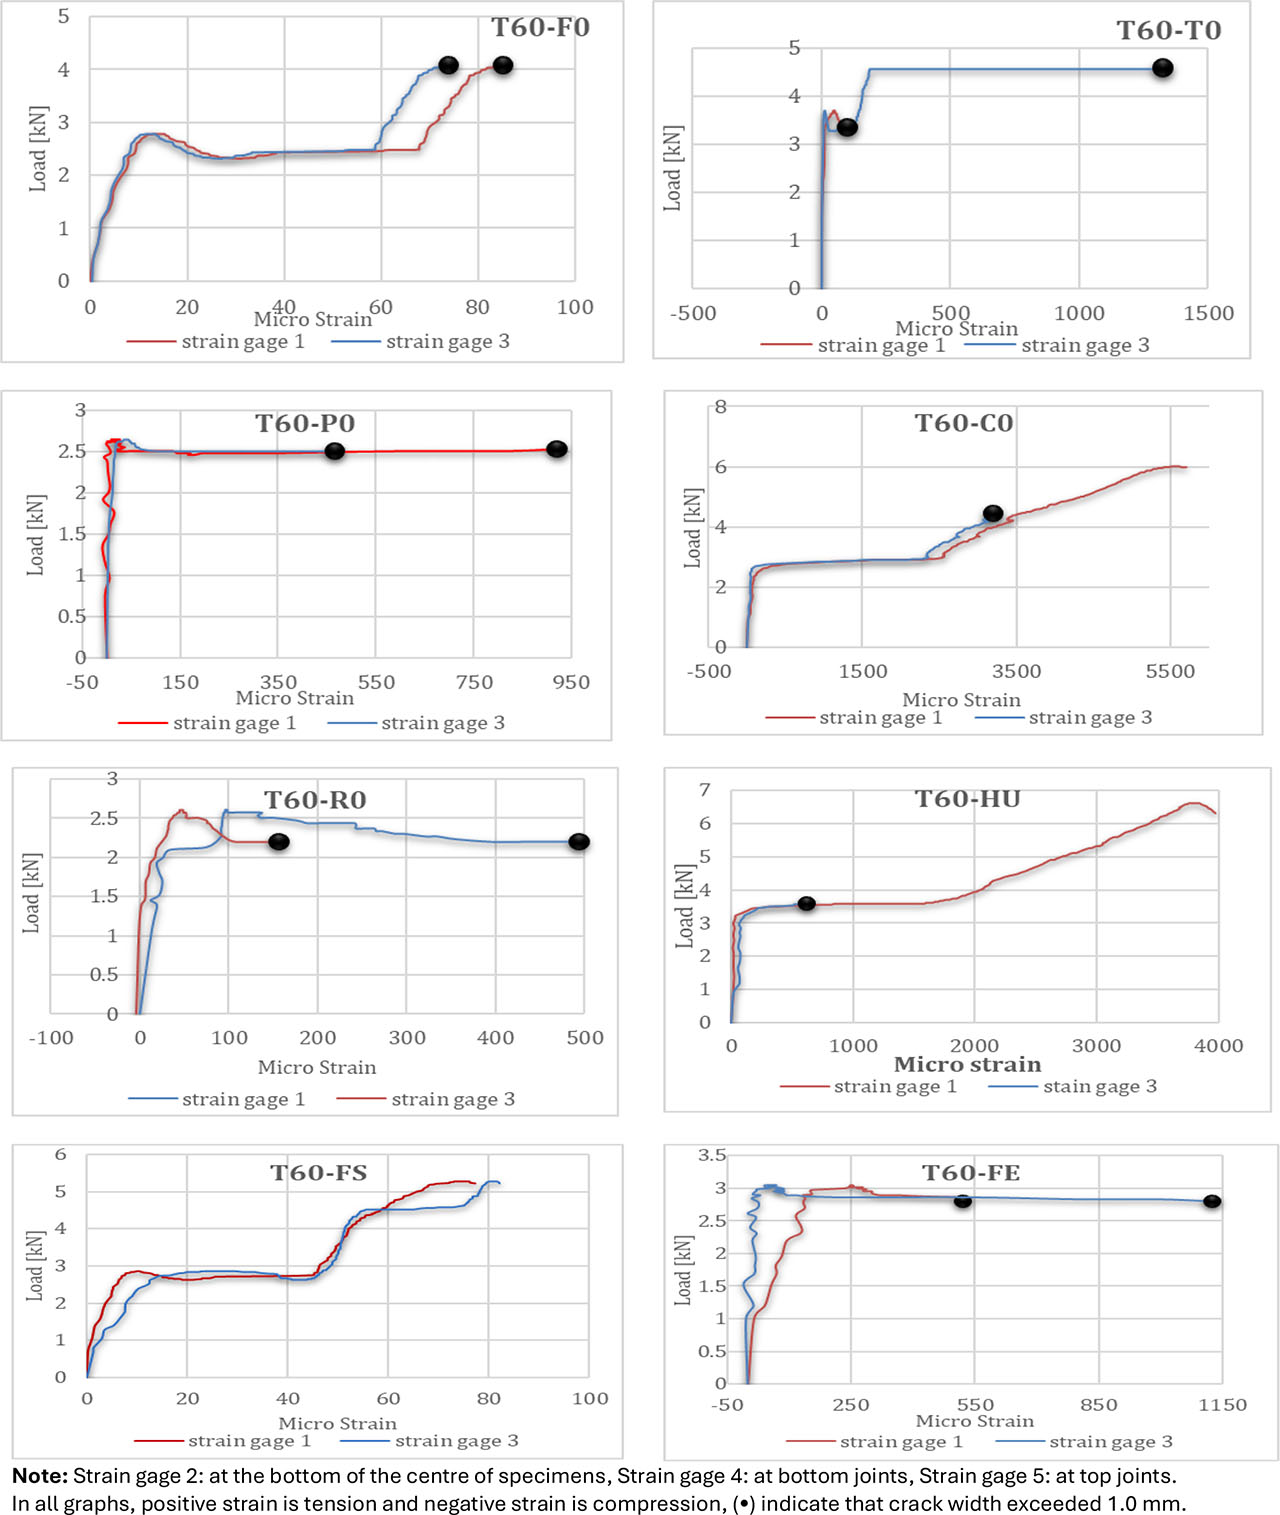
Figure 23:
Load-longitudinally strain curves at midspan of the tested specimens