

1. Introduction
Diaphragm walls are critical structural elements in deep excavation projects, providing lateral support and groundwater control. Their performance relies heavily on the continuity and integrity of the concrete matrix, which is often compromised by cold joints formed during sequential casting. These joints introduce weak planes that reduce mechanical strength and increase susceptibility to cracking under loading (James & Kurian, 2022).
The joints have a stronger impact on the calculated displacements and must discussed how the choice of joint type and construction method can influence project timelines and overall efficiency. Powrie and Batten (2000) found that the presence of cold joints can reduce the effective bending stiffness of a diaphragm wall by up to 40% compared to a monolithic wall. deeper joints enhance stability but increase logistical complexity. In constrained environments, optimizing junction types—specifically single blade water stops or milling—is critical for ensuring watertightness at depth (Vidil, P., & Bachy, S., 2018). Self-compacting polypropylene concrete (SCPPRC) has been widely adopted to improve ductility and crack resistance (Ahmad et al., 2022). Addition of fibres to concrete helps makes the material more isotropic and transforms its brittle nature into a more ductile one. Test results showed that fibre-reinforced concrete (FRC) achieved higher compressive, split tensile, and flexural strengths compared to normal concrete, also exhibited lower water absorption (Reddy & Reddy, 2023). Self-compacting polypropylene fibre-reinforced concrete (SCFRC) was utilized to accommodate the small sectional thickness of the specimens. This selection aimed to mitigate early-age cracking and prevent brittle failure, ensuring enhanced ductility and stable post-cracking behaviour during testing.
(Yousef et al., 2025) evaluated the impact of wall thickness and cold joints on SCFRC diaphragm wall performance using scaled models. Results showed that higher aspect ratios significantly improve stiffness, while cold joints reduced ultimate loads by up to 15%, particularly in thinner, more flexible walls. However, while this research quantified joint-induced weaknesses, it did not investigate mechanical interlocking or chemical bonding strategies as mitigation measures.
While prior studies have explored diaphragm wall techniques, strategies for cold joint mitigation remain under addressed(James & Kurian, 2018). This study fills this gap by epoxy bonding (Kadhum et al., 2024) and utilizing Ultra-High-Performance Concrete (UHPC) for joint injection leveraging its superior bond quality and suitability for precise connections (Al-Rubaye et al., 2020; Yousef et al., 2022), alongside various geometric interfaces (trapezoidal and triangular) (Liu et al., 2025). Although these profiles are known to enhance mechanical interlock in precast structures, their effectiveness in cast-in-place diaphragm walls is evaluated here to ensure durable and stable structural performance. Empirical findings indicate that the application of UHPC overlays significantly enhances the shear capacity of reinforced concrete (RC) structures (Safaa, Ahmed, & Majid M.A. Kadhim, 2025). Overall, experimental results confirm that UHPFRC significantly boosts the performance limits and residual capacity of steel–concrete composite systems under extreme dynamic loading and blast events (Čítek, Adam, et al., 2025).
Despite the critical role of joints in precast concrete diaphragm walls, their structural behaviour under complex stress states remains insufficiently explored. While joints are typically formed parallel to the primary bending moment during staged casting, Timoshenko’s Plate Theory indicates a biaxial stress state that generates secondary moments, potentially compromising joint integrity. To address this, this study introduces a novel experimental approach using scaled models to evaluate the impact of geometric and chemical treatments on cracking load, yield capacity, and ductility. To overcome the technical complexities of soil-structure interaction, the wall was modelled as a one-way slab; despite this reduced scale, the models maintain the relative stiffness and small aspect ratio of full-scale field systems. This setup ensures a controlled investigation of structural responses under lateral loading, effectively capturing the significant spatial effects encountered in large-scale excavations for high-rise buildings and subways. Ultimately, this work provides empirical evidence for optimizing joint geometries, offering practical insights to enhance durability, load-bearing capacity, and watertight performance under real-world service loads.
2. Experimental Program
2.1. Specimen Design and Preparation
Eight large-scale specimens (60 × 900 × 2600 mm) were cast, each containing two cold joints. Before each casting, the molds were oiled and placed on level ground. Reinforcement consisted of two longitudinal deformed bars (Ø6 mm) with stirrups placed at 150 mm spacing and 15 mm cover for each segment. Plastic spacers were used to maintain the required clearances. All specimens were cast using Self-Compacting Polypropylene Fiber-Reinforced Concrete (SCPPFRC). Table 1 lists the details of specimens, only one specimen was tested for each case. Figures 1 and 2 illustrate the reinforcement layout and specimen preparation.
The joints were created by allowing the first concrete layer to set for 7 days before casting the adjacent layer. Surface preparation included roughening with wire brushes and cleaning to remove laitance. A 5-mm wooden spacer was used to cast the model sequentially in segmented form, and a wooden cutter shaped to the joint profile was employed to produce accurate interfaces. After the first segment was cast and cured for 7 days, the separator was removed to expose the joint surface. The subsequent segment was then cast following the same procedure: cleaning, oiling, placing reinforcement, and pouring fresh concrete against the hardened part. To maintain symmetry in the central segments, identical wooden inserts were used to replicate the joint shape on the opposite side. After 24 hours, the molds were removed, and the specimens were wrapped in wet burlap, which was moistened daily until 28 days of curing.
For chemically treated joints, epoxy (Quick Mast 108) was applied to flat surfaces, while UHPC (compressive strength = 150 MPa) was injected into 60 mm diameter holes. Prior to testing, the specimens were cleaned and painted white to facilitate crack observation. All tests were conducted in the Structural Laboratory of the College of Engineering, University of Babylon. For chemically treated joints, epoxy (Quick Mast 108) was applied to flat surfaces, while UHPC (compressive strength = 150 MPa) was injected into 60 mm diameter holes after internal surfaces of the precast elements are first cleaned to ensure proper bonding, then the segments are aligned within the formwork while maintaining the designed joint gap. Ultra-High-Performance Concrete (UHPC) is subsequently poured or injected into the cavity, where its high fluidity and self-compacting properties allow it to fully fill the joint,
Table 1:
Lists the details of specimens
| specimen | joint’s shape |
|---|---|
| T60-F0 | Flat (reference) |
| T60-P0 | trapezoidal |
| T60-T0 | triangular |
| T60-C0 | semi-circle Ø60mm |
| T60-R0 | composite rectangular (30*30) mm (key joint) |
| T60-FS | Flat separated |
| T60-FE | Flat epoxy bonding agent (Quick mast 108) |
| T60-HU | hole Ø60mm injection by ultra-high-performance concrete (UHPC) |
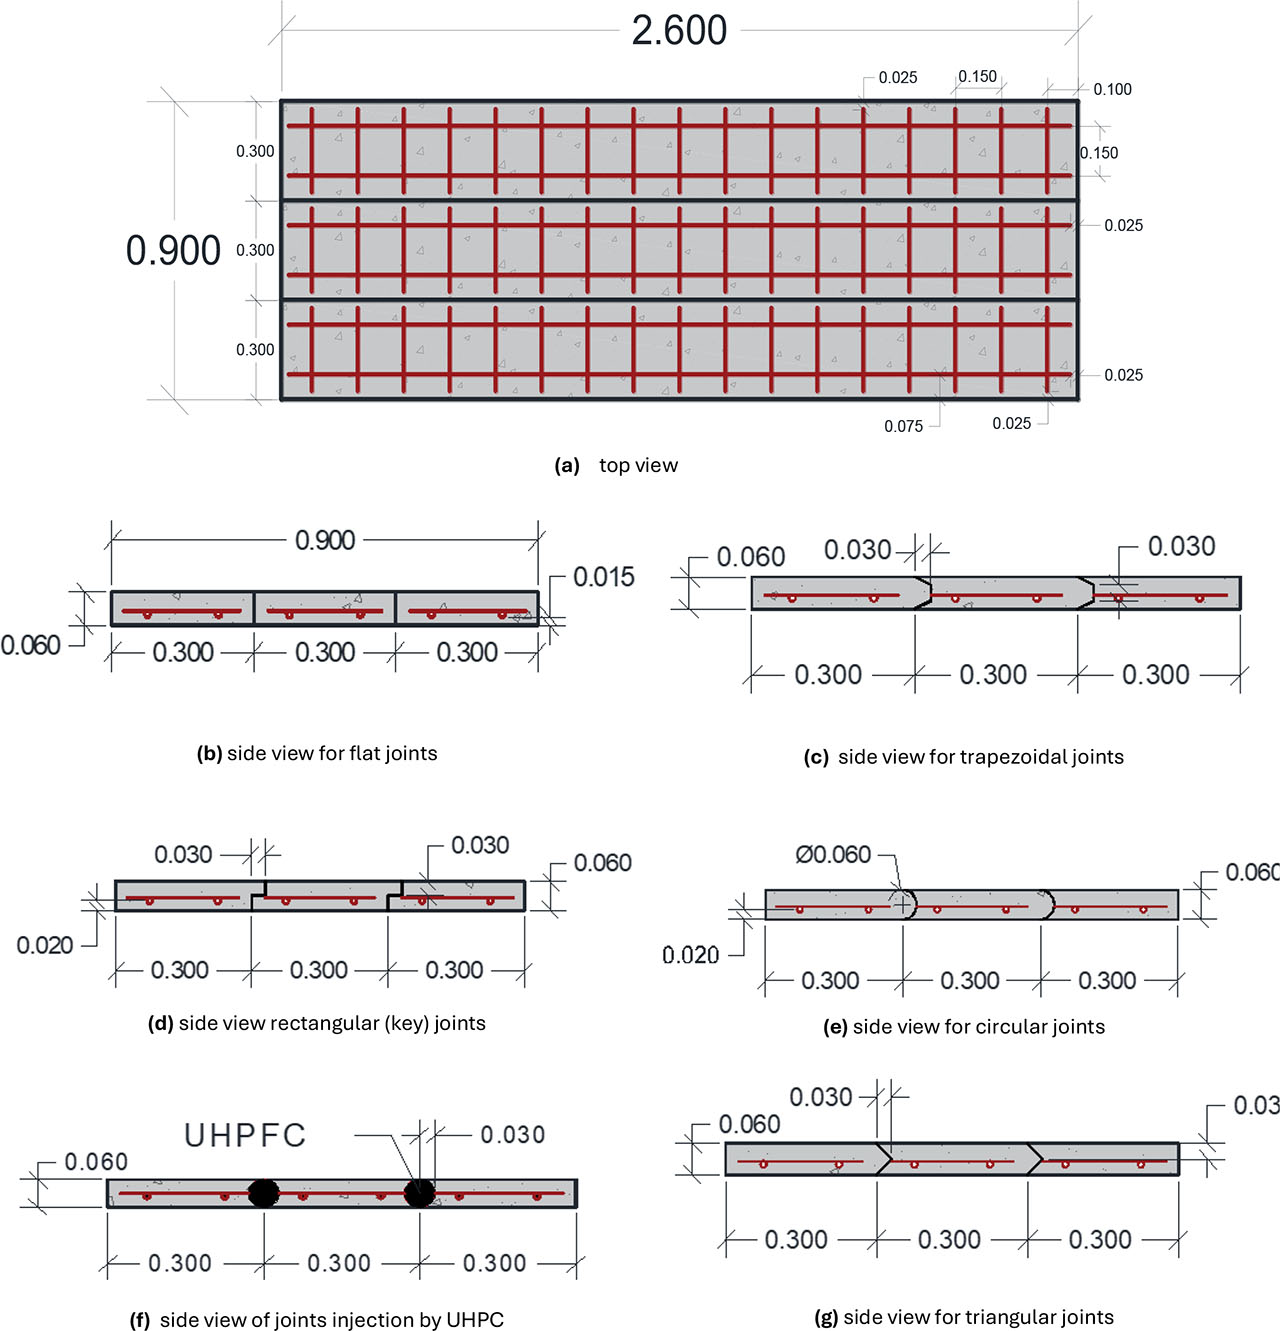
Figure 1:
Specimens details (unite in m)
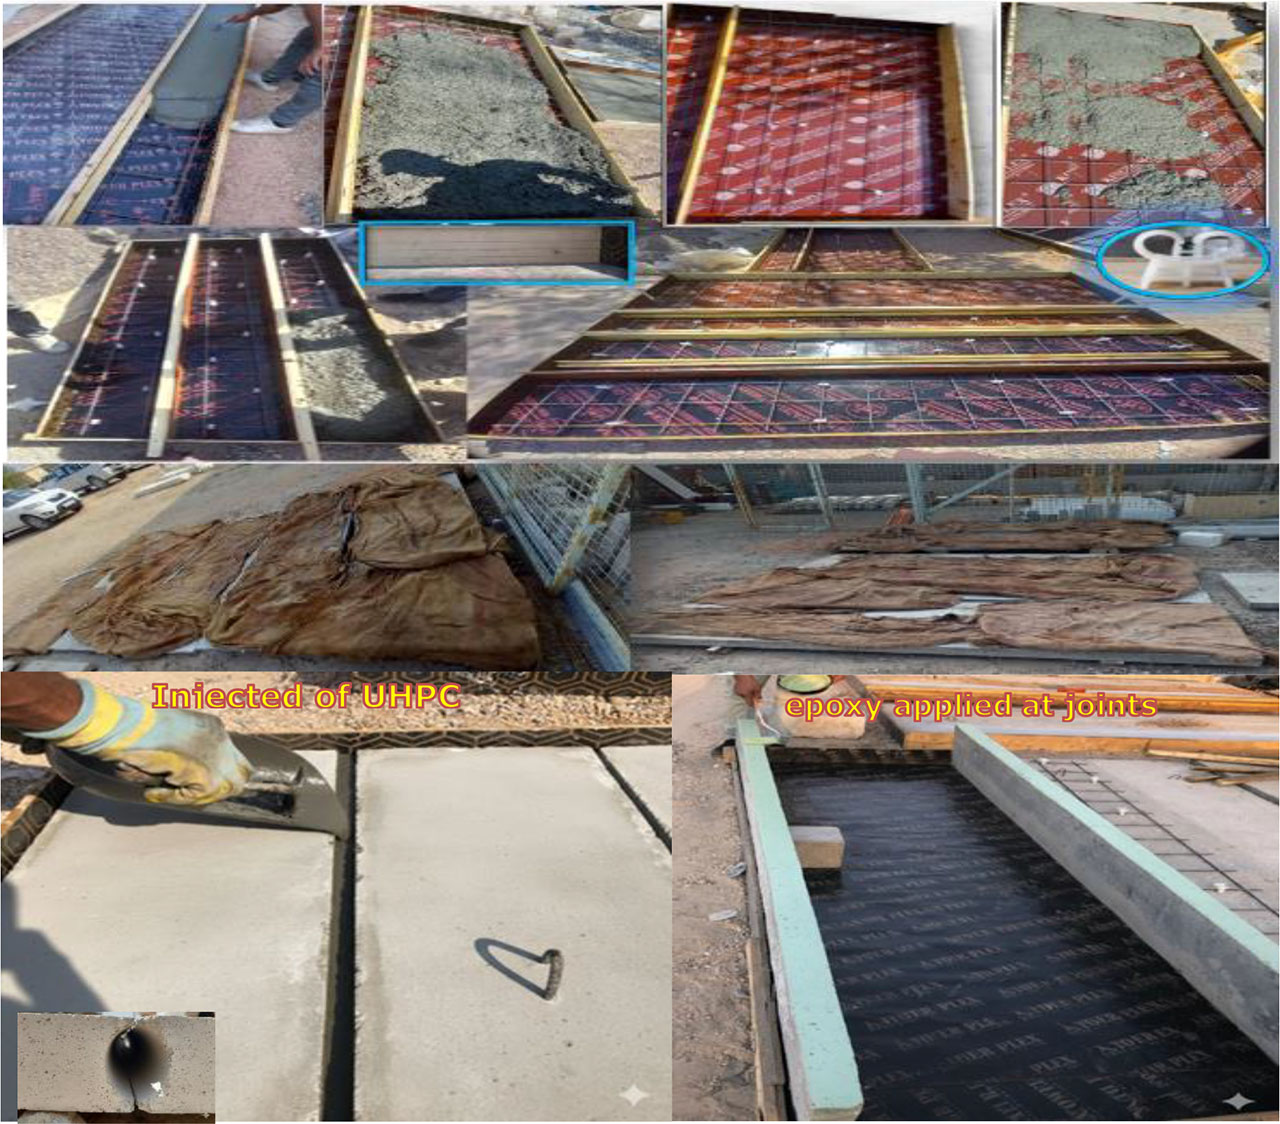
Figure 2:
Illustrate the reinforcement layout and specimen preparation
2.2. Materials
All the materials used in preparing the concrete specimens were sourced locally. Ordinary Portland Cement (produced by the Mass factory) was used in accordance with the Iraqi Standard Specification No. 5 (2019). Al-Ekhaider sand served as the fine aggregate (FA) in the substrate concrete mixes, with a maximum particle size of 5 mm. For UHPC production, natural local sand was employed after being sieved to pass through a 0.6 mm mesh. Crushed and washed gravel from the Al-Nabai’i region, with a maximum size of 10 mm, was also incorporated and met the requirements of Iraqi Standard Specification (IQ. S 45, 2016).
Additionally, short polypropylene fibers (12 mm in length) supplied by SIKA were used. These fibers, packaged in pre-dosed fibrillated pulp bags, had a density of 910 kg/m3and a specific gravity of 0.91, and were white in colour, as shown in Figure 3. Tap water from the domestic supply, free from impurities and organic matter, was used in all mixes. The concrete mix was further modified with fly ash, added as a filler to improve flowability, enhance durability, reduce cement content, and lower the heat of hydration. To improve workability and resistance to segregation, a superplasticizer Sika’s ViscoCrete 180G (2022) was also included.
Silica fume is a highly reactive pozzolanic material that refines concrete’s microstructure, increasing strength, durability, and resistance to permeability and chemical attack used for ultra-high-performance concrete (UHPC). The Micro Steel fibers MSF is used with length of 13 mm and diameter of 0.2 mm; it is clean of rust or oil. This type of MSF is straight brass-coated micro steel fibers. Quickmast 108 is a two-component, solvent-free epoxy bonding agent for concrete. When the base and hardener are fully mixed, it forms a medium-viscosity adhesive that ensures strong bonding between old and new concrete, ideal for joints and repair works. The mixture must be prepared by adding the entire hardener to the base, mixing for 3 minutes with a slow-speed drill, and applied immediately with a brush in a 0.3 mm layer (Quickmast, 108). Table 2 and 3 shown mix proportions of each concrete’s mixing.
Deformed mild steel with an average diameter of 6 mm was used for reinforcement of specimens in this work that were purchased from local market Hilla satisfies ASTM A615 requirements (A 615/A 615M - 15a, 2015).
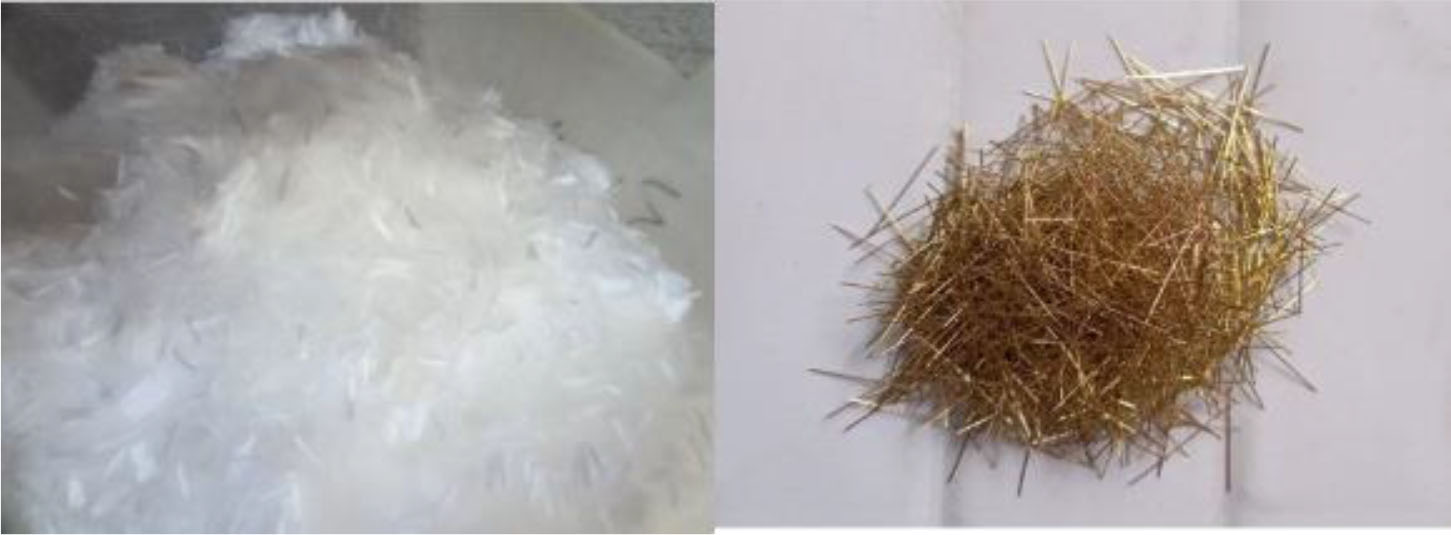
Figure 3:
Polypropylene and Micro steel fibres
Table 2:
Mix proportions of self-compact Polypropylene Fiber-Reinforced Concrete (SCPPFRC)
| Cement [kg/m3] | Fly Ash [kg/m3] | Sand [kg/m3] | Gravel [kg/m3] | Water [kg/m3] | Admixture S.P. [kg/m3] | Polypropylene Fiber P.P.F. [kg/m3] |
|---|---|---|---|---|---|---|
| 350 | 60a | 800 | 725 | 165b | 7c | 4.55d |
| compressive strength, MPa at 28 days | 38.71 | |||||
Table 3:
Mix proportions of ultra-high-performance concrete (UHPC)
| Parameter | Cement [kg/m3] | Fine Sand [kg/m3] | Gravel [kg/m3] | silica fume [kg/m3] | Water [kg/m3] | Admixture S.P. [kg/m3] | micro steel fibers [kg/m3] |
|---|---|---|---|---|---|---|---|
| ultra-high-performance fiber concrete UHPFC | 950 | 1050 | ----- | 195a | 206b | 39.9c | 157d |
| Mix strength grade, MPa at 28 days | 135.86 | ||||||
2.3. Mixing
Self-compacting concrete (SCC) was mixed in a 0.1 m3 horizontal rotary mixer. The process began with blending fine and coarse aggregates, cement, and fly ash for about two minutes. Polypropylene fibers were then added and mixed, followed by half of the mixing water. Finally, the superplasticizer and the remaining water were introduced, and mixing continued for another two minutes to ensure uniformity. For ultra-high-performance concrete (UHPC), dry materials (cement, sand, and silica fume) were first blended for 1–2 minutes. Water and superplasticizer were then added gradually, with mixing maintained for 12–15 minutes until a flowable mix was achieved. Steel fibers were incorporated in the final stage and mixed for 3–5 minutes to ensure even distribution.
2.4. Fresh Tests
To verify from being the concrete of the mixes is SCC, the four standard tests (Slump flow test, T50 cm slump flow test, V-funnel test, and L-box fresh test) of SCC were carried out on each batch and the results were compared with the standard limitations mentioned in EFNARC (EFNARC, 2005). Table 4 shows the results of these tests. It can be noted that the results of these tests satisfy the requirements of EFNARC. Figure 4 shows the photographs of these tests.
Table 4:
Fresh properties result of SCC mix
| Mix | Properties related to self-compact ability | |||
|---|---|---|---|---|
| Slump flow [mm] | T50cm flow time [Sec] | V-funnel - Time [sec] | L-box (H2/H1) | |
| SCCa | 680 | 4 | 8 | 0.98 |
| SCPFRCb | 615 | 6 | 21 | 0.76 |
| Typical range of values (EFNARC) | 650–800 | 2–5 | 6–12 | 0.8–1.0 |
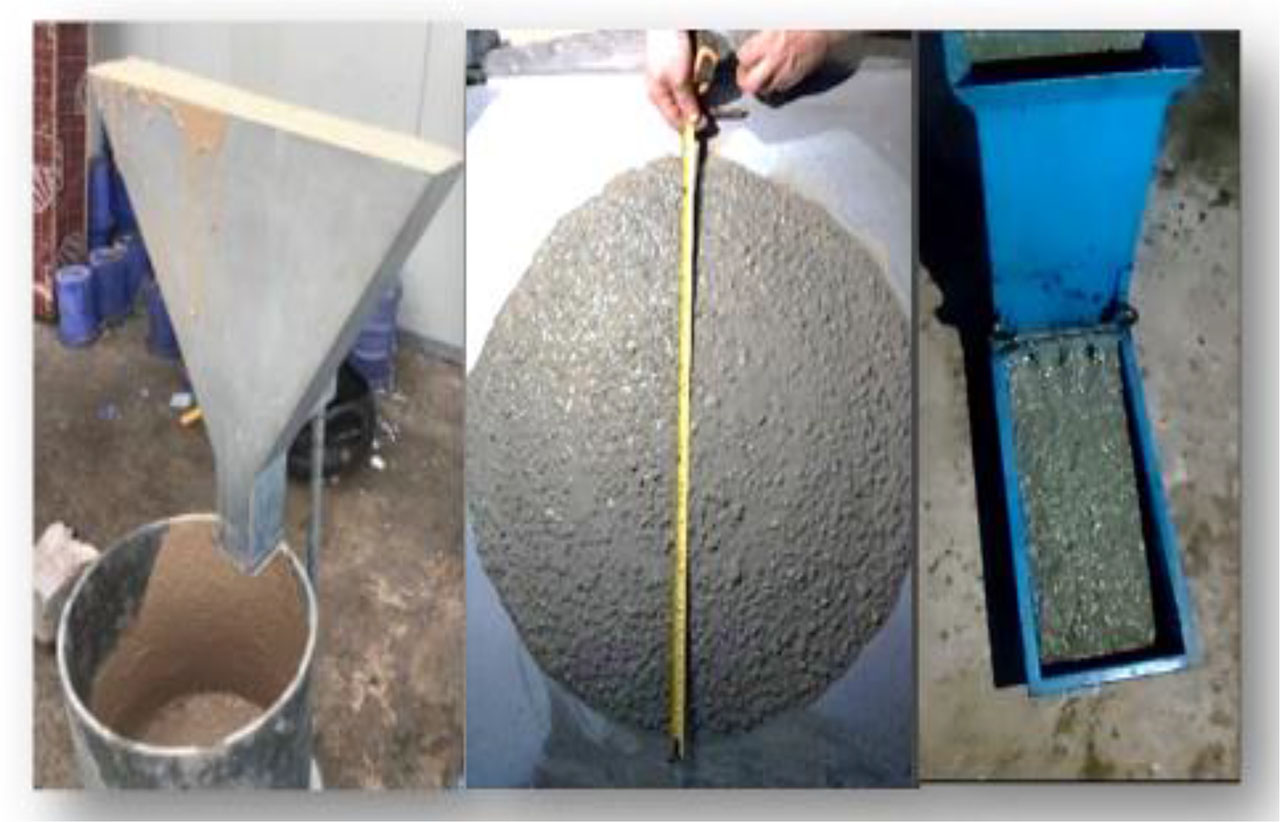
Figure 4:
V-funnel, slump flow and L-box tests of fresh concrete
According to ASTM C1856 (ASTM C1856, 2017), the recommended flow for UHPC is between 200 and 250 mm. Based on the trial mixes described earlier, in this study a flow range of 230 to 240 mm for UHPC. Figure 5 shows the procedure used for the flow test.
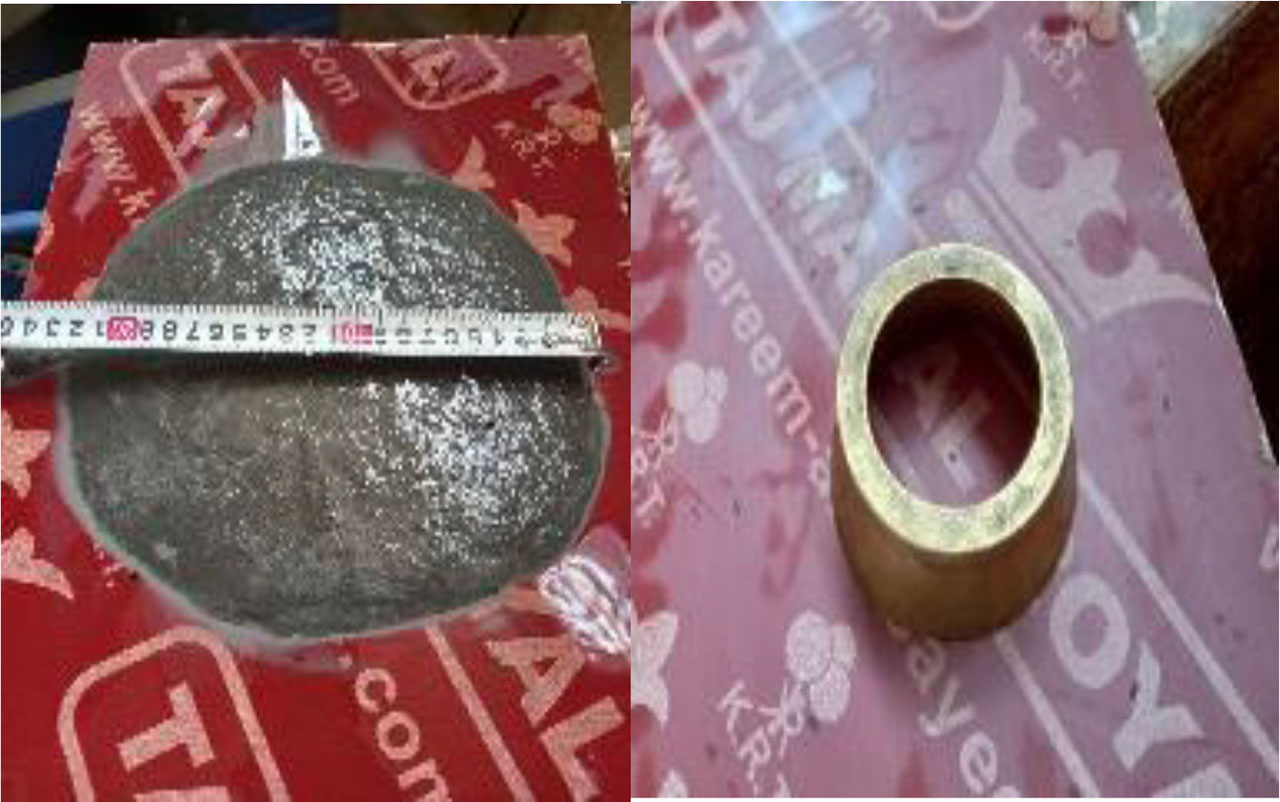
Figure 5:
Flow test procedure for UHPC
2.5. Material Properties
During the casting of the specimens, concrete performance test specimens were reserved, including three concrete cube specimens with dimensions of 100 mm × 100 mm × 100 mm as required to conform to British Standard Specifications for uniaxial compression (BS EN 12390-3, 2009). Splitting tensile strength has been determined by testing three standard cylinders of (200×100 mm) according to (ASTM Standard C496, 2011) and three concrete prism specimens with dimensions of 100 mm × 100 mm × 400 mm subjected to a flexural strength test (ASTM C78/C78M-22, 2010). These specimens were cured under the same conditions as the corresponding structural members. Prior to loading the structural members, the elastic modulus, cube compressive strength, and prismatic body strength of the concrete were measured, and the average values were taken. The modulus of elasticity was determined according to (ASTM C469, 2014) the test was conducted using two cylindrical specimens measuring 150 × 300 mm. Table 5 lists the mechanical properties of SCC for each part of the beams. Figure 6 shows the testing process of the concrete material parameters. The mechanical performance of these steel reinforcements was tested in accordance with the standard tensile test method as shown at Table 6, (A 615/A 615M - 15a, 2015).
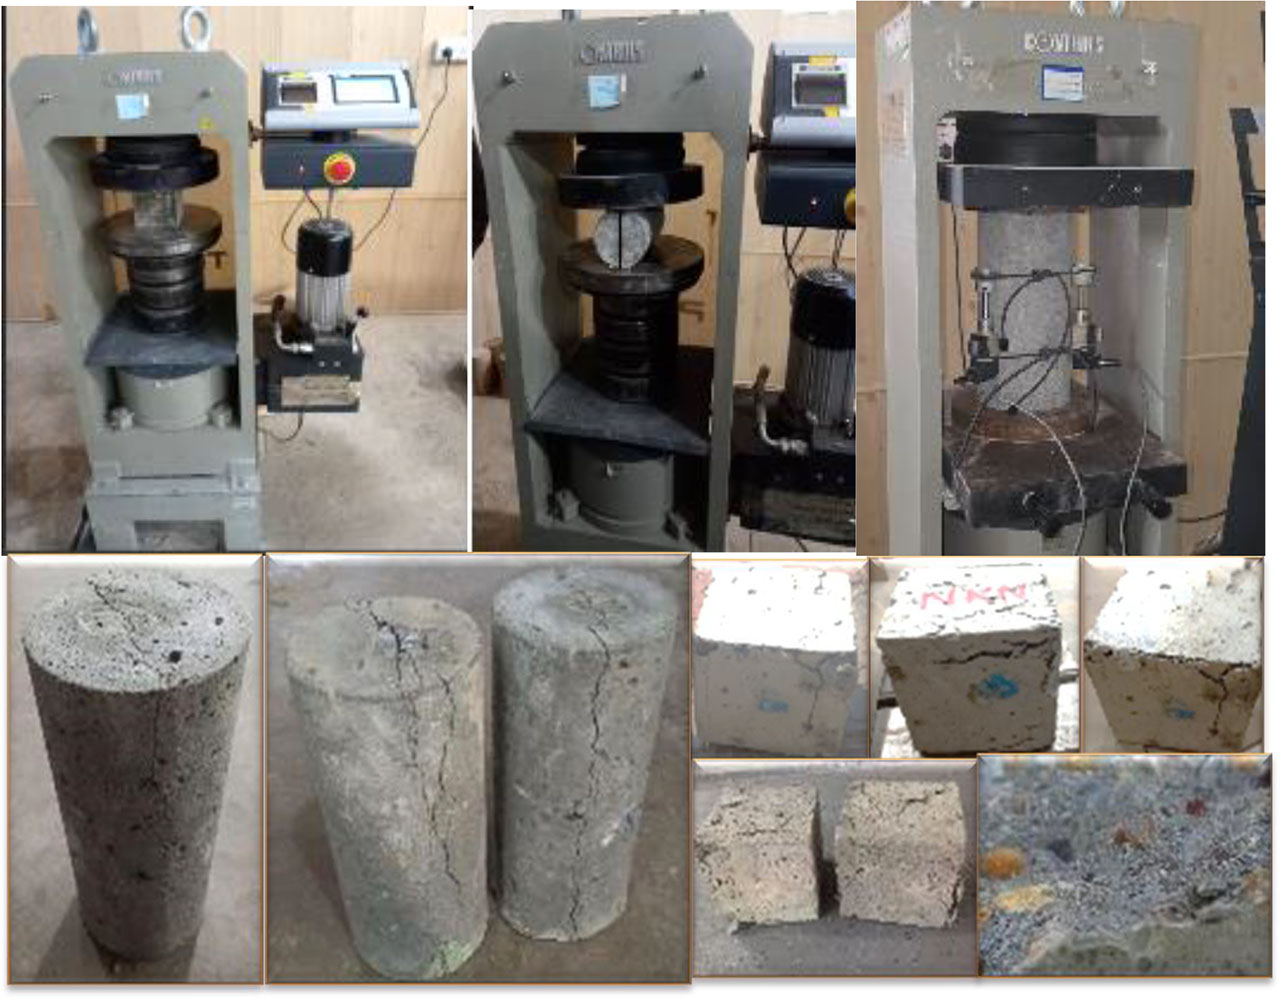
Figure 6:
Shows the testing process of the concrete material parameters
2.6. Test Setup and Measurement System
The experimental setup was designed to evaluate the flexural behavior of diaphragm wall specimens under varying conditions. All specimens were prepared with standardized dimensions and reinforcement details, enabling direct comparison of many thicknesses and the presence of cold joints. A four-point bending arrangement was adopted, using a centrally positioned hydraulic jack to apply the load, which was evenly distributed across the specimen through steel loading plates, see Figure 7. This configuration allows the applied loads to act in a manner that preserves the elastic response of the model, without imposing constraints on the lateral bending behavior due to Poisson’s ratio effect. Therefore, modeling the joints longitudinally provides a more realistic simulation of the structural response under the applied loading conditions.
Deflections and strains were continuously monitored at mid span with Linear Variable Differential Transformers (LVDTs) and five strain gages as shown in Figure 7a and b. providing accurate measurements as the load was applied incrementally. Before commencing the formal loading, a trial load was applied to eliminate gaps between components and verify system integrity. The loading procedure followed established protocols, beginning in force control mode and transitioning to displacement control as the specimens approached their ultimate capacity.
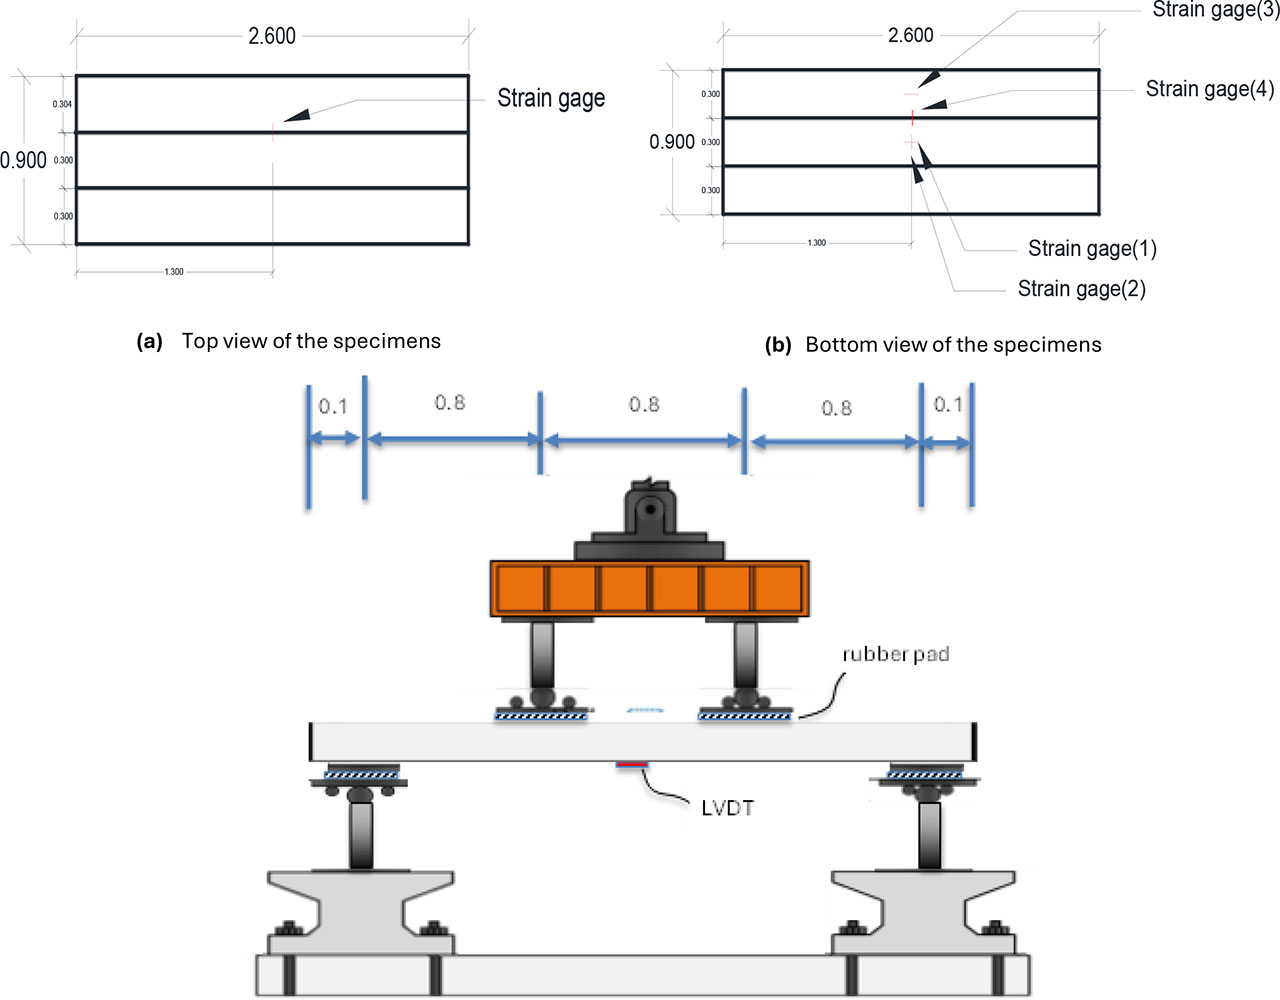
Figure 7:
Schematic diagram of the specimen monitoring system (unit:m)
To test a simply supported one-way slab (2400 mm × 900 mm), the specimen was placed on a hydraulic testing machine with a 2400 mm clear span and 100 mm overhangs. Two-line loads were applied 800 mm apart at mid-span using a hydraulic system, simulating soil pressure on retaining walls. Steel plates (20 mm thick, 100 mm wide) and rubber pads (10×100 mm) were used at load and support points to distribute forces evenly and reduce stress concentrations. Unlike rigid loads, soil pressure remains perpendicular to the wall's surface during deformation, requiring accurate simulation of its direction-dependent behavior. Rigid loading elements limit realistic deflection patterns and stress distribution. Therefore, rotatable loading segments were used to better mimic soil pressure, capturing complex bending and moment effects.
A specially designed support system with three semicircular steel bearings (σy ≥ 400 MPa) was implemented, one fixed central bearing and two side bearings allowing transverse rotation. This setup replicates the nonlinear flexural behavior of retaining walls under lateral earth pressure by converting vertical loads into realistic bidirectional bending moments. All specimens were tested to failure using a calibrated electro-hydraulic testing machine (capacity 2500 kN) at the Structural Laboratory, University of Babylon. The loading system included a rigid steel base anchored to a concrete foundation, with a central hydraulic jack and piston. A rigid steel portal frame comprising two vertical columns and a top lateral beam supported the setup. An adjustable-height box girder acted as a stopper for upward movement. Loading was applied in load control mode at a constant rate of 0.5 kN/sec. Each specimen underwent a two-line loading test, with loads applied at one-third span points. Test setup and instrumentation details are shown in Figures 8. During the experiment, it was necessary to record the specimens’ characteristic loads, specifically cracking, yielding, and ultimate load.
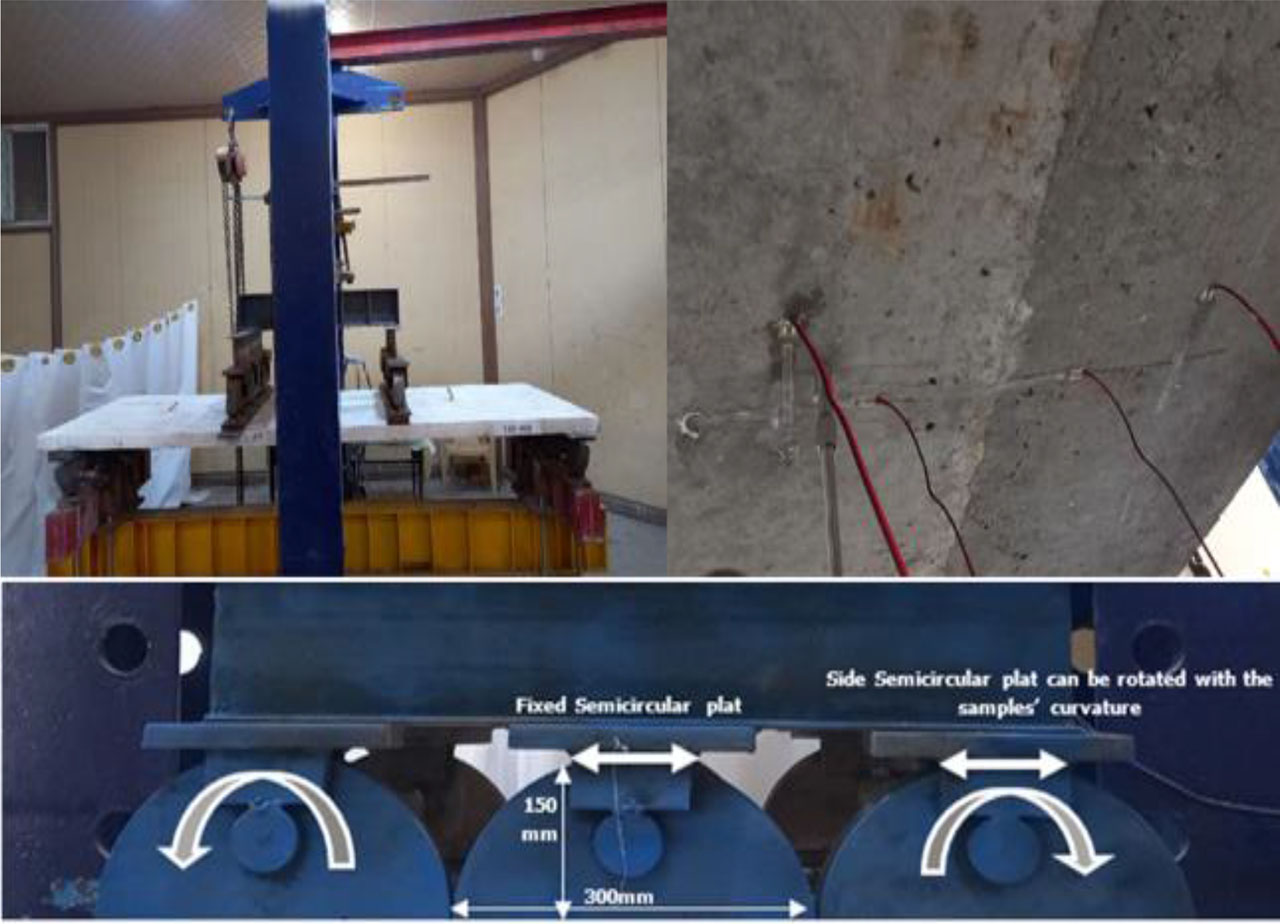
Figure 8:
Experimental Loading Setup System
2.7. The Results
The experimental results reveal significant variations in the performance of diaphragm wall specimens based on joints configurations and treatments, as evidenced by load-deflection at mid span responses, ductility and failure patterns under bending loads.
However, a diaphragm wall is composed of discrete wall panels. The diaphragm wall is discontinuous in the horizontal direction and consequently cannot sustain any significant out-of-plane bending moment about a vertical axis (Dong et al., 2018). Moreover, the horizontal axial stiffness of the retaining wall is smaller than the vertical stiffness (Zdravkovic et al., 2011) and its function is like that of a hinge, which can only transmit axial and shear forces where deformation primarily occurs at joint locations rather than being distributed uniformly along the wall length (Ying-Jie et al., 2008).
2.7.1. Effect Joint’s Shapes on performance of specimens
The mechanical performance of diaphragm wall specimens varied significantly based on joint geometry, as evidenced by load-deflection responses and failure patterns, as shown in Figure 9,10, 11, 12 and 13. Table 7 summarizes the characteristic loads, midspan deflections, and ductility coefficients for specimens with different joint shapes, providing quantitative comparisons against the flat reference joint (T60-F0). The ductility has been calculated using displacement method for the reinforced concrete specimens, the ductility is expressed in terms of ductility index, see Figure 15. The ductility index, μΔ was used to quantify the ductility performance of the specimens, it is the ratio of the mid-span deflection at ultimate or failure (Δu) to that deflection at the yielding point (Δy) that calculated from farthest-point method (Feng et al., 2017).
Table 7:
Characteristic loads, midspan deflections and ductility coefficients of specimens with different joint shape
| specimen | Interaction area of joints | Pcr | Pyield | δyield | Pultimate | δultimate | Ductility |
|---|---|---|---|---|---|---|---|
| [mm2/m] | [kN] | [kN] | [mm] | [kN] | [mm] | ||
| T60-F0 | 6.00 | 2.74 | 2.72 | 5.04 | 5.14 | 52.92 | 10.50 |
| T60-R0 | 9.00 | 2.57(↓7%) * | 2.54 (↓7%) * | 4.4 (↓13%) * | 5.17(↑0.6%) * | 47.80(↓10%) * | 10.86 |
| T60-P0 | 9.70 | 2.65(↓3%) * | 2.60 (↓4%) * | 5.25 (↑4%) * | 5.59 (↑9%) * | 47.75 (↓10%) * | 9.10 |
| T60-T0 | 8.49 | 3.84(↑40%) * | 3.64 (↑34%) * | 4.25 (↓16%) * | 5.71 (↑11%) * | 41.14 (↓22%) * | 9.68 |
| T60-C0 | 9.42 | 2.91(↑6.2%) * | 2.71 (↓0.4%) * | 4.80 (↓5%) * | 6.01 (↑17%) * | 43.20 (↓18%) * | 9.00 |
Triangular Joint (T60-T0) demonstrated the most substantial improvement in load-bearing capacity, with a 40% increase in cracking load and 34% higher yield load compared to flat joint, see Figure 14. The V-shaped profile enhanced mechanical interlock by redirecting shear stresses along the inclined planes, delaying interface failure (Wang et al., 2018). However, this came at the expense of reduced deformation capacity, with ultimate deflection decreasing by 22%. The ductility index (9.68) remained high but was lower than the reference specimen, indicating a trade-off between strength and deformability, see Figure 15.
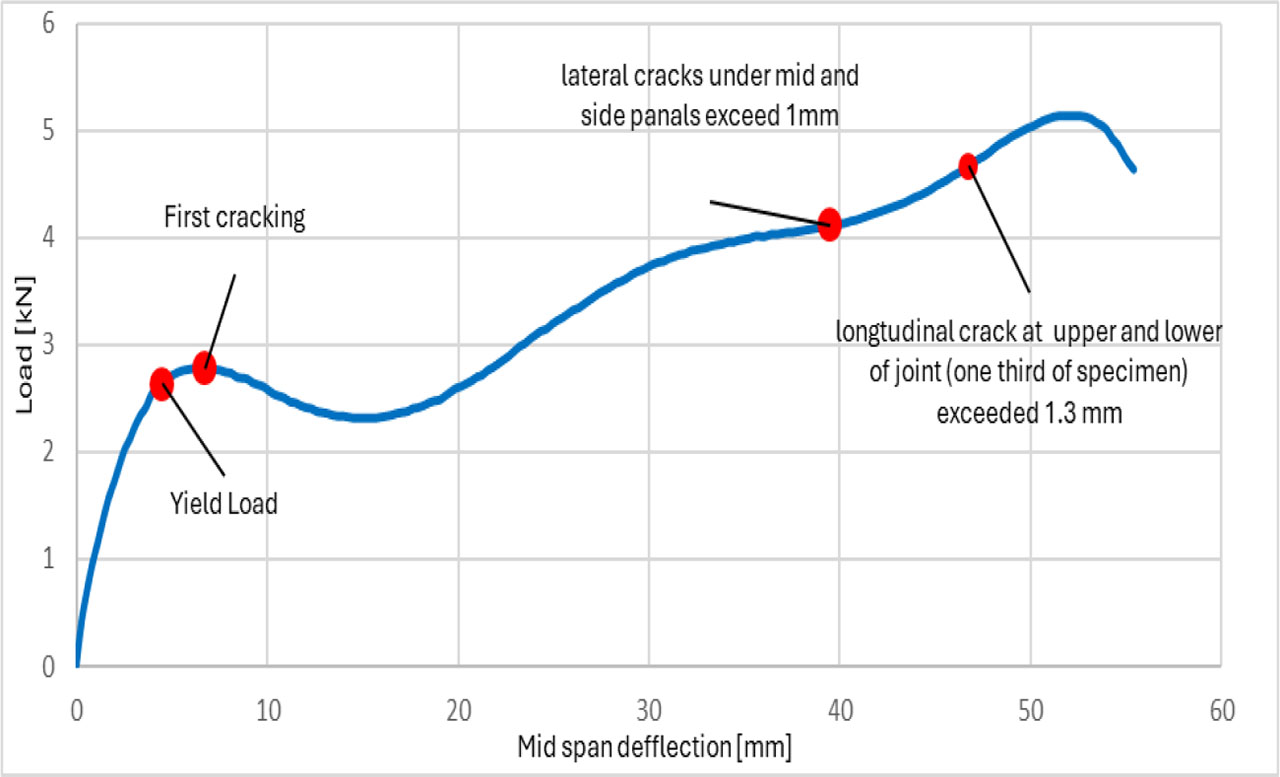
Figure 9:
Load-deflection curves of the tested specimens with flat joints (T60-F0)
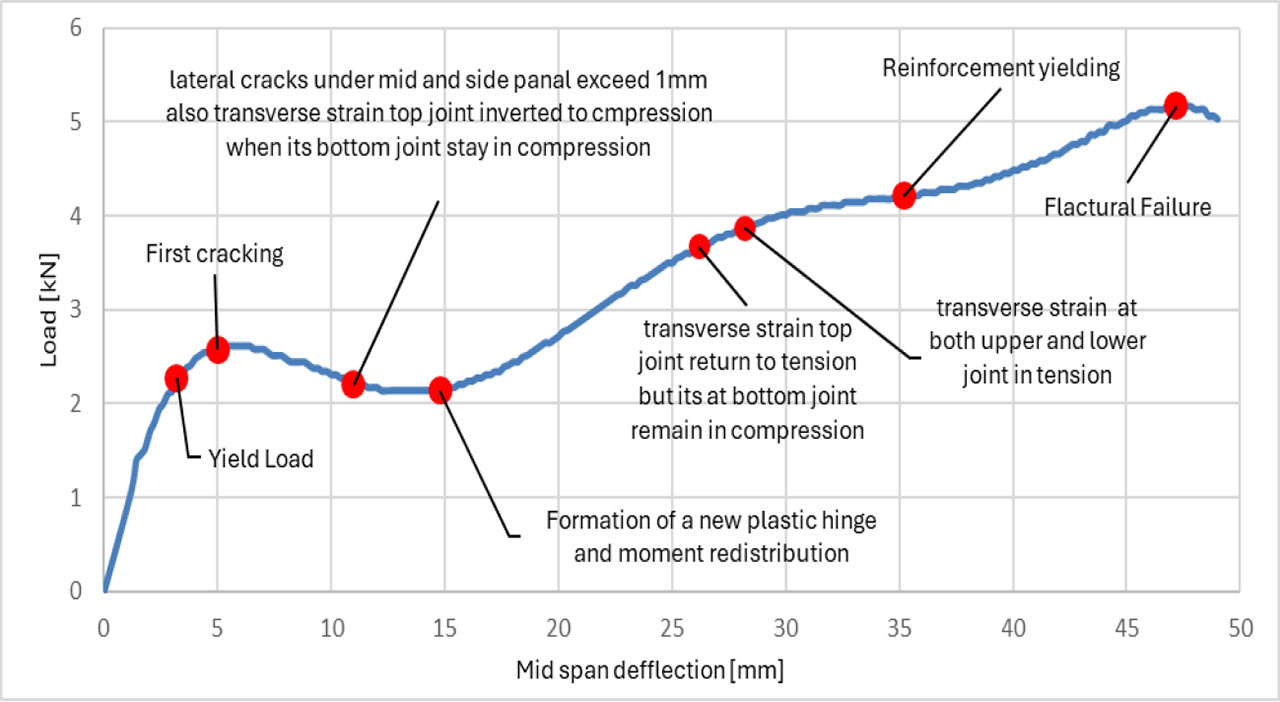
Figure 10:
Load-deflection curves of the tested specimens with key joints (T60-R0)
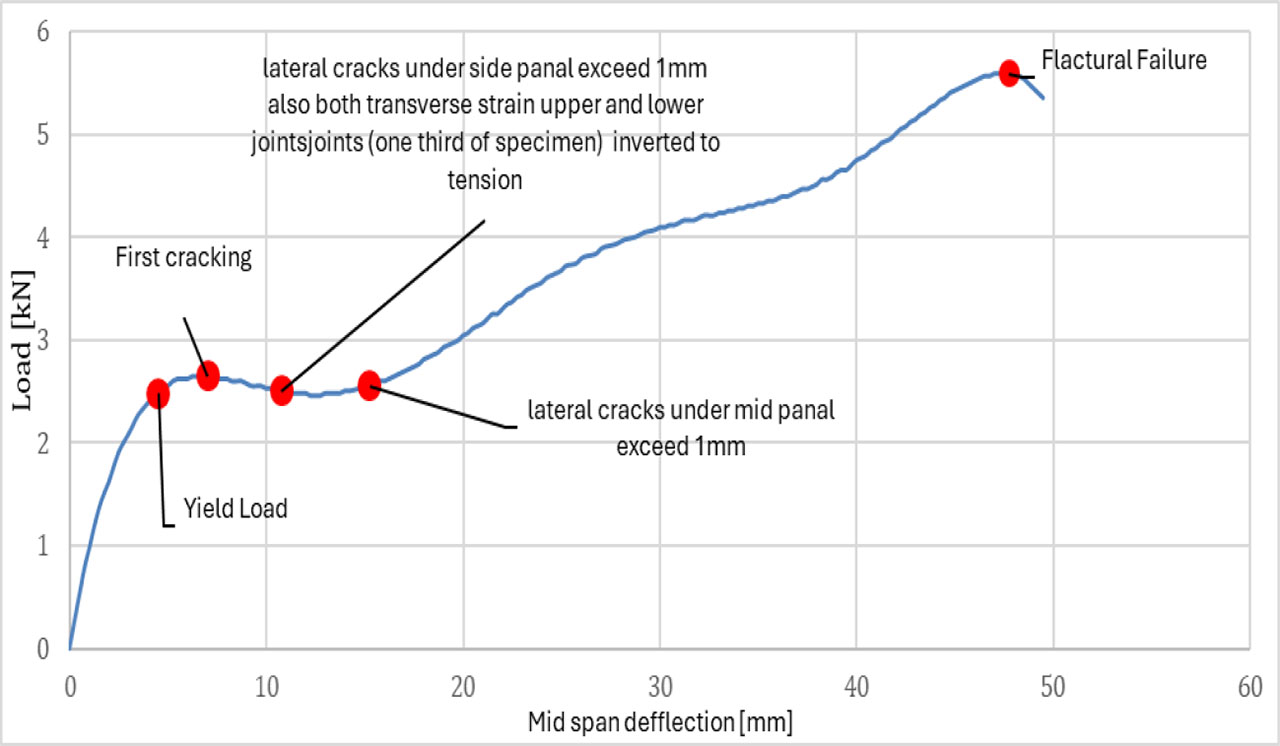
Figure 11:
Load-deflection curves of the tested specimens with trapezoidal joints (T60-P0)
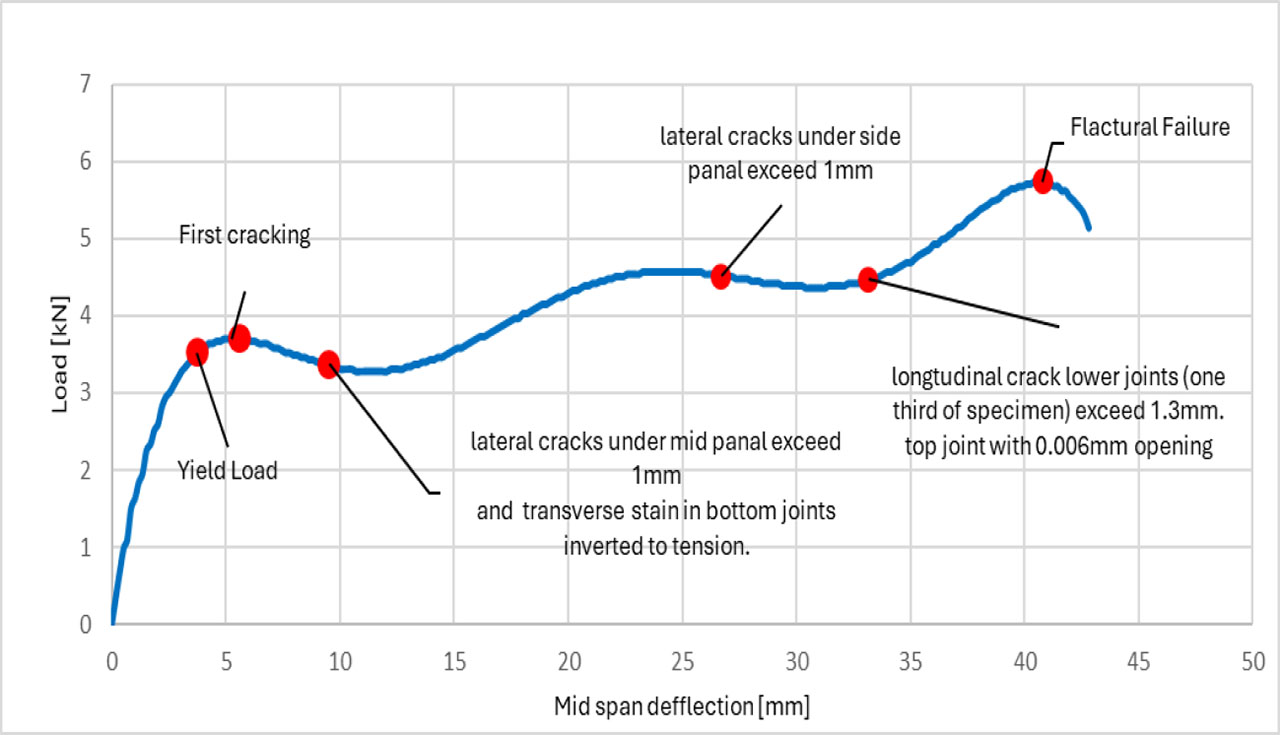
Figure 12:
Load-deflection curves of the tested specimens with triangle joints (T60-T0)
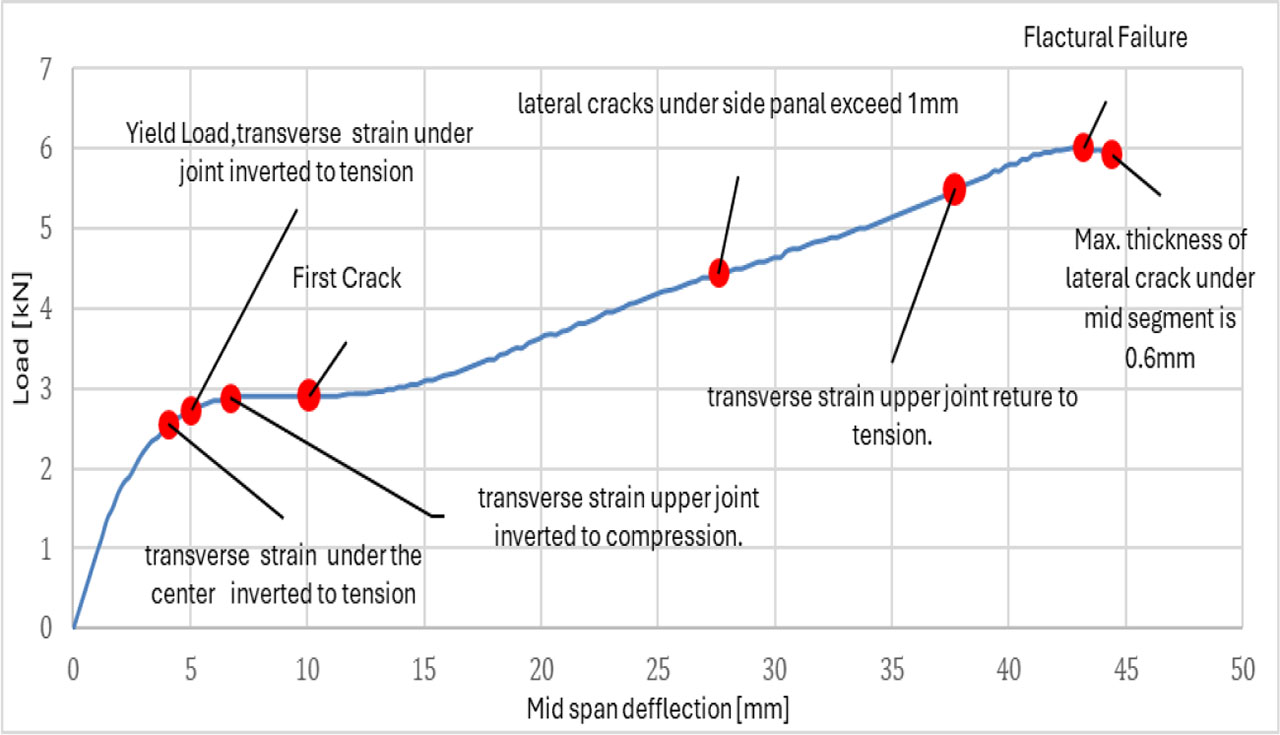
Figure 13:
Load-deflection curves of the tested specimens with triangle joints (T60-C0)
Semi-circular Joint (T60-C0) The curved interface showed a balanced performance, achieving a 17% increase in ultimate load with moderate reductions in deflection (18%). The semi-circular geometry distributed stresses more uniformly than angular profiles, as evidenced by the formation of multiple fine cracks instead of a single dominant crack.
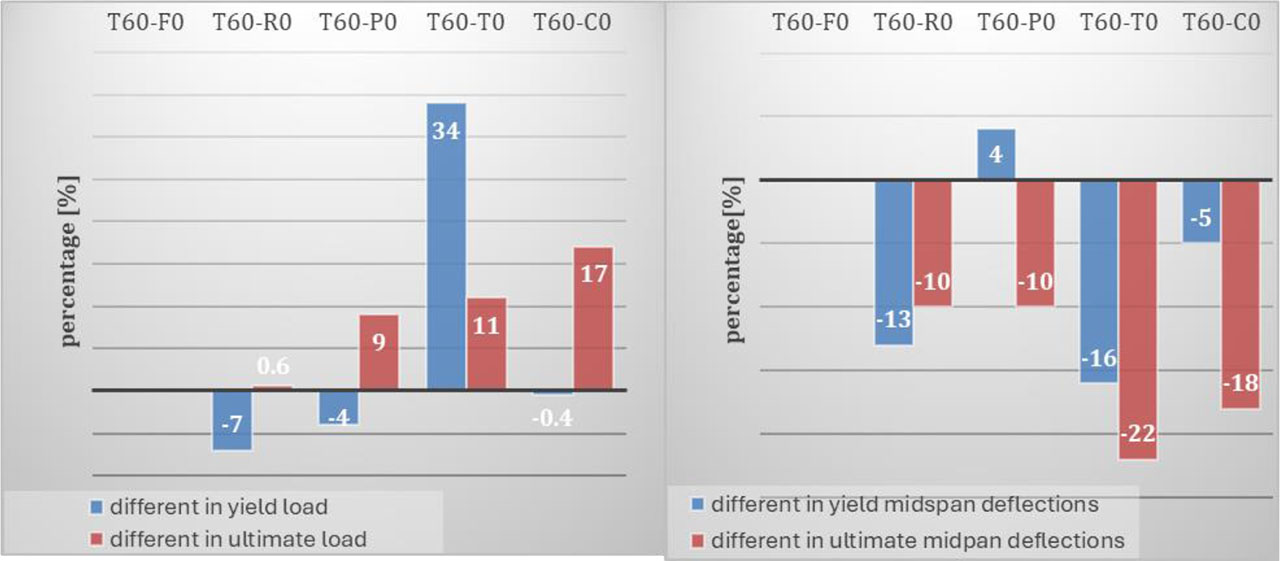
Figure 14:
Variation of load and midspan deflection of the tested specimens with different joints’ shapes
Trapezoidal Joint (T60-P0) While this profile increased ultimate load by 9%, it underperformed relative to other geometric shapes. The angled surfaces provided less effective shear transfer than the triangular joint, resulting in only marginal improvements over the flat reference. The deflection characteristics mirrored those of the semi-circular joint, with a 10% reduction.
Rectangular Joint (T60-R0) Contrary to expectations, the stepped profile exhibited inferior performance, reducing both yield load (↓7%) and ultimate deflection (↓10%). The rectangular geometry created stress concentration at the step corners, promoting premature cracking. Despite this, the specimen displayed the highest ductility, suggesting that the failure process was more gradual than in other configurations.
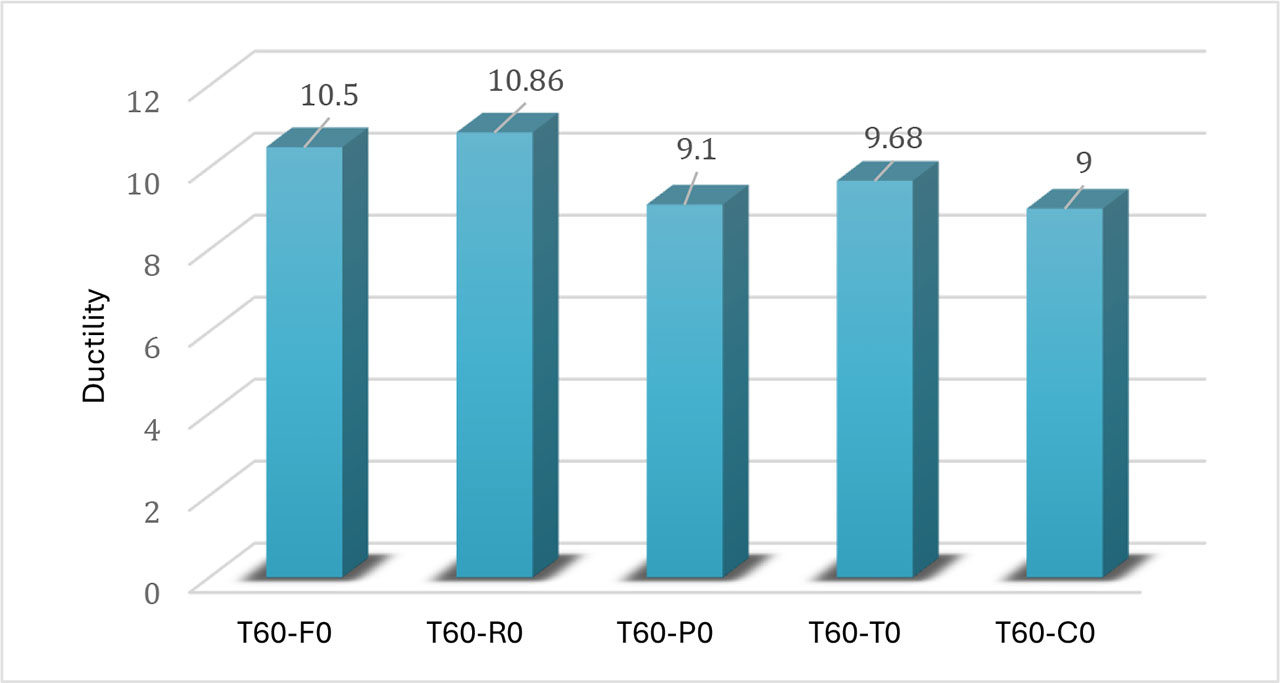
Figure 15:
Ductility of the tested specimens with different joint shapes
The failure modes varied distinctly among joint types. Flat and triangular joints failed through sudden interface separation of joints, while trapezoidal and semi-circular joints exhibited more progressive crack propagation along the inclined or curved surfaces. These observations align with fracture mechanics principles, where geometric profiles alter crack paths and energy dissipation mechanisms (Zhang & Li, 2004).
2.7.2. Effect chemical treatments of joints on performance of specimens
The chemical treatment of cold joints significantly influenced the mechanical behaviour of polypropylene fibre reinforced concrete diaphragm walls, as demonstrated by variations in load capacity, deflection characteristics, and ductility, as shown in Figure 16, 17 and 18. Table 8 presents the key performance metrics for specimens with chemically treated joints, including epoxy-bonded flat joints (T60-FE) and UHPC-injected joints (T60-HU), compared to the untreated flat reference (T60-F0) and fully separated joint (T60-FS).
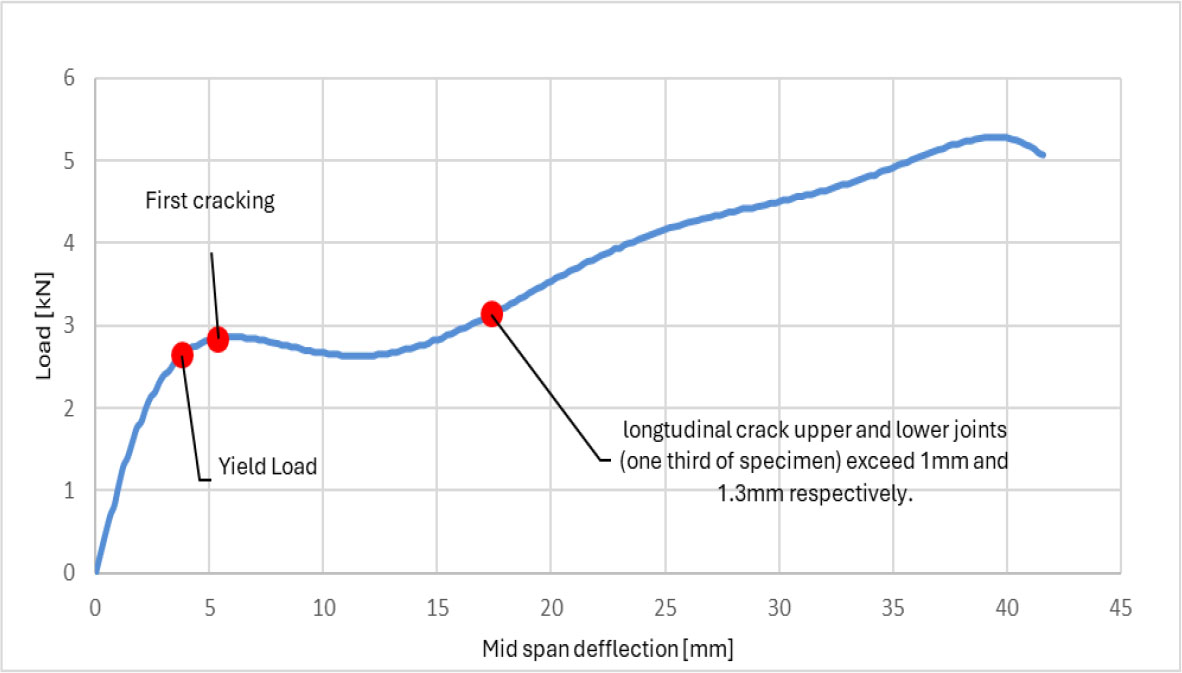
Figure 16:
Load-deflection curves of the tested specimen without any contact for flat joint (T60-F0)
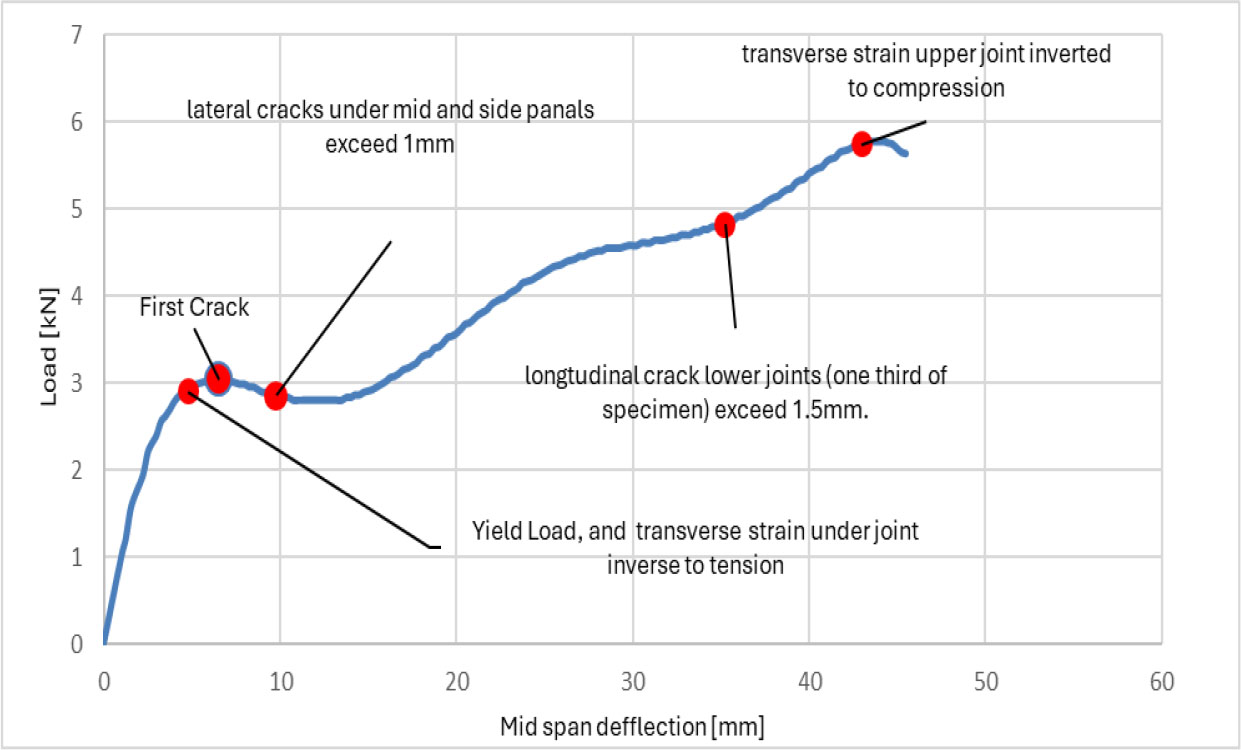
Figure 17:
Load-deflection curves of the tested specimen with epoxy-bonded flat joints (T60-FE)
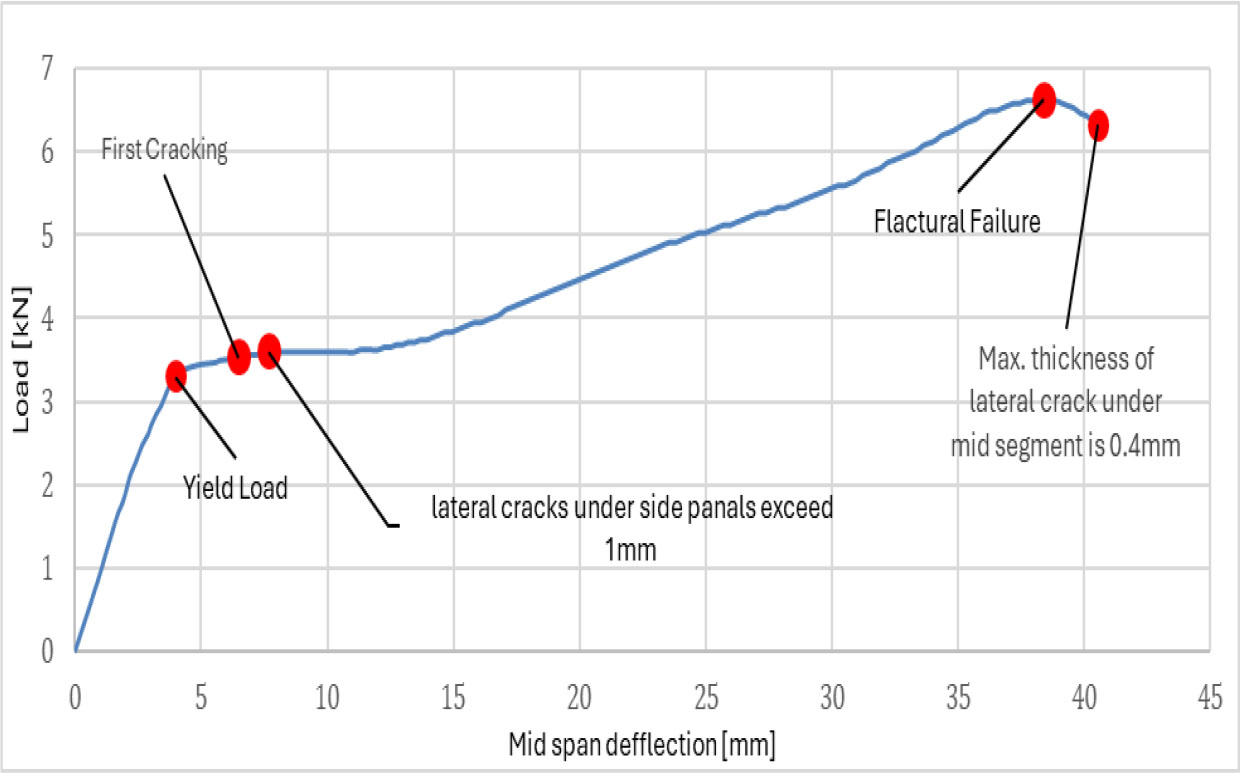
Figure 18:
Load-deflection curves of the tested specimens with UHPC-injected in hole joints (T60-HU)
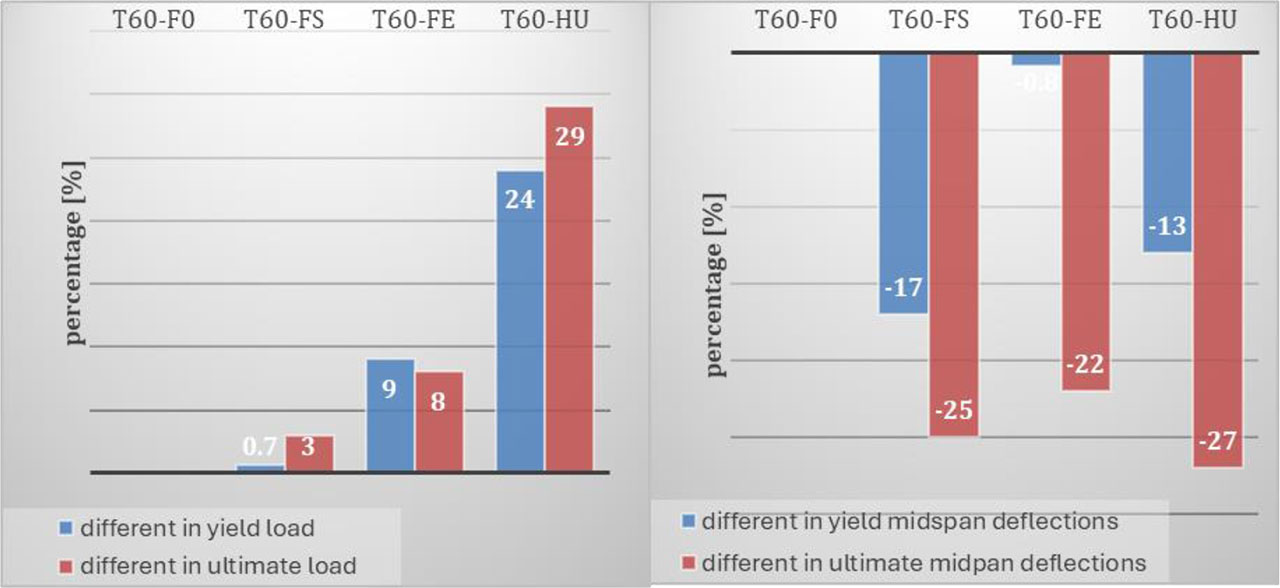
Figure 19:
Variation of load and midspan deflection of the tested specimens with different chemical treatments joints
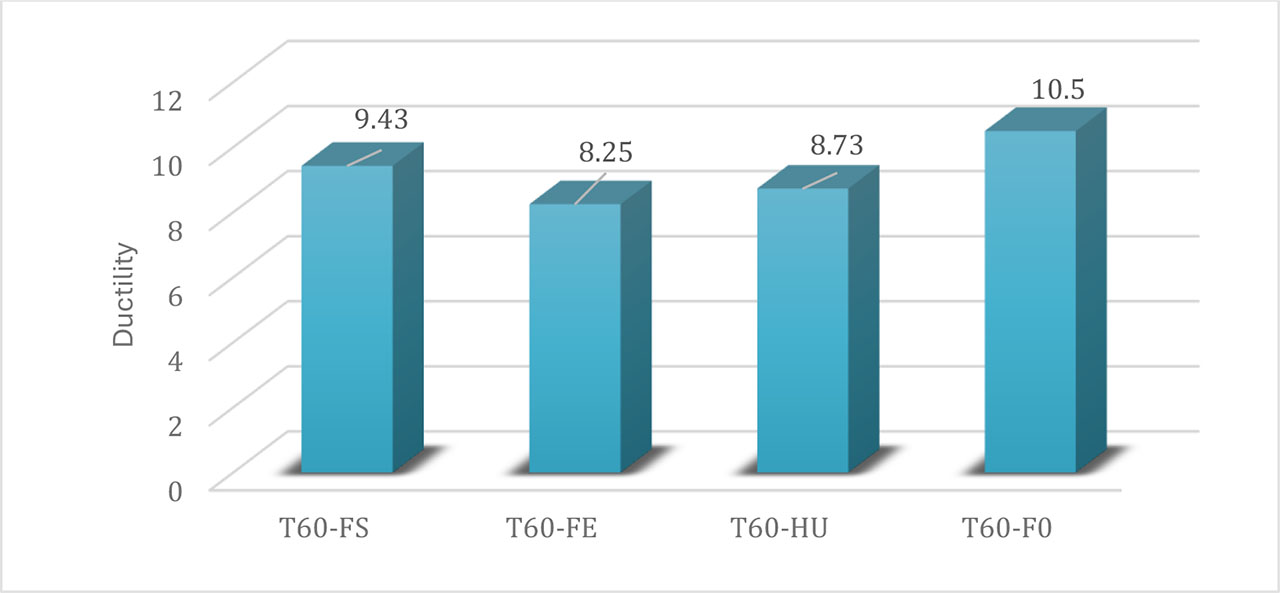
Figure 20:
Ductility of the tested specimens with different chemical treatments joint
Table 8:
Characteristic loads, midspan deflections and ductility of specimens with different chemical treatments joints
| specimen | Pcr | Pyield | δyield | Pultimate | δultimate | Ductility |
|---|---|---|---|---|---|---|
| [kN] | [kN] | [mm] | [kN] | [mm] | ||
| T60-F0 | 2.74 | 2.72 | 5.04 | 5.14 | 52.92 | 10.50 |
| T60-FS | 2.86(↑4.4%) * | 2.74 (↑0.7%) * | 4.20 (↓17%) * | 5.28(↑3%) * | 39.60 (↓25%) * | 9.43 |
| T60-FE | 3.00(↑9.5%) * | 2.96 (↑9%) * | 5.00 (↓0.8%) * | 5.57 (↑8%) * | 41.25 (↓22%) * | 8.25 |
| T60-HU | 3.53(↑29%) * | 3.45 (↑27%) * | 4.40 (↓13%) * | 6.62 (↑29%) * | 38.40 (↓27%) * | 8.73 |
From Figure 19, Epoxy-Bonded Joint (T60-FE) application of epoxy adhesive to flat joint interfaces enhanced load transfer, increasing cracking load by 9.5% and yield load by 9% relative to the untreated joint. The epoxy penetrated pores, creating covalent bonds that improved interfacial shear resistance (Al-Rubaye et al., 2020). Unlike geometric joints, this treatment preserved deflection characteristics, with only a 0.8% reduction in yield deflection. However, ultimate deflection decreased by 22%, indicating that while epoxy improved strength, it slightly reduced deformation capacity. After failure of the epoxy-bonded concrete key joint, load resistance was governed solely by interfacial friction. The ductility index (8.25) remained within acceptable limits for seismic applications, though lower than the reference specimen, see Figure 20. Concrete key joints bonded with epoxy exhibited higher stiffness compared to dry joints; however, they also demonstrated more pronounced brittle damage.
UHPC-Injected Joint (T60-HU) treatment demonstrated the most substantial performance enhancement, achieving a 29% increase in ultimate load and 27% higher yield load, see Figure 19. The high-strength dowel action of UHPC effectively bridged the joint interface, resisting bending moments more efficiently than adhesive bonding. The UHPC filled pre-drilled holes, creating high-strength dowels that resisted shear and bending moments across the joint (Assaad & Issa, 2012). However, these gains came with significant reductions in deformation capacity, as ultimate deflection decreased by 27%. The high stiffness of UHPC limited crack propagation, resulting in a more brittle failure mode compared to other treatments. The ductility index was the low among all specimens, suggesting that while UHPC maximizes load capacity, it may not be suitable for applications requiring high deformation tolerance (Yousef et al., 2023).
The results illustrate the trade-offs between chemical treatments. Epoxy bonding produced more gradual post-yield softening, whereas UHPC injection led to abrupt strength loss after peak load. The initial stiffness was highest for UHPC specimens. These behavioural differences have important implications for structural design, particularly in environments where cyclic loading or seismic activity may occur. Chemical treatments also influenced crack patterns. Epoxy-bonded joints developed fewer but wider cracks compared to UHPC specimens, which exhibited multiple fine cracks near the injection points. The crack width distribution suggests that epoxy allows for more controlled deformation, while UHPC restricts crack opening at the expense of localized stress concentrations. These observations align with fracture energy principles, where adhesive bonds promote energy dissipation through interface deformation rather than crack propagation (Lau & Büyüköztürk, 2010). The results demonstrate that chemical joint treatments offer viable alternatives to geometric profiling, particularly in applications where complex formwork is impractical. While UHPC provides superior strength enhancement, epoxy bonding may be preferable when balanced performance between strength and deformability is required. The choice between these treatments should consider project-specific requirements, including loading conditions, deformation limits, and construction constraints. Figure 21 shown Failure Mode of specimens.
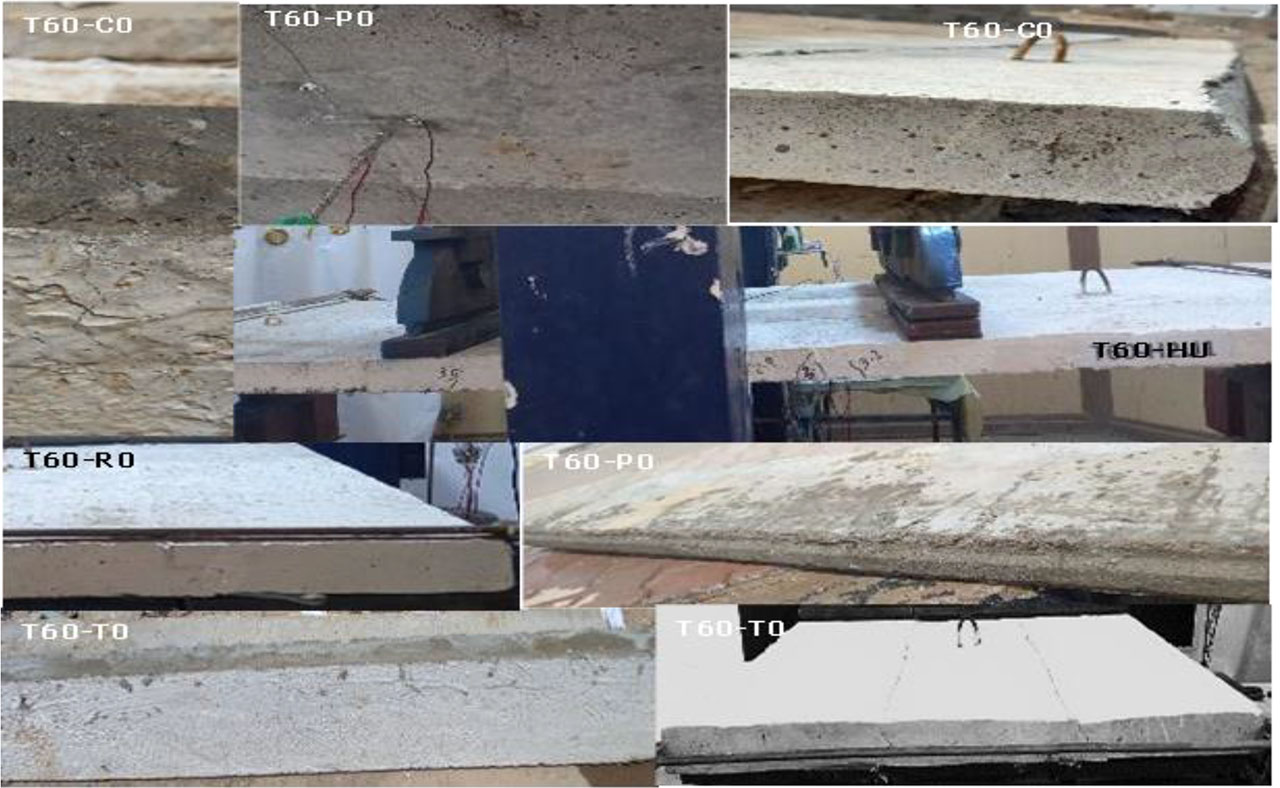
Figure 21:
Failure Mode of specimens
2.7.3. The impact of Joint’s Shapes and chemical treatments of joints on strain
To evaluate the structural continuity and load-transfer efficiency, longitudinal strain measurements were taken at two primary locations: the bottom centre of the midspan and the centre of the side panels. Additionally, transverse strains were monitored at the top and bottom of the cold joint interface, as well as at the centre of the specimen, to capture joint dilation and interfacial behaviour.
Mid span transverse strains
The development of transverse strains across the midspan specimen depth and at the joint interface is presented in Figure 15. The instrumentation layout provided distinct data points: Strain Gage 2 (SG2) monitored the solid concrete response at the bottom centre of the specimens, while Strain Gage 4 (SG4) and Strain Gage 5 (SG5) captured the interfacial behaviour at the bottom and top of the longitudinal joint, respectively. In all graphs, positive strain indicates tension, and negative strain indicates compression. Load-strain curves confirm a structural discontinuity at the cold joint. While the solid slab (SG2) exhibited lateral contraction (Poisson effect), the joint (SG4) showed high tensile strains due to separation and cracking. This divergence quantitatively proves the loss of tensile bond at the interface as shown Figure 22.
In the flat joint specimens (T60-F0) (cast sequentially), joint separation (T60-FS) occurred simultaneously at both the top and bottom interfaces upon reaching strain levels between 100 and 4,000 micro strains, respectively, indicating a highly unpredictable and brittle bond. In contrast, the epoxy-bonded flat joint (T60-FE) and the triangular joint (T60-T0) displayed a different failure mode, with separation initiating specifically at the bottom interface at 225 and 2100 micro strain, respectively. The triangular geometry facilitated a wedging action that promoted sliding and brittle failure, similar to the flat reference, confirming that a mechanical interlock with vertical bearing surfaces is essential for optimal cold joint integrity.
Furthermore, other joint configurations demonstrated varying degrees of separation resistance the trapezoidal joint (T60-P0) exhibited superior performance, sustaining strains up to 800 micro strains without debonding. This behaviour indicates limited strain localization and a relatively uniform transfer of forces across the interface. Furthermore, the strong interface contact-maintained displacement compatibility, enabling effective axial and shear force transfer across the joint (Sangkhon & Pisitpaibool, 2017).
The key-shaped joint effectively restricted dilation, maintaining transverse strains below 70 micro strains. Conversely, the rectangular joint (T60-R0), despite high interlocking resistance, experienced localized stress concentrations and abrupt strain drops at 2–3 kN. As loading increased, micro-cracking and interfacial slip induced a neutral axis shift, transitioning the mechanism from bending-dominated to compression-controlled. This shift was confirmed by the formation of a compressive strut, evidenced by the upper joint region’s transition from tensile to compressive strain. This significant variation in strain thresholds highlights how joint geometry and bonding agents fundamentally alter stress redistribution, transition the failure mode from brittle to ductile, and determine the structural integrity of the interface.
The semi-circular joint (T60-C0) enhances ductility but significantly reduces flexural stiffness, resulting in a hinge-like response with localized rotation. This behaviour limits moment transfer, however, the joint remains effective in transmitting axial and shear forces through membrane action, provided there is adequate confinement and reinforcement continuity. Consequently, the interface functions as a semi-rigid hinge in flexure while maintaining the wall's overall load-carrying capacity through in-plane force transfer mechanisms.
Among flat joints, UHPC-filled configurations (T60-HU) outperformed others, achieving continuous load transfer and high stiffness, the joint initially exhibits bending-dominated behaviour, with tensile strain developing in the upper region. As loading increases, improved contact within the UHPC-filled cavity redistributes internal forces, shifts the neutral axis, and activates the lower region in tension. At higher loads, compression strut action enhances load capacity and stabilizes the structural response.
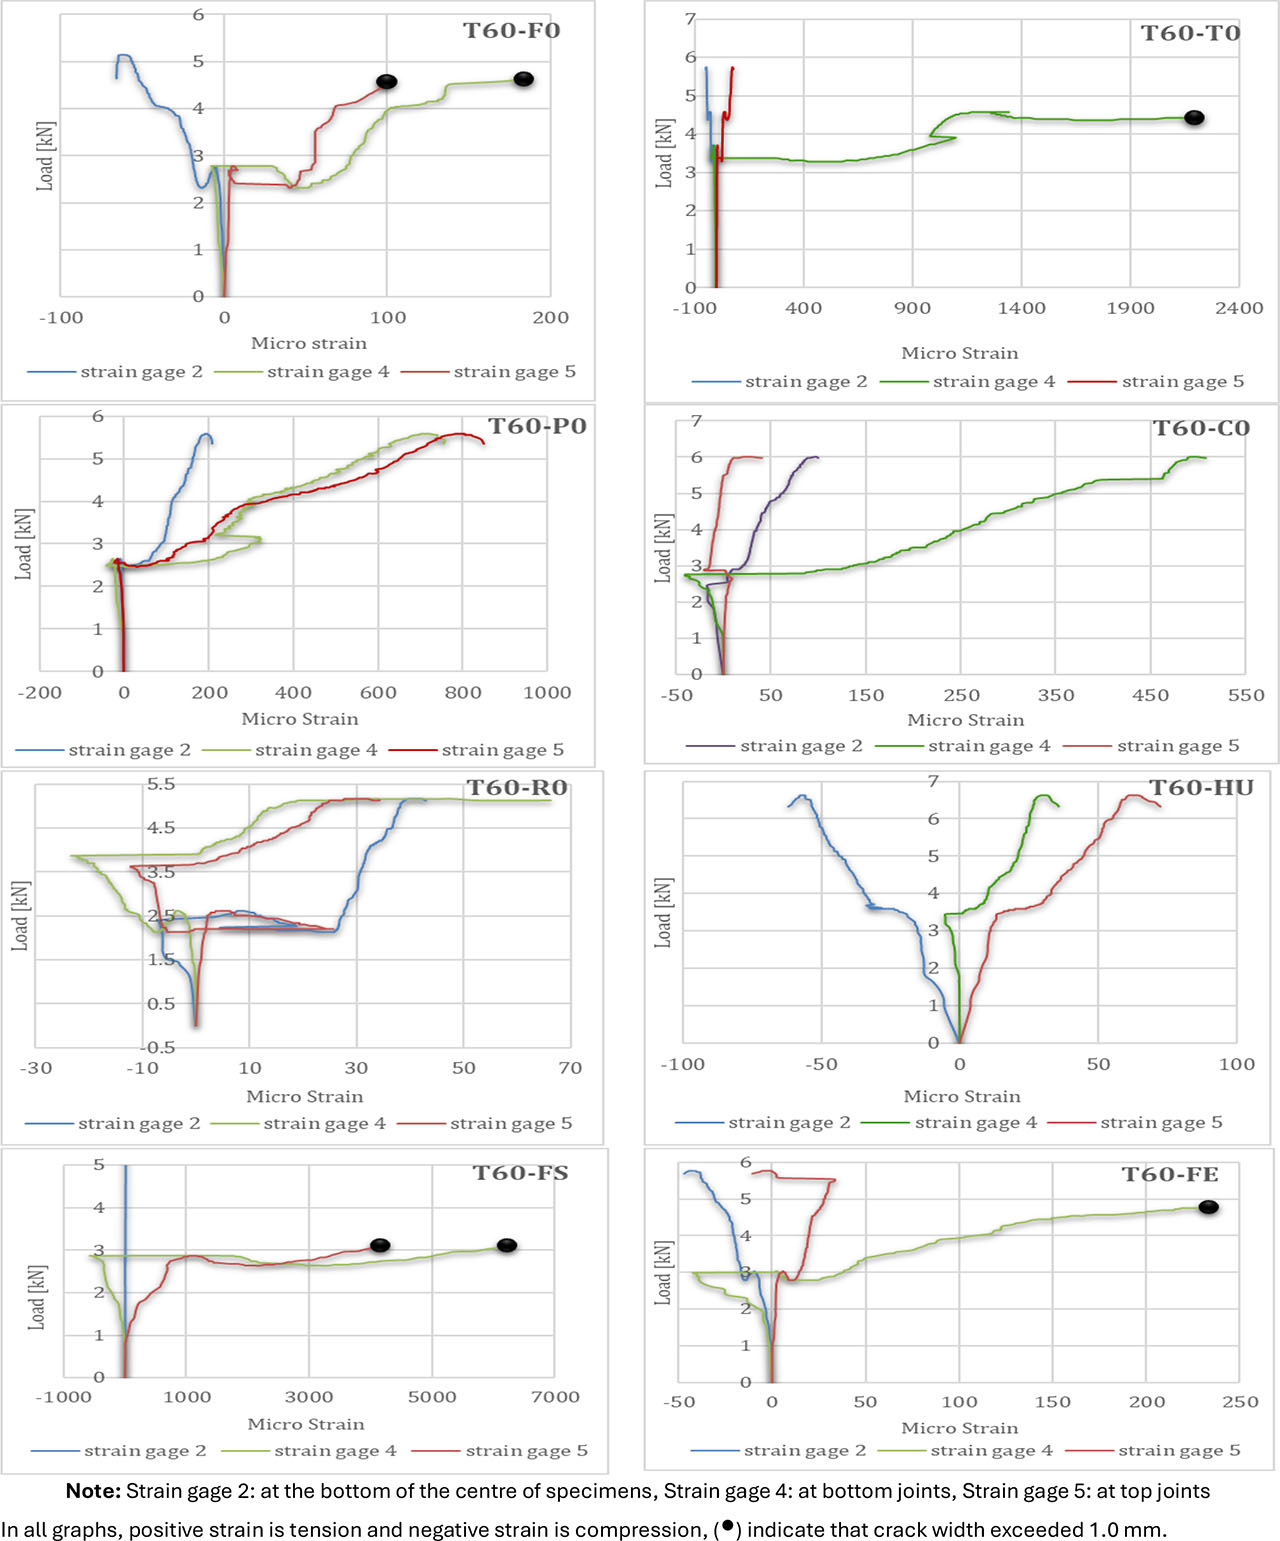
Figure 22:
Load-transverse strain curves at the midspan of the tested
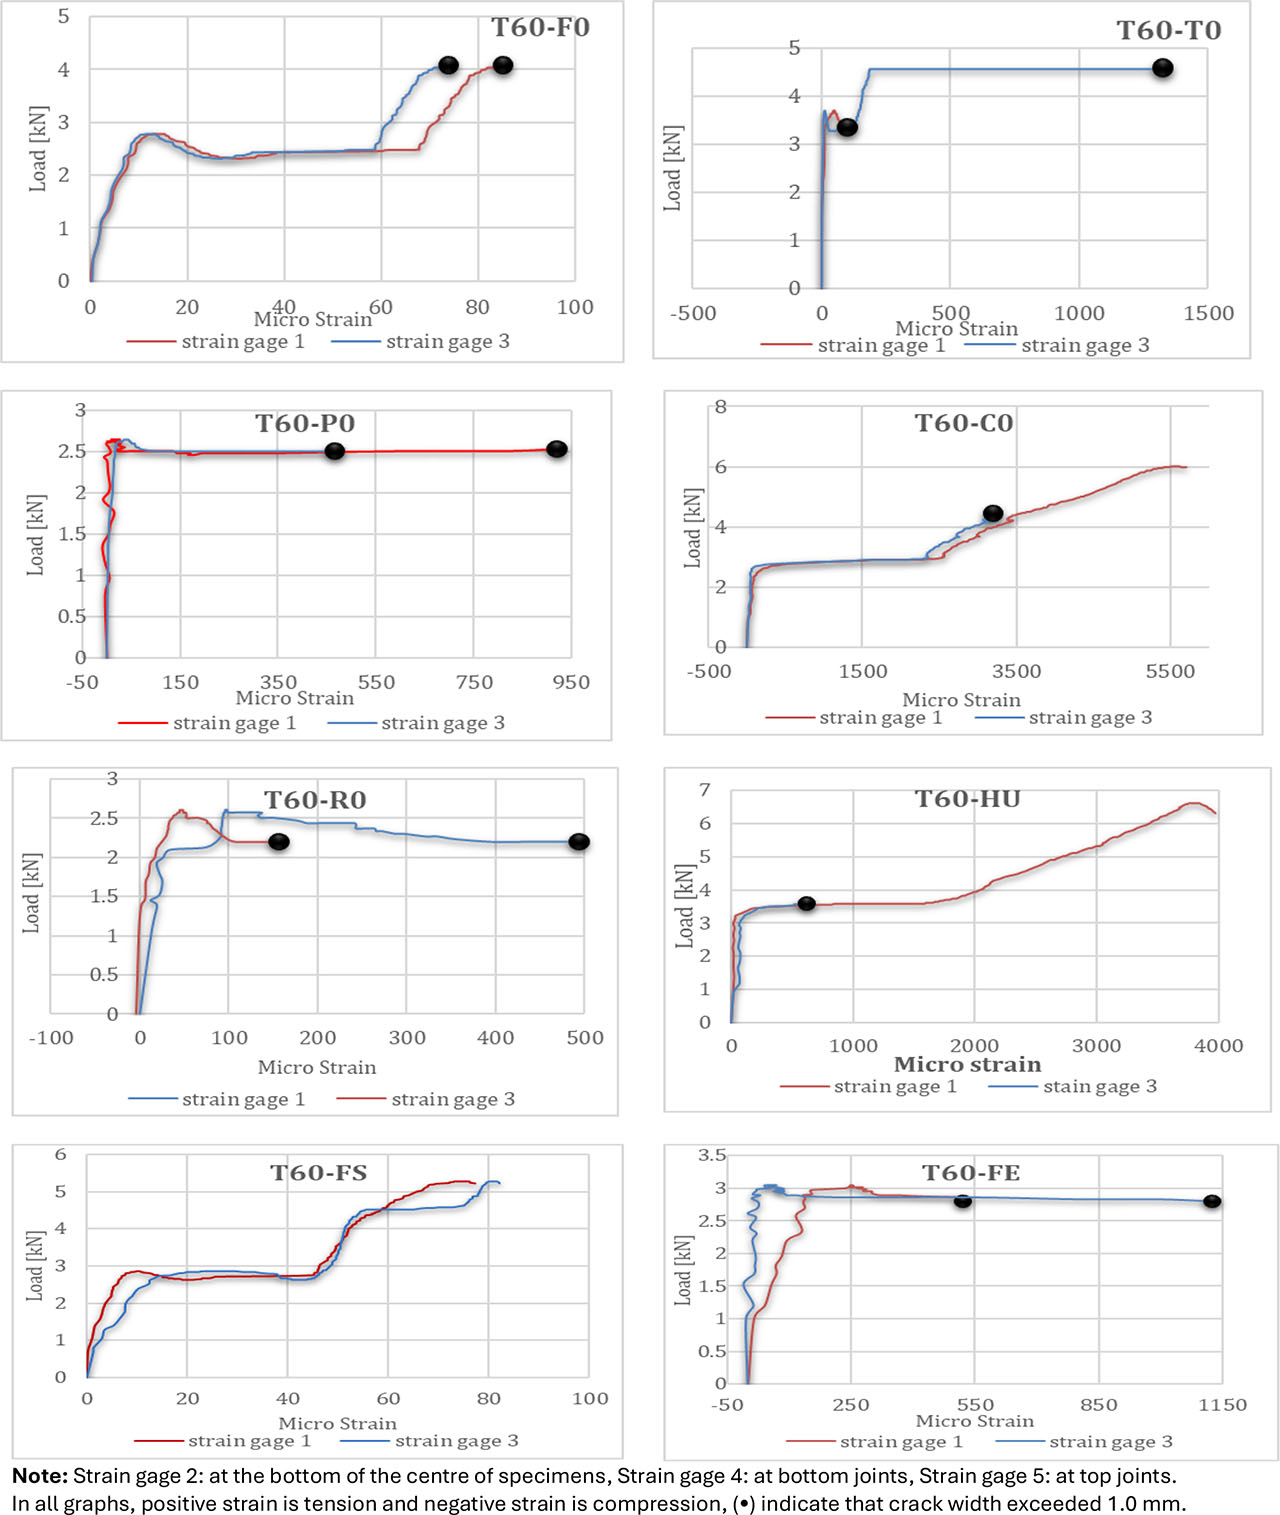
Figure 23:
Load-longitudinally strain curves at midspan of the tested specimens
Mid span longitudinal strains
The longitudinal strain profiles provide critical insight into the load-transfer efficiency between the central panels and the adjacent panels. In specimen with triangular joints (T60-T0), a significant divergence between long strain at centre panel (SG1) and long strain at side panel (SG3) was observed, particularly after reaching the cracking load, indicating a breakdown in structural continuity. From Figure 23, the semi-circular (T60-C0) and UHPC-filled (T60-HU) joints demonstrated high strains compatibility, with SG1 and SG3 maintaining synchronized strain development up to high load levels. This joints configuration effectively shields the central wall region by preventing the formation of transverse cracks and inhibiting their propagation from the side segments. Meanwhile, crack initiation and development in the outer wall segments occur progressively, ensuring a stable and controlled structural response.
3. Conclusion
Triangular joints and UHPC-injected treatments emerged as particularly effective solutions, enhancing yield load by 34% and ultimate load by 29%, respectively, though with trade-offs in deflection capacity. These findings challenge conventional approaches to cold joint mitigation by demonstrating that targeted geometric or chemical interventions can substantially improve structural performance without compromising ductility.
Despite variations in deflection, all specimens maintained high ductility meeting seismic performance requirements. The composite rectangular joint (T60-R0) exhibited the highest ductility (10.86364), though with lower yield load (7% reduction). This anomaly suggests that stepped profiles may promote gradual failure through distributed cracking, even with compromised strength. In contrast, specimen have joints fill with UHPC showed low ductility (8.73), consistent with their brittle failure mode.
This study does not focus solely on the load–displacement capacity of the specimens; rather, its primary emphasis is on the mechanical behavior of the joints. Therefore, strain measurements were recorded and analyzed at the upper and lower regions of the joint at the midspan of the specimen to accurately capture the joint response. The performance of these joints is the key indicator for evaluating the diaphragm wall’s effectiveness, particularly with respect to controlling water leakage and maintaining the stability and integrity of the excavation zone. Consequently, the observed structural response of the joints provides more meaningful insight into the overall functionality of the wall system than strength capacity alone.
The comparative strain–load evaluation confirms that joint geometry and interfacial treatment fundamentally govern the structural efficiency and failure characteristics of precast diaphragm wall connections. Among all investigated configurations, the trapezoidal joint (T60-P0) and the UHPC-filled hollow joint (T60-HU) demonstrated the most desirable performance, combining stable mechanical response, efficient load transfer, and favorable strain distribution.
The trapezoidal joint exhibited the most uniform strain development with minimal localization and cracking, indicating superior displacement compatibility and force transmission. Similarly, the UHPC-filled joint provided near-monolithic behavior through enhanced contact conditions and compression strut activation, resulting in high stiffness and sustained load capacity.
In contrast, rectangular and triangular joints, while offering high interlocking resistance and improved shear capacity, suffered from localized stress concentrations and less stable strain behavior, and epoxy-bonded joints showed brittle failure modes that limit their structural reliability under demanding loading conditions.
These findings strongly support the adoption of engineered joint solutions, particularly trapezoidal and UHPC-filled configurations, as optimal connection systems for precast diaphragm walls. Their ability to provide controlled cracking, stable load transfer, and robust mechanical performance makes them especially suitable for applications requiring high structural reliability, ductility, and long-term serviceability.
This study provides a strong foundation for performance-based design of diaphragm wall joints, demonstrating that optimized joint geometry and treatment significantly enhance load transfer and deformation control. Future research should extend these findings to field conditions, particularly under soil–structure interaction and seismic effects and evaluate long-term durability through environmental exposure studies. The proposed joint solutions offer a promising advancement for improving the reliability and performance of deep excavation support systems.
The experimental investigation into the mechanical behavior of various longitudinal joint configurations and chemical treatments yields the following comprehensive conclusions:
Load-strain analysis confirms that conventional cold joints introduce a significant structural discontinuity, where the interface fails to develop a reliable load-transfer mechanism, leading to unpredictable and brittle simultaneous separation at both top and bottom interfaces.
The UHPC-injected joint (T60-HU) provided the most substantial performance enhancement, achieving a 29% increase in ultimate load and a 24% increase in yield load. This is attributed to the high-strength dowel action of UHPC, which effectively bridges the interface and stabilizes the structural response through a transition to a compression-controlled strut mechanism.
While the Triangular Joint (T60-T0) achieved the highest increase in cracking load (40%) at the expense of a 22% reduction in deformation capacity and significant strain localization, the Semi-circular Joint (T60-C0) demonstrated a more balanced performance. The latter provided a 17% increase in ultimate load and an 18% reduction in ultimate deflection, ensuring uniform stress distribution and enhanced ductility through a hinge-like response and membrane action.
The application of Epoxy adhesive (T60-FE) increased cracking load by 9.5% by creating covalent bonds that improved interfacial shear resistance while preserving yield deflection characteristics better than geometric joints with lowest ductility. However, epoxy treatments resulted in fewer but wider cracks, whereas UHPC promoted multiple fine cracks at the expense of higher localized stress concentrations.
Joint geometry fundamentally alters the threshold of initial debonding; the trapezoidal joint (T60-P0) sustained strains up to 800 micro strains without debonding, while the key-shaped joint effectively restricted joint dilation, maintaining transverse strains below 70 micro strains.
A critical trade-off was observed across all high-performance configurations, while UHPC and triangular profiles maximize load capacity, they lead to more brittle failure modes and lower ductility indices. The rectangular joint (T60-R0), despite its interlocking resistance, exhibited inferior performance due to stress concentrations at step corners, which promoted premature cracking.
Advanced configurations, specifically UHPC-filled and semi-circular joints, effectively maintain displacement compatibility and synchronized strain development between panels, shielding the central wall by inhibiting crack propagation. While UHPC-injected joints are recommended for applications requiring maximum load-bearing capacity, the semi-circular geometry offers a more balanced performance for seismic loading, where its ability to ensure a progressive failure mode, energy dissipation, and enhanced ductility is prioritized.
Acknowledgements
The authors would like to express their gratitude to the staff of the Structural Laboratory at University of Babylon.
Notes
[15] Contributed by Author Contributions
All authors critically reviewed and approved the final version of the manuscript and agreed to be accountable for all aspects of the work. All authors have accepted responsibility for the entire content of this manuscript and approved its submission.
[16] Disclosure of Interest
The authors state no conflict of interest or personal relationships that could have appeared to influence the work reported in this paper.