

Table 2:
Chemical composition of Iron powder waste and sand
| Element [at. %] | Iron Powder | Sand |
|---|---|---|
| Fe | 53.05 | 3.053 |
| O | 37.37 | 47.06 |
| C | 3.971 | 5.283 |
| Al | 1.531 | 1.998 |
| Si | 1.094 | 16.90 |
| Ca | 0.9304 | 22.27 |
| Mg | 0.2742 | 1.517 |
| Mn | 0.2574 | 0.03586 |
| Zn | 0.2468 | 0.01114 |
| Ti | 0.2245 | 0.3030 |
| Na | 0.2187 | 0.3124 |
| S | 0.2111 | 0.1133 |
| K | 0.1575 | 0.6180 |
| Cu | 0.09433 | - |
| Cl | 0.09119 | 0.09269 |
| Cr | 0.08109 | 0.04485 |
| Ni | 0.05807 | 0.01234 |
| Ba | 0.05070 | 0.1779 |
| Pb | 0.02089 | - |
| P | 0.02059 | 0.03559 |
| Nb | 0.01356 | 0.002971 |
| Zr | 0.01152 | 0.06760 |
| Pa | 0.01063 | - |
| Sr | 0.007697 | - |
| Rb | - | 0.01009 |
| Mo | 0.004148 | - |
| Tot | 100 | 100 |
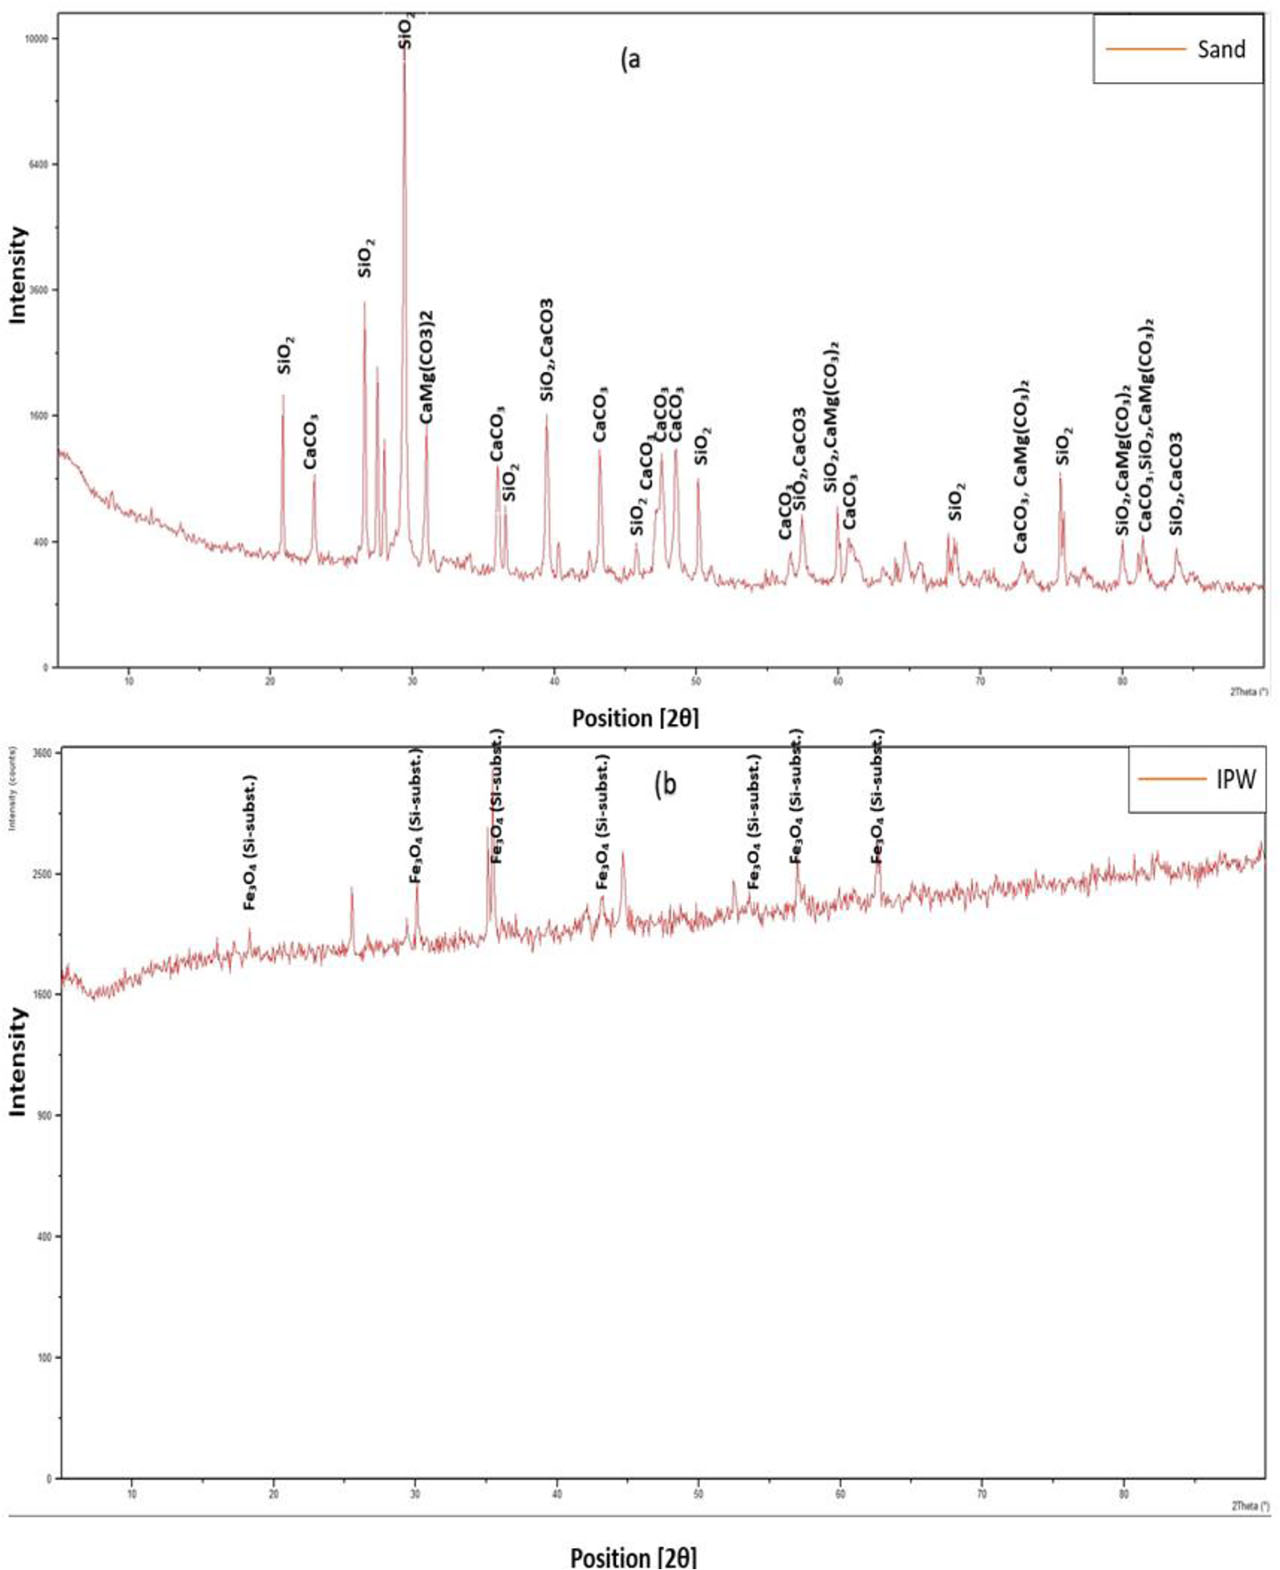
Figure 2:
(a) XRD analysis of the sand; (b) XRD analysis of Iron Powder Waste
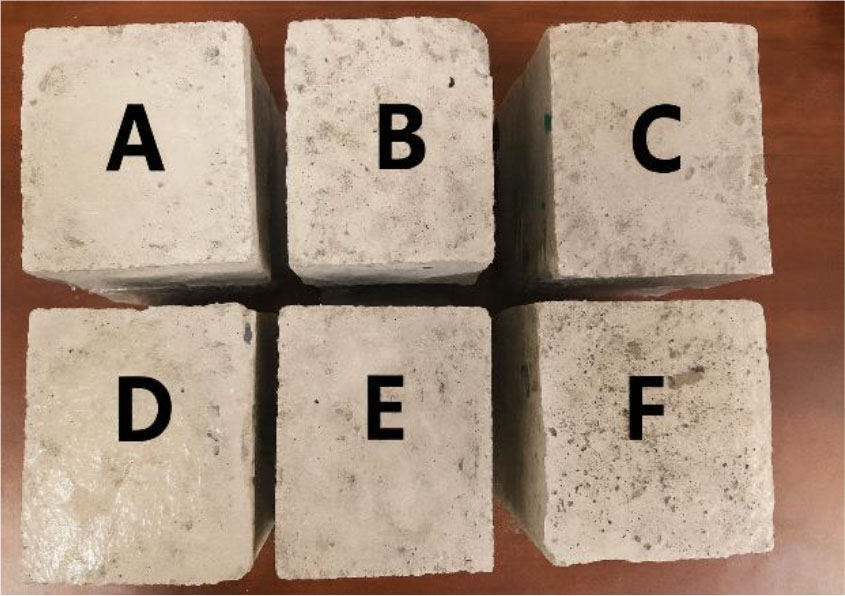
Figure 4:
A) MIP0+ 0% IP; (B) MIP5+ 5% IP; (C) MIP10+ 10% IP; (D) MIP15+ 15% IP; (E) MIP20+ 20%; (F) MIP25+ 25%
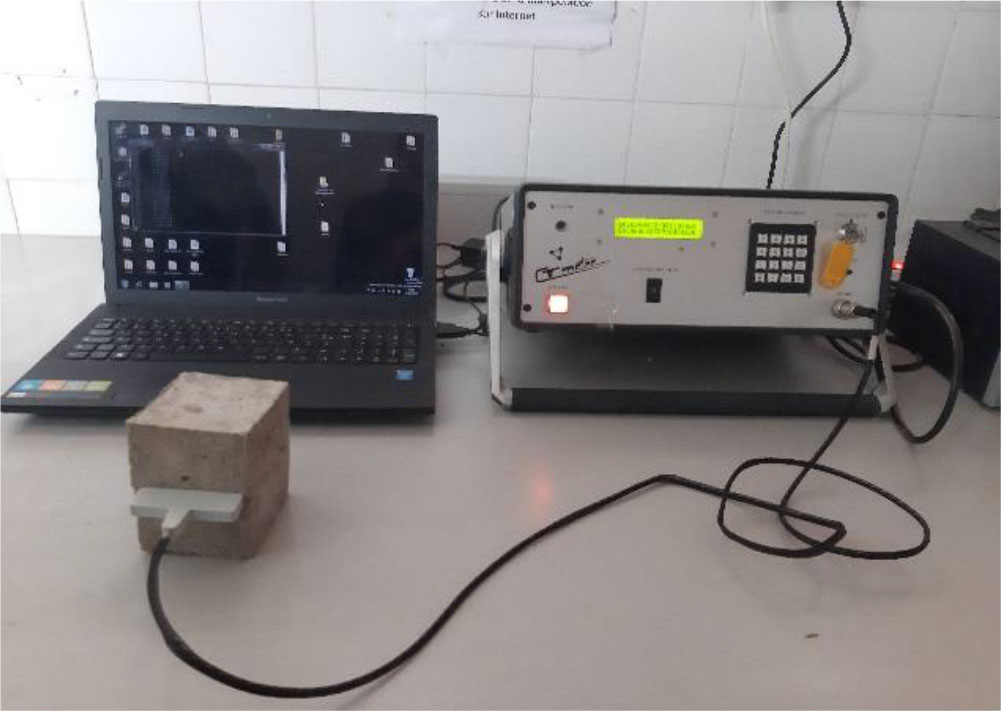
Figure 7:
CT meter
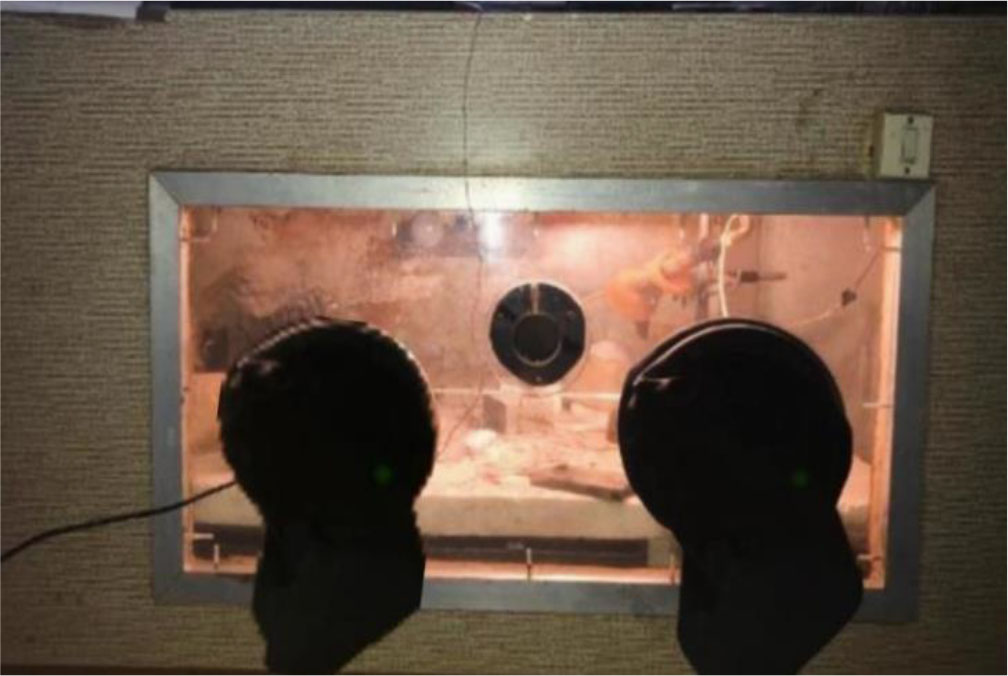
Figure 8:
The glove box
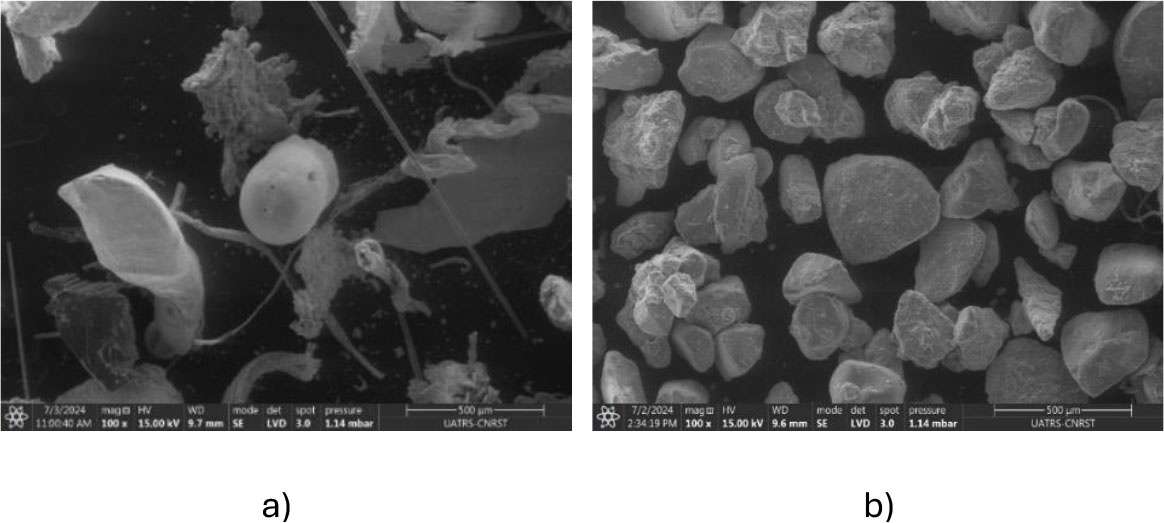
Figure 9:
Scanning electron microscopy of (a) Iron powder waste, and (b) Sand
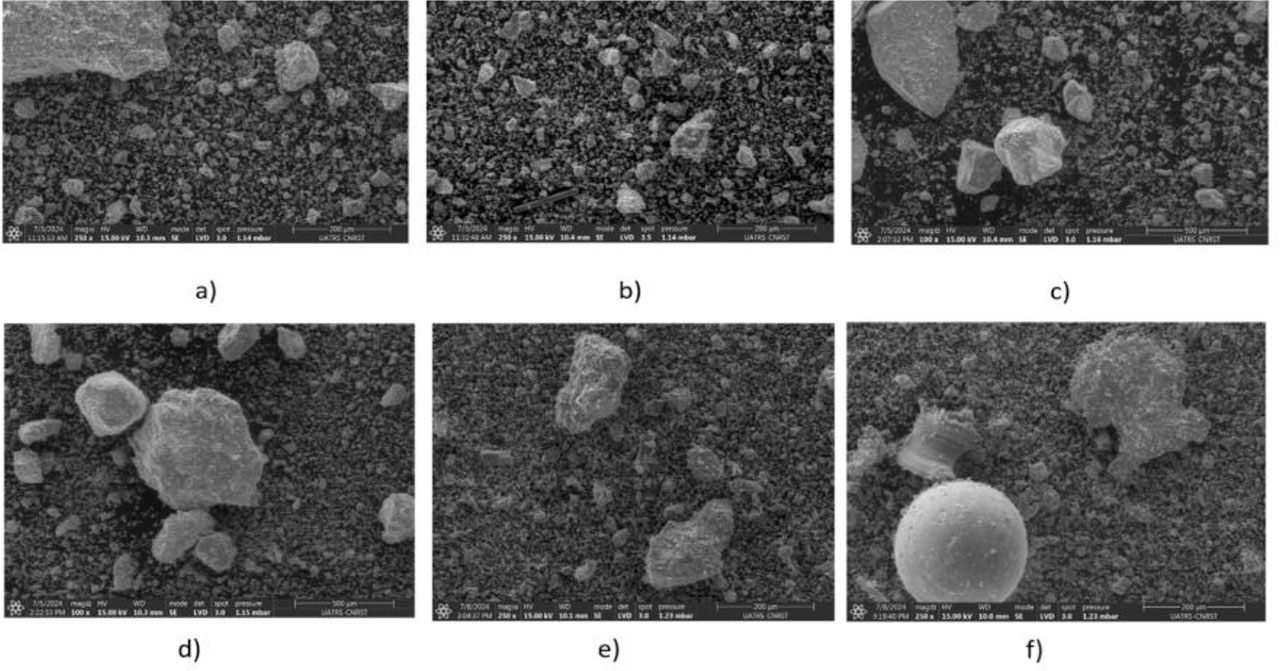
Figure 10:
SEM images of concrete samples: a) MIP0+ 0% IP, b) MIP5+ 5% IP, c) MIP10+ 10% IP, d) MIP15+15% IP, e) MIP20+20% IP, f) MIP25+25% IP
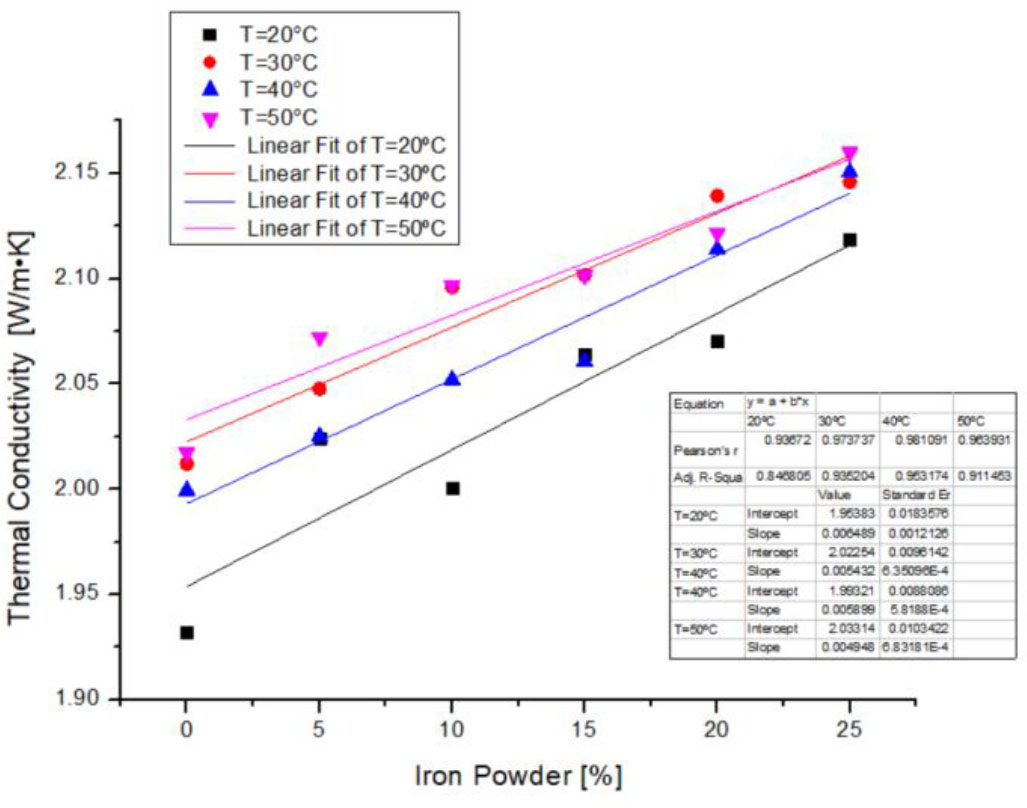
Figure 16:
The Thermal conductivity of composites as a function of temperature and IPW content
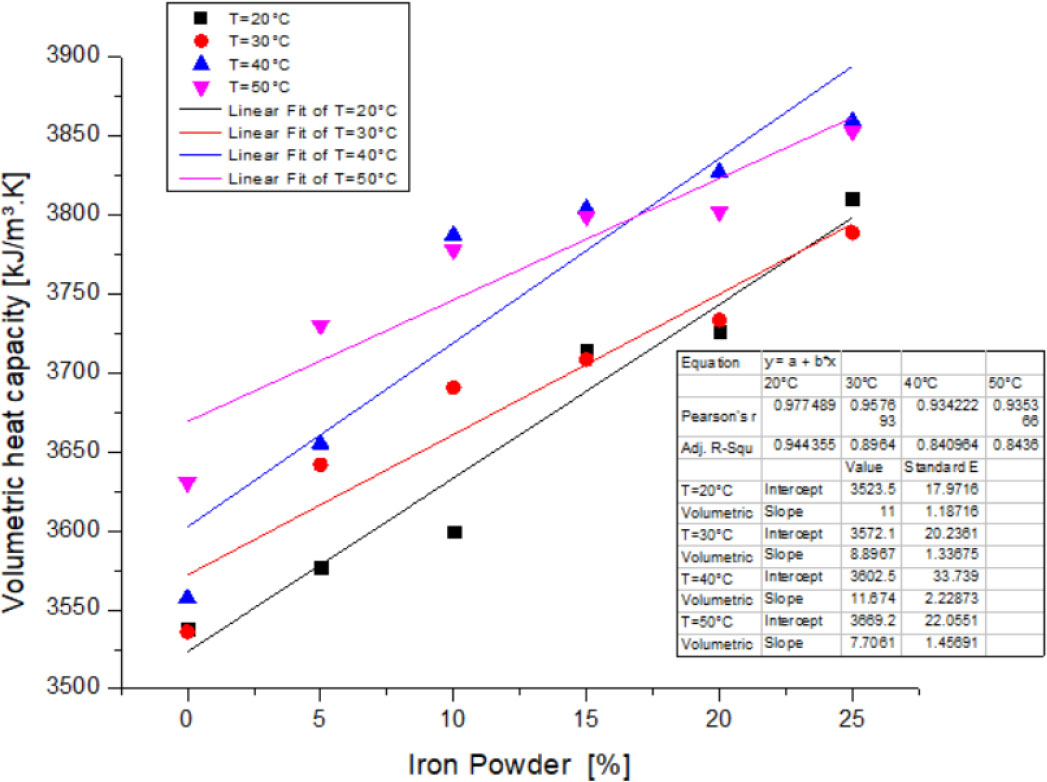
Figure 18:
The volumetric heat capacity of composites as a function of temperature and IPW content
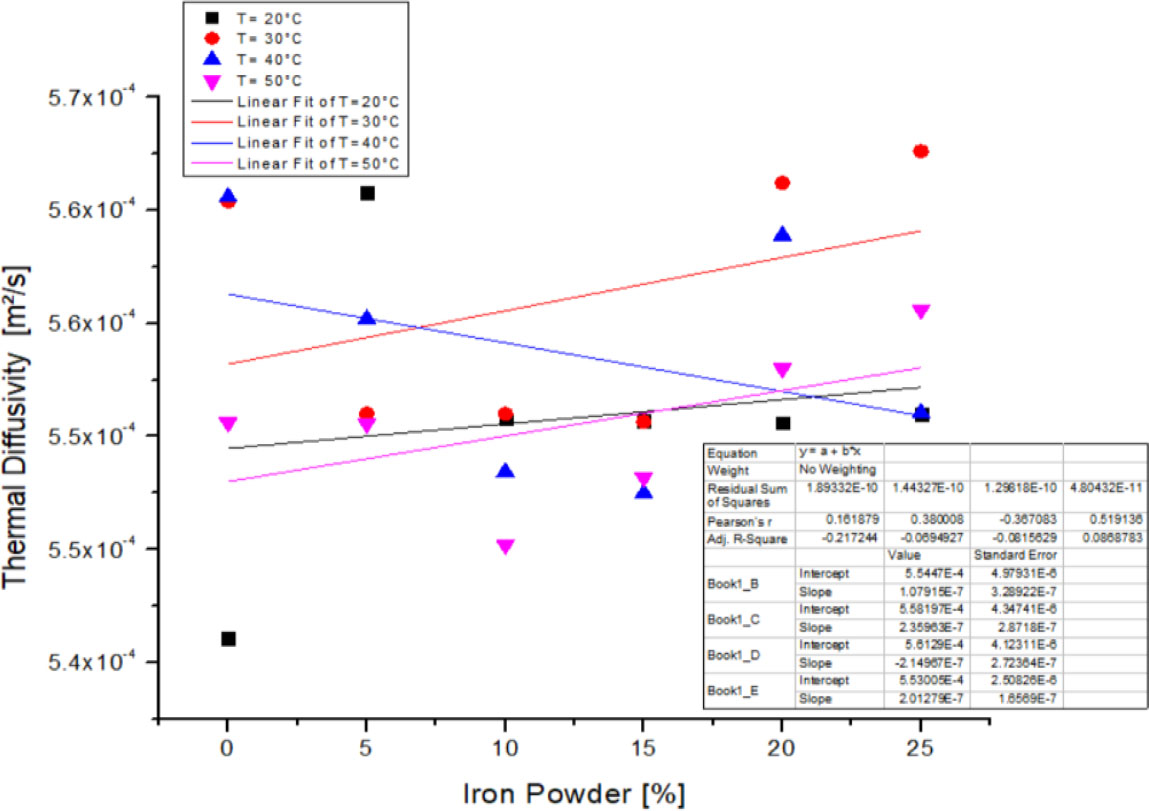
Figure 20:
The thermal diffusivity of composites as a function of temperature and IPW content
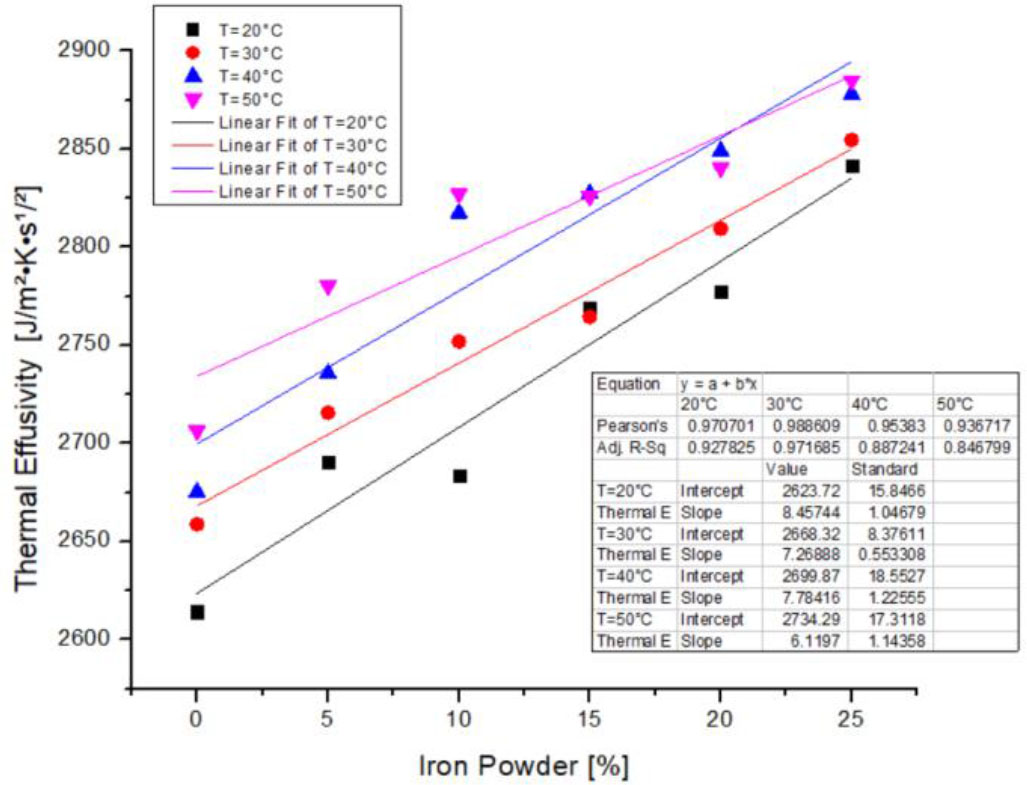
Figure 22:
The thermal effusivity of composites as a function of temperature and IPW content